Square
Following
Hot
News
Profile
Share your thoughts
placeholder
Article
$PEARL Today looks weaker than the market: the price is falling, while elevated turnover points more to profit-taking and redistribution than to sustained demand.
The main fundamental backdrop remains positive for AI infrastructure, but after its sharp rise, the token is facing a high valuation, new issuance pressure, and a lack of a fresh confirmed catalyst.
Deep Dive
1. Selling after a strong rally
Pearl (PEARL) is trading around $1.55, down 0.63% over 24 hours and 23.03% over 7 days. By comparison, Bitcoin (BTC) changed by approximately -0.20% and -4.54% over the same periods, so PEARL’s we
PEARL-2.04%
BTC-0.67%
🚨⚠️ ATTENTION ALTCOIN HOLDERS! PLEASE READ THIS CAREFULLY! 👀
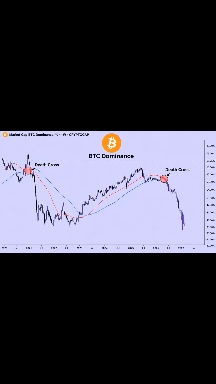
📉 BITCOIN DOMINANCE IS SHOWING A POTENTIAL DEATH CROSS! ☠️
🔥 Could this be the signal altcoin holders have been waiting for?
💎 If BTC dominance starts dropping, could altcoins finally get their moment to shine? 🚀
🐂 Is the next ALTCOIN SEASON getting closer?
👀 WATCH THE VIDEO CAREFULLY — THIS COULD BE AN IMPORTANT MOMENT FOR THE ALTCOIN MARKET!
💬 Which 5 altcoins are you watching for the next big move?
🔔 FOLLOW for more crypto market updates! 🚀💰
$BTC $ETH $SOL
BTC-0.65%
ETH-1.23%
SOL-0.74%
Trenches
IDOL
I
bade
b
IDOL
0x3b...ab07
Market Cap
$.
Change
.
24h Vol
$.
Holders
.
ZIG
Z
bade
b
ZIG
0x8c...1145
Market Cap
$.
Change
.
24h Vol
$.
Holders
.
Q
Q
bade
b
Q
0xc0...0589
Market Cap
$.
Change
.
24h Vol
$.
Holders
.
SAFU
S
bade
b
SAFU
0x7c...7777
Market Cap
$.
Change
.
24h Vol
$.
Holders
.
STONK
S
bade
b
STONK
6GmA...UNgx
Market Cap
$.
Change
.
24h Vol
$.
Holders
.
btc update
live-cover
LIVE1,098
Gold is closing in on the 3,900 mark, plunging more than $110 intraday, while silver's losses widen to 5.4%! Another oil tanker attack has been reported in the Strait of Hormuz, sending oil prices higher and stoking inflation worries. Expectations of Fed rate hikes are weighing heavily on precious metals. Is this gold sell-off a panic-driven overreaction or a trend reversal? Friends, can your gold positions hold up tonight?
#ETHPullsBackTo2200 #ShareWeekly
Ethereum Recovers to $2,245 While Bitcoin Trades at $77,345: Is ETH Preparing for a Stronger Rebound?
Ethereum is showing signs of stabilization after its recent decline toward the $2,200 region. ETH is now trading around $2,245, while Bitcoin is trading near $77,345. Although both assets remain under pressure compared with their recent highs, the latest price levels raise an important question: Is Ethereum beginning to attract buyers again, or is this simply a temporary recovery within a broader downward trend?
The difference between these two assets goes bey
ETH-1.26%
BTC-0.67%
  • 2
#晒出我的合约收益 Can't short altcoins anymore.png
Sometimes what I talk about isn't just trading; it's personal asset allocation.
I believe that, over the long term, the purchasing power of the yuan and the U.S. dollar will decline, and holding BTC or core U.S. stock assets for the long term is the best choice.
Trading means simply going long or short. Don't keep conflating the two.
Take U.S. stocks, for example: I sold RKLB at a 20% loss, so I've stopped buying individual U.S. stocks to try to beat the index. Buying the index is the biggest alpha, unless a genuine opportunity like Nvidia in 2023 or memory stocks in 2025 comes along, in which
post-image
INTC-28.49%
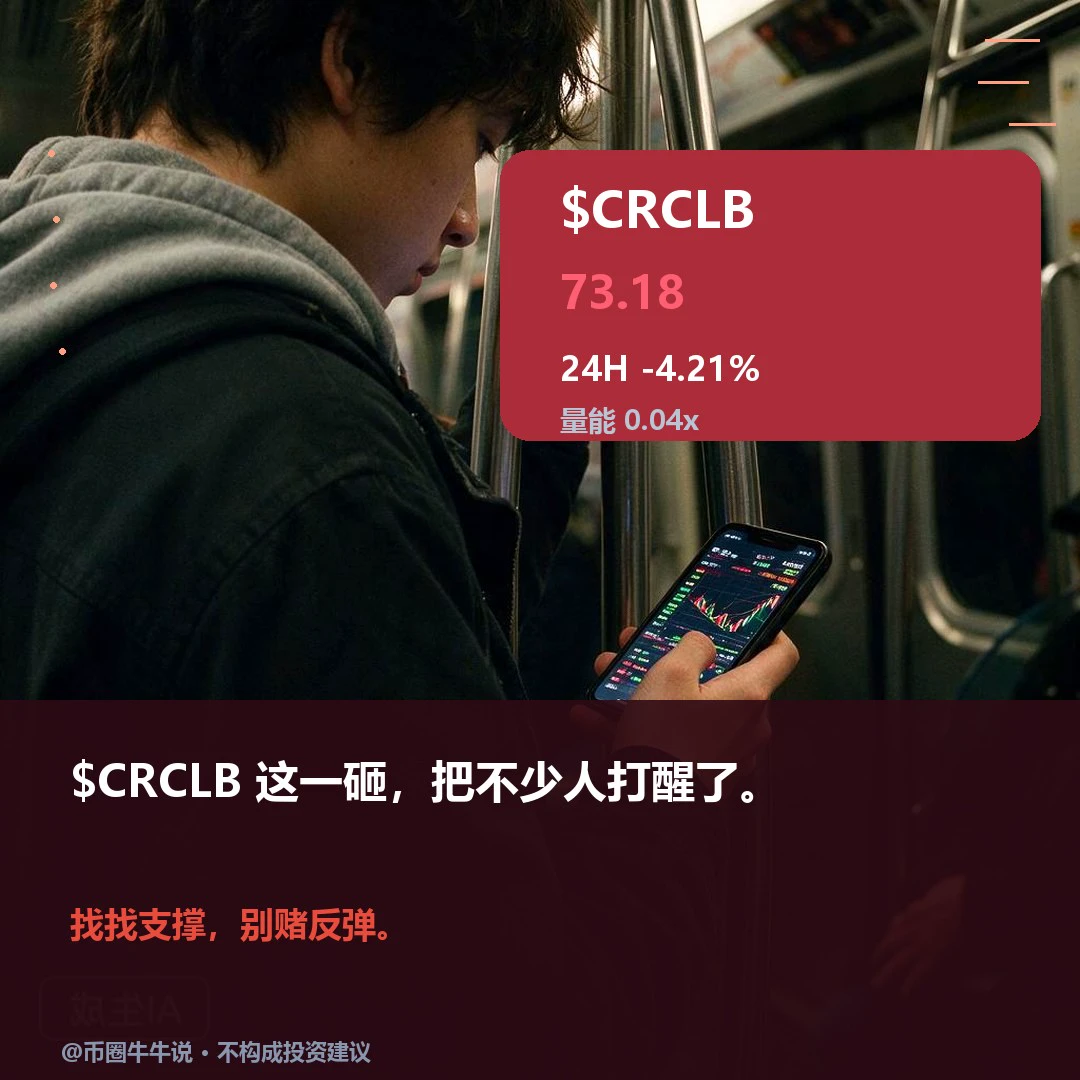
Weak. $CRCLB is currently at 73.18, down more than four percentage points on the day, but its four-hour RSI has entered oversold territory. Can this divergence between the decline and the oversold signal be taken as evidence of a bottom?
A sharp drop only shows that selling pressure has occurred; it does not automatically mean the price is cheap. The one-hour trend remains weak, with the price still hugging below the short-term moving average. Trading volume is less than one-fifth of normal, indicating very low market participation. This oversold reading looks more like a natural slide with no
post-image
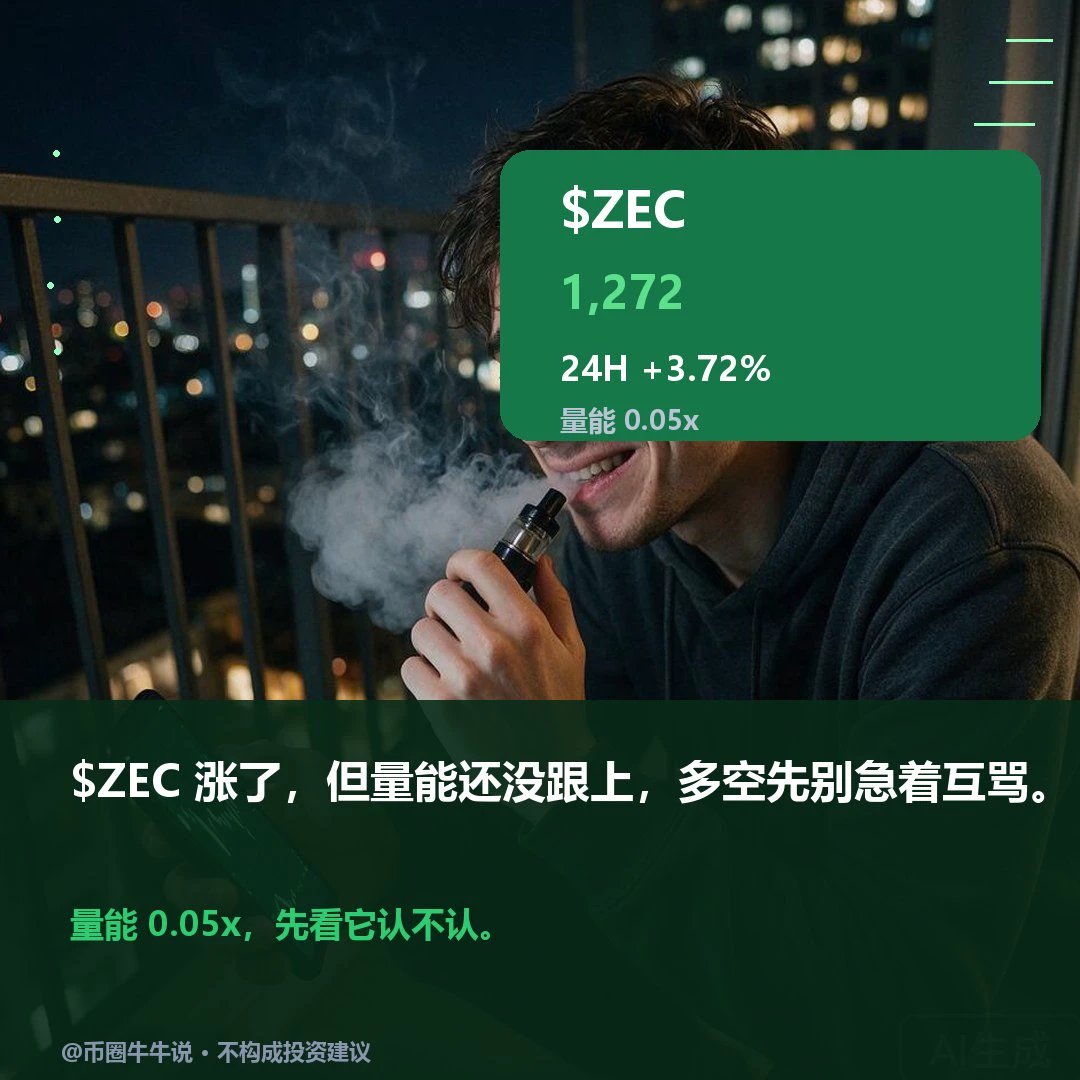
$ZEC Currently trading at 1272.32, up 3.72% over 24H. The 1H trend is bullish (RSI 60), with resistance at 1297.61; the 4H trend is bullish (RSI 47), with support at 1182.22. Holding above 1297.61 could signal further gains, while a break below 1207.65 could indicate weakening. Watch for an increase in trading volume; otherwise, the sustainability of the rebound is uncertain. The market is highly volatile; for observation only.
post-image
ZEC+1.16%
#USEarningsSeason #ShareWeekly
US Earnings Season: Beyond the Numbers, What Corporate Results Reveal About the Next Market Direction
US earnings season is more than a routine period of financial reporting. It is one of the most important opportunities for investors to understand the real condition of the global economy, evaluate corporate strength, and identify where financial markets could be heading next. Every quarter, major American companies publish their financial performance, offering valuable information about business growth, consumer behavior, industry competition, and future econom
BTC-0.67%
  • 3
  • 2
#GoogleCloudSurges103%ButStockFalls #ShareWeekly
Alphabet’s AI Investment Dilemma: Record Cloud Growth, Rising Costs, and the Battle to Convince Wall Street
The latest performance of Alphabet (Google) highlights one of the biggest contradictions in today's technology market: a company can deliver extraordinary business growth and still experience a sharp decline in its share price.
Google Cloud's impressive 103% year-over-year revenue growth demonstrates that demand for cloud computing and artificial intelligence infrastructure is accelerating. However, Alphabet's stock falling nearly 10% sho
GOOGL+0.11%
  • 1
  • 1
The phone screen suddenly turns bright red! $Q Q short position unrealized gains surge 426%!
A perfectly timed short from the 0.058882 high, crushing the move with 10x leverage as the price violently plunged through to 0.033540! Trader Long Ge feasted on this short-side harvest!
Looking at the chart, the price is plunging rapidly along the descending trendline, with a massive bearish candle breaking through everything. Bearish momentum is extremely strong, with no sign of a bottom or rebound.
What’s next? The downside is now wide open, with strong support below at the 0.02 level. Any weak rebo
Q-27.77%
BTC-0.65%
ETH-1.23%
IT Home reported on October 31 that director Rian Johnson has launched Chromagraph Camera, an iPhone camera app that went live on the App Store on October 22. Developed by Steve Yedlin, the app aims to bring the image-processing style of the Knives Out series to mobile photography.
Turning the director and cinematographer’s private color-grading workflow into a publicly available app gives it a clear selling point. But whether ordinary users are willing to give up their phones’ default sharpening and noise reduction in favor of a RAW workflow will determine its success.
$BTC
BTC-0.67%
Next up, my friend 😎✋.$B$AIN
$BTC
USMidtermElections
post-image
AIN+3.85%
BTC-0.67%
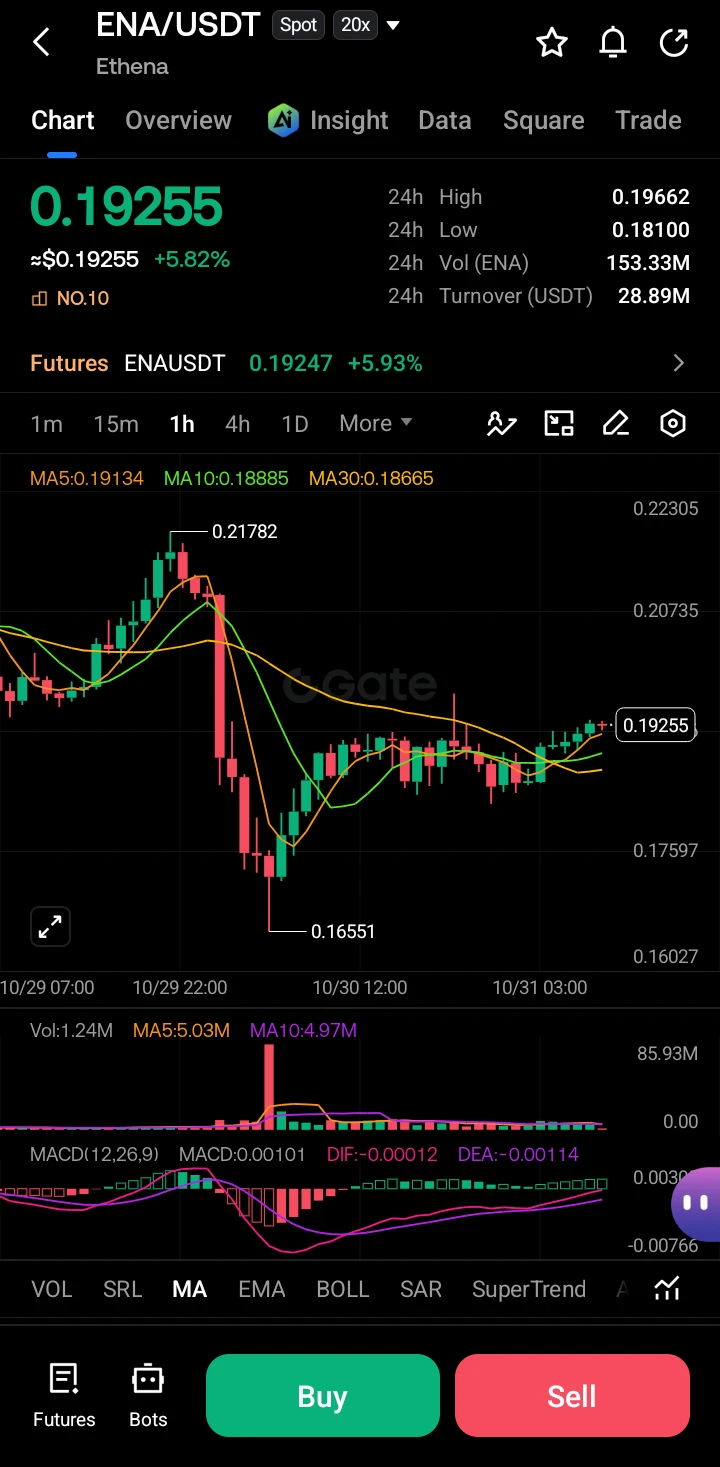
ENA/USDT Market Update (1H Chart)
$ENA ‌
Current Market Situation
ENA is trading at 0.19255 (+5.82% in 24h), recovering after a sharp dump from 0.21782 to 0.16551. Price has reclaimed the short-term MAs and is consolidating with mild bullish momentum. 24h range sits between 0.18100–0.19662 on solid volume (153M ENA).
Key Levels
Resistance: 0.1966 (24h high) → 0.207–0.218
Support: 0.188–0.186 (MA10/MA30 cluster) → 0.181 → 0.1655 (recent low)
Kline Deep Analysis
After the violent sell-off, price formed a clear V-recovery. Recent 1H candles are mostly green with higher lows, price holding above
post-image
ENA+8.04%
  • 2
A roadmap should not just be a promise; it should leave behind verifiable footprints. 🌍
Yesterday, we discussed why ONEA chose long-term planning. At the same time, the community raised a very important question:
If a journey is planned to last for years, how can everyone know during that time whether the project is making meaningful progress?
This is a question we should now discuss seriously.
A roadmap can tell everyone where a project hopes to go. But a roadmap alone cannot prove that it is moving in the right direction.
Real confidence comes from examining what has already happened, stayi
post-image
  • 1
$XAUUSD Gold’s price action yesterday was quite something! It fell below the expected 3,900 level, wicked down to 3,891 in 15 minutes, then rebounded, but still failed to form a reversal trend. The price continued falling afterward, hitting a low of 3,870. Gold is an asset that can make big money, but it’s also crazy, 😎😎😎
XAUUSD-3.63%
🌈 Gate Live Streaming Inspiration - October 31
Trending Topics:
🔹 BTC breaks above 77,000 USDT, with its 24-hour loss narrowing to 2.67%
🔹 Total crypto market cap exceeds $2.60 trillion, with Bitcoin dominance at 59.9%
🔹 Draft Ethereum proposal aims to let wallets permanently disable EIP-7702 delegation
🔹 U.S. stocks open as tech selloff continues; Intel plunges 25.7%
🔹 Yi Lihua: Patiently wait for the best dip-buying opportunity; still bullish on quality AI stocks and crypto assets
🔹 Bonk Guy: Altcoins are holding up relatively well as Bitcoin falls; bullish on the market over the next
post-image
BTC-0.67%
ETH-1.26%
INTC-28.49%
  • 9
  • 5
MARKET OVERVIEW
live-cover
LIVE1,781
Load More

Join 40 M users in our growing community

⚡️ Join 40 M users in the crypto craze discussion

💬 Engage with your favorite top creators

👍 See what interests you

Trending Topics

BTC大跌

218.75k Views39.54k Discussing

$BTC briefly fell below $77,000 and remains under pressure around the $77K zone, with its 24-hour decline still above 4%. With risk appetite weakening and Fed uncertainty rising, where is the next key support after losing $80K?

IntelBeatsEarningsButStockPlunges

15.54k Views775 Discussing

StrategySTRCNears100ParValue

19.62k Views4.05k Discussing

View More