Square
Following
Hot
News
Profile
Share your thoughts
placeholder
Article
Floki all time high hype ath go
post-image
FLOKI-2.04%
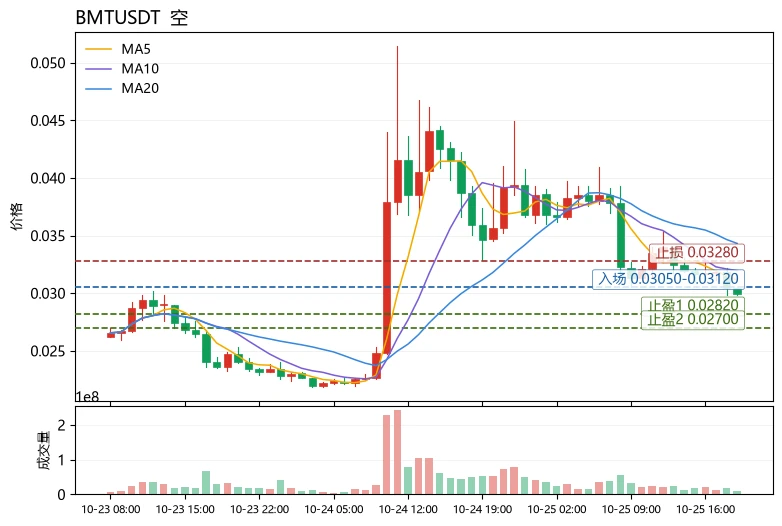
$BMT Current price: 0.02995. Key short-term levels: resistance at 0.03112 (MA5) and 0.03432 (MA20); support at 0.02818 (lower Bollinger Band). Price is trading below MA5 and MA20, with the moving averages in a bearish alignment and MA20 exerting clear downward pressure, pointing to a weak mid-term structure. The MACD histogram remains negative at -0.000717, with no sign of easing bearish momentum. RSI at 38.8 is in weak territory but not yet oversold, leaving room for further downside. The current price is close to the lower Bollinger Band at 0.02818, indicating weak price action tracking the
post-image
LINK-1.79%
Trenches
ZIG
Z
bade
b
ZIG
0x8c...1145
Market Cap
$.
Change
.
24h Vol
$.
Holders
.

STONK
S
bade
b
STONK
6GmA...UNgx
Market Cap
$.
Change
.
24h Vol
$.
Holders
.
CNPY
C
bade
b
CNPY
0xc6...ddd2
Market Cap
$.
Change
.
24h Vol
$.
Holders
.
BTC
B
bade
b
BTC
C5xp...pump
Market Cap
$.
Change
.
24h Vol
$.
Holders
.
LIGHT
L
bade
b
LIGHT
0x47...3c0e
Market Cap
$.
Change
.
24h Vol
$.
Holders
.
Why Can a Strategy Perform Well in Trending Markets but Suffer Consecutive Losses in Choppy Markets?
Have you noticed this?
When the market keeps rising, a strategy may seem to generate accurate signals and steady profits; but when prices start moving sideways and fluctuating up and down, the same strategy may hit stop-losses repeatedly.
Why do the results change completely when the trading rules have not changed?
The answer may be that a strategy’s edge often depends on specific market conditions rather than working in every market.
I. What exactly is the difference between trending and chopp
post-image
XRP market update
live-cover
LIVE1,802
#GateWCTCS9GlobalTradingCompetition

Gate WCTCS9 Global Trading Competition Highlights the Growing Importance of Strategic Trading
The Gate WCTCS9 Global Trading Competition represents an important opportunity to examine how competitive trading is evolving within the digital asset industry. As cryptocurrency markets attract participants with different levels of experience, trading competitions are becoming a way to test market understanding, execution discipline, and risk management under real market conditions. Beyond the competitive element, such events encourage traders to evaluate their
post-image
BTC-0.19%
  • 2
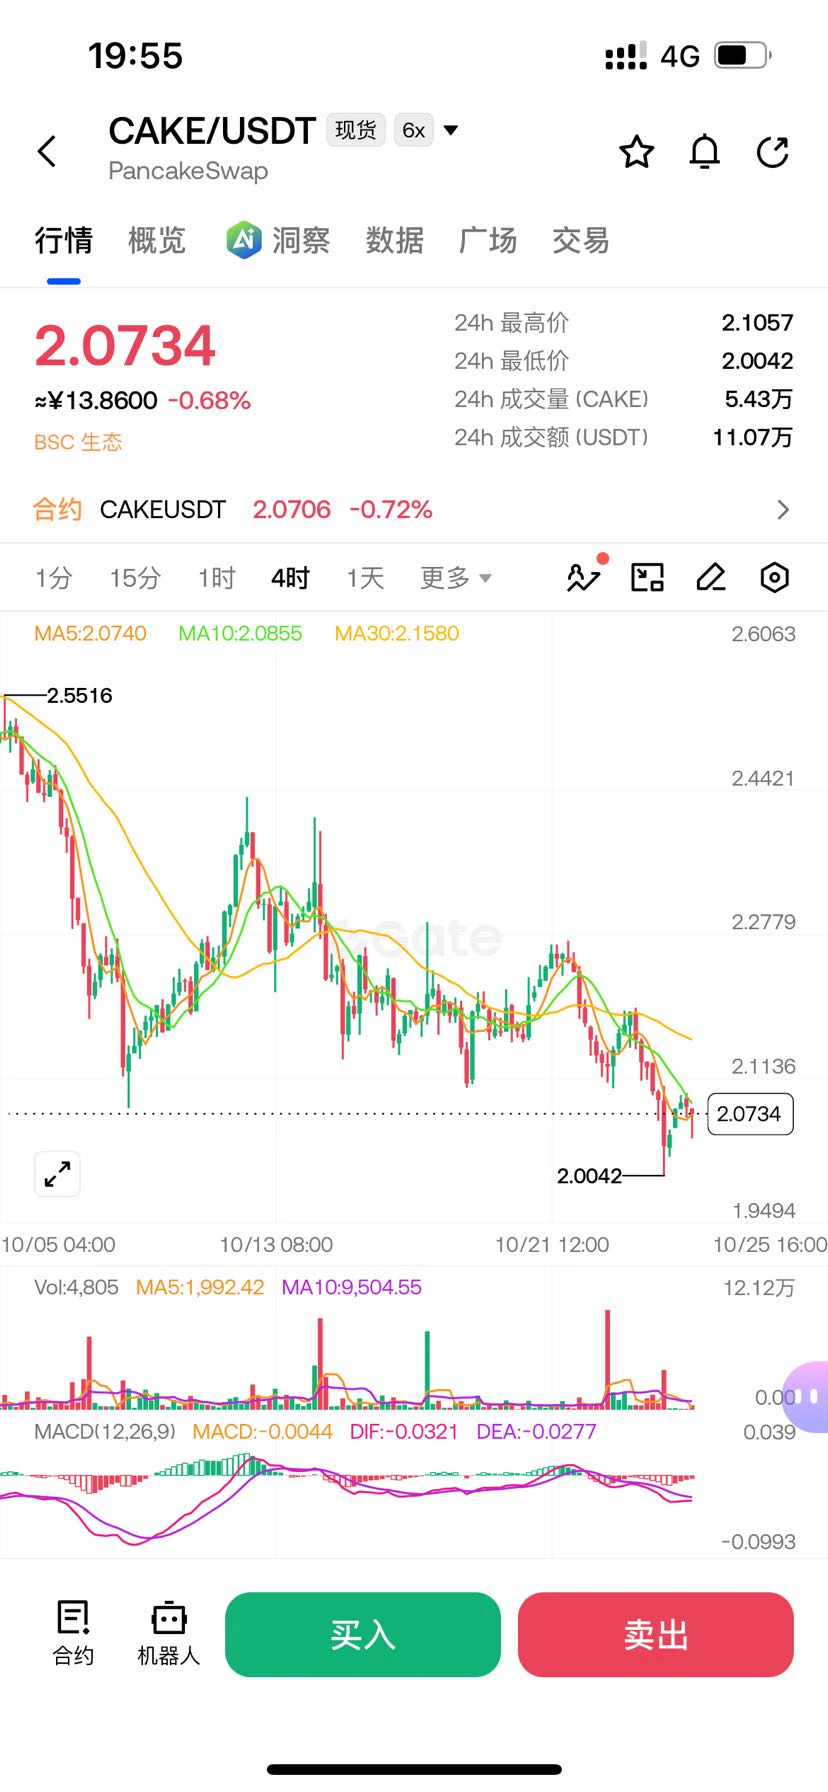
$CAKE One unusual thing stands out today: ranked by 7-day trading volume, Uniswap, PancakeSwap, Aero, Pump, and BisonFi make the top five, with business booming, yet $CAKE is stuck at 2.06, down 6.1% over 7 days and unable to climb past the halfway mark. The sector is racing ahead, but the token itself is dragging its feet, like a shareholder being carried by its own business.
And don’t overlook that it’s up 49% over 90 days and 37% over six months—these holders are smiling. The problem is that its 26-point pullback over the past 30 days wiped out all the gains made by those who chased the ra
post-image
CAKE-1.33%
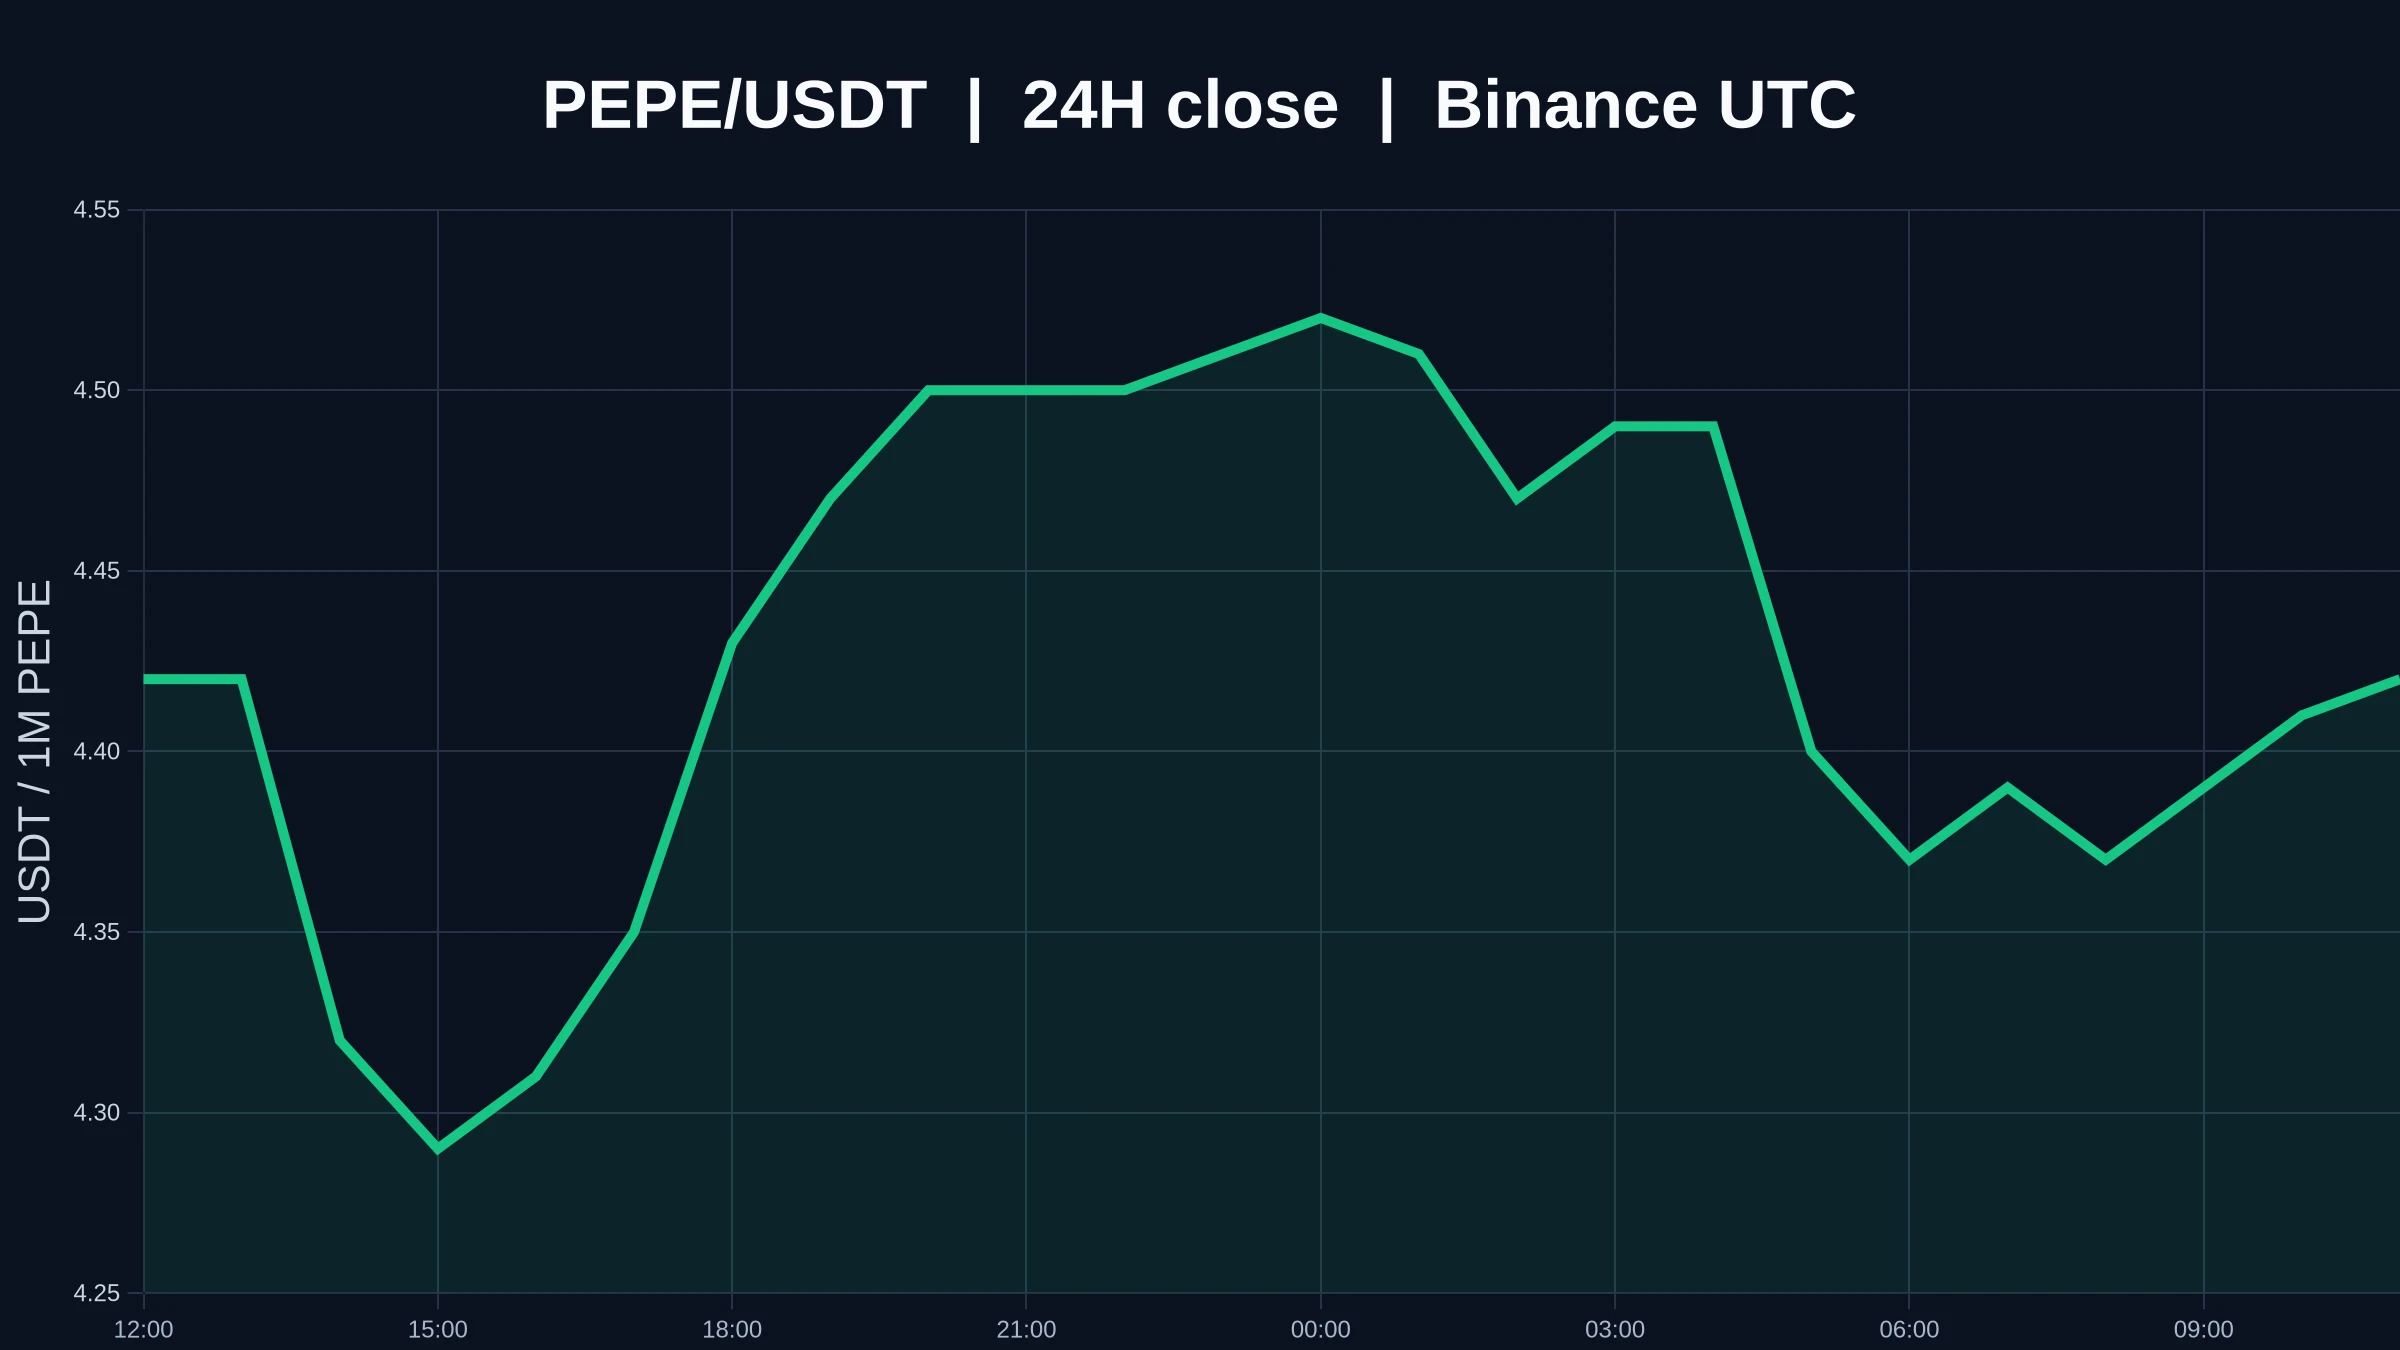
$PEPE moved on its own before volume caught up. The current price is 0.00000441 USDT, with a 24-hour high of 0.00000456 and low of 0.00000423. The 1-hour trend is weak, the 4-hour trend is weak, and trading participation is only 0.07x.
I’m more inclined to see this as a probe ahead of a directional shift, but the feedback from volume is too weak. The 24-hour change is just +0.69%, a modest move, but the sequence has already changed. Price moved first, but no one followed through, so this rhythm looks unconvincing. For now, I’m only watching the boundaries and won’t rush to a conclusion.
1-hour
post-image
PEPE+1.41%
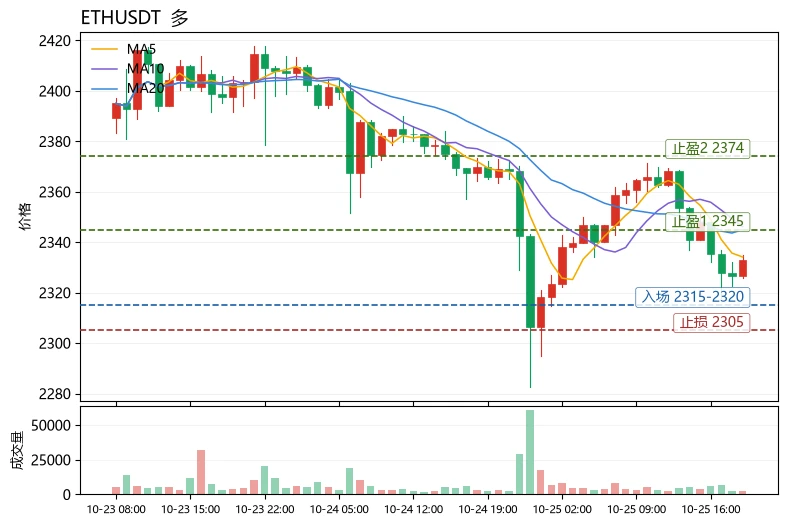
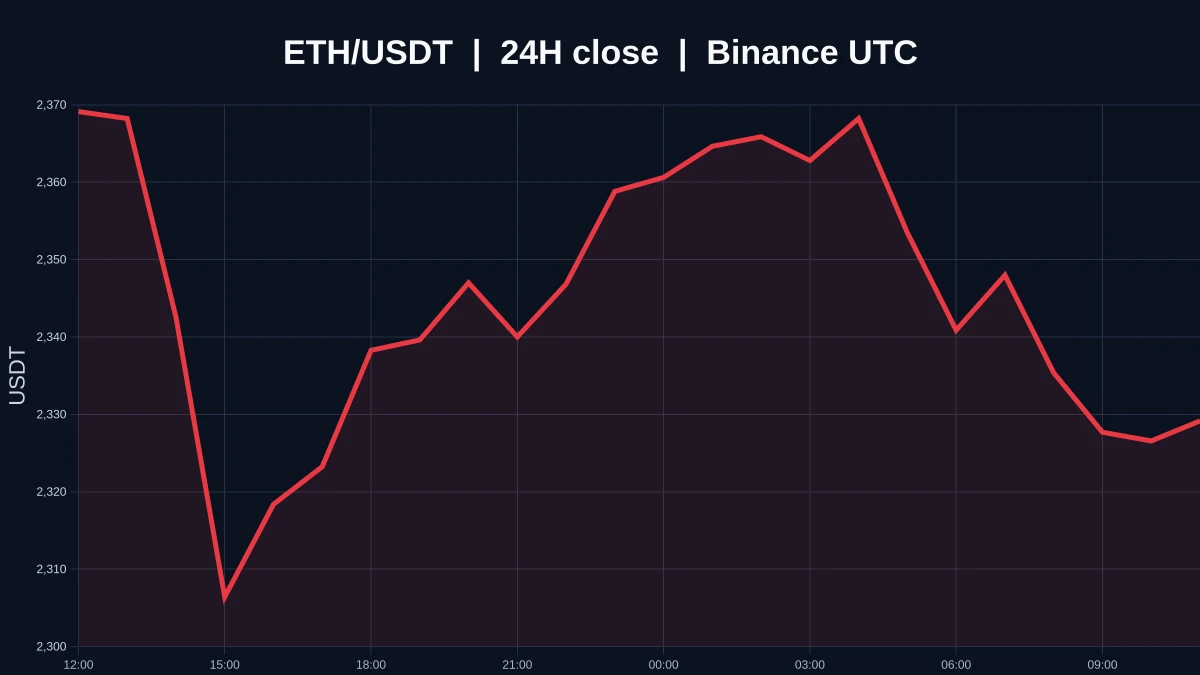
Many people treat “buying the dip” as technical analysis, but once the moving averages form a bearish alignment, a rebound is merely a recovery, not a reversal. $ETH is currently at 2333.14; MA5=2334.15 has crossed below MA20=2344.97, and the price is trading near the lower Bollinger Band at 2315.4. The MACD histogram at -1.349 remains below the zero line, while RSI at 40.7 is weak but not oversold, indicating weak consolidation rather than panic selling. The funding rate of +0.0038% shows that longs are still paying to hold positions. Combined with the neutral Fear and Greed Index reading of
post-image
ETH-1.30%
SUI-3.09%
HYPE+1.15%
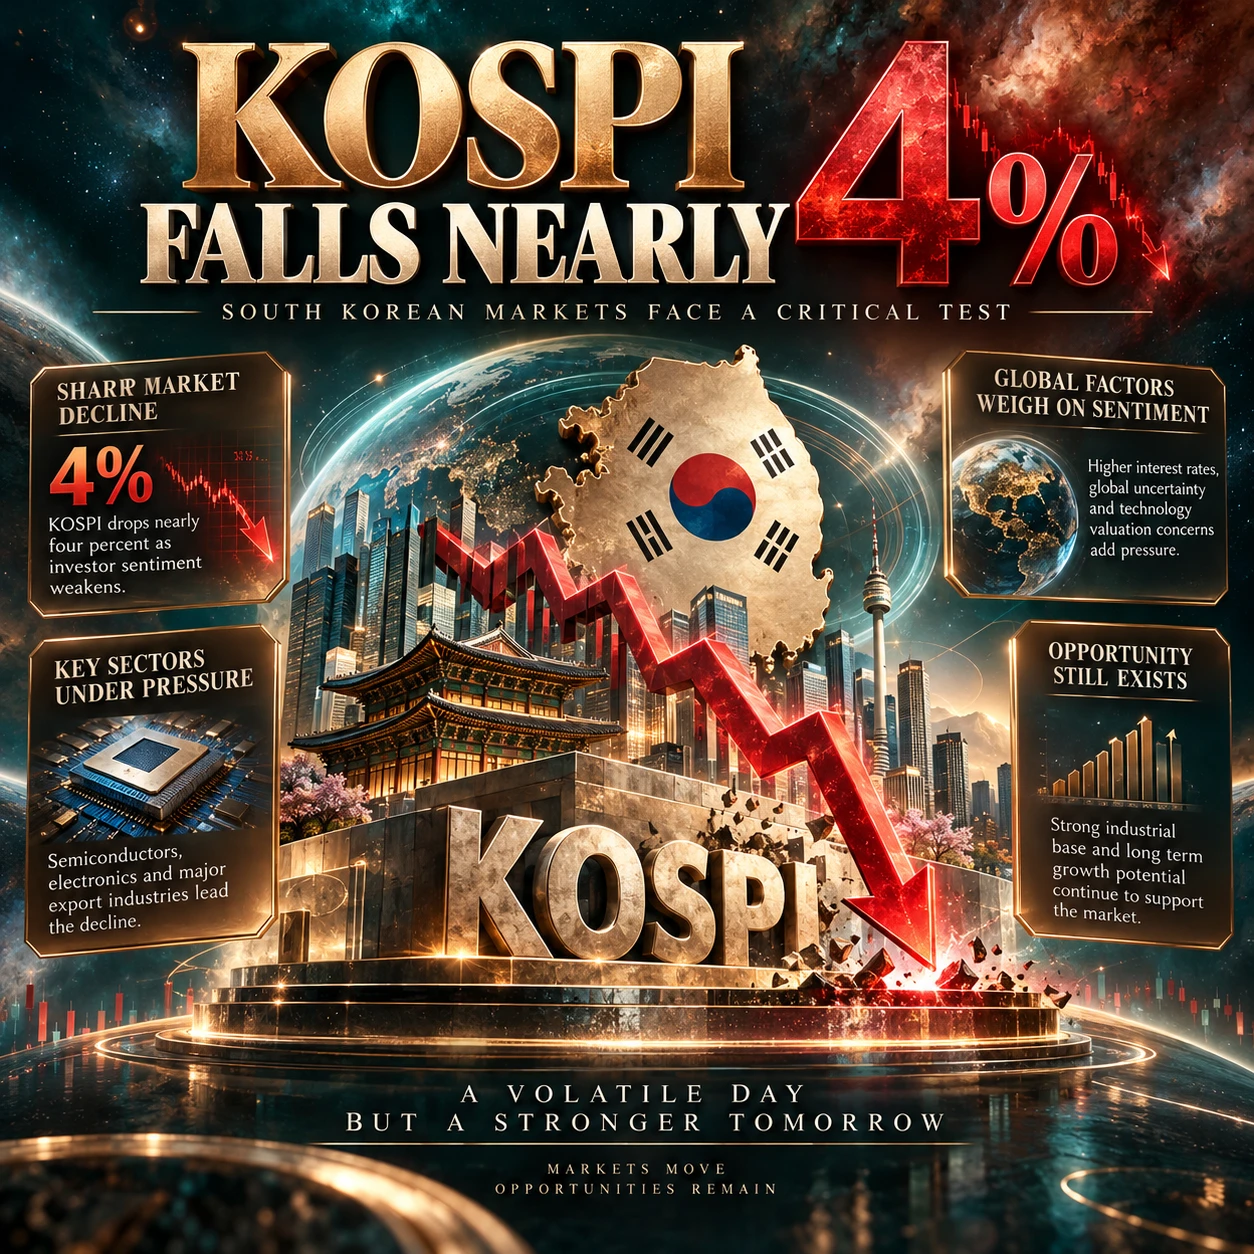
#KOSPIFallsNearly4%

KOSPI Falls Nearly Four Percent as South Korean Markets Face a Critical Test
The nearly four percent decline in South Korea’s KOSPI index highlights how quickly investor confidence can change when financial markets face uncertainty. As one of Asia’s most closely watched equity benchmarks, the KOSPI reflects the performance of major South Korean companies across semiconductors, electronics, automobiles, industrial manufacturing, and other important sectors. A sharp daily decline can influence regional sentiment, portfolio valuations, and expectations for international tra
post-image
SKHY+1.23%
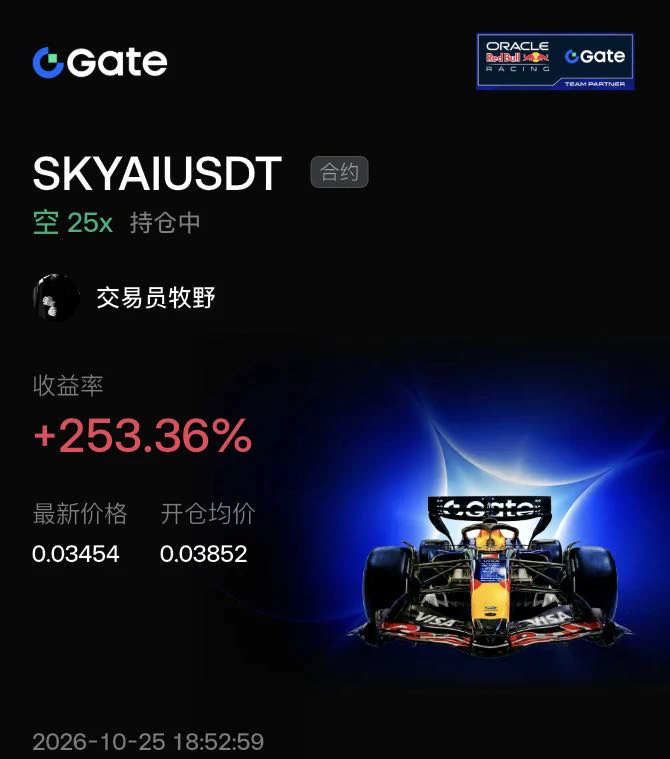
This trade paid off—tonight I can finally order pork belly at the barbecue. I’d been watching $SKYAI for days. Rebound volume had dried up completely, so I set a 25x short at 0.03852 ahead of time.
Risk capped; let the market do its thing. When I checked this afternoon, the price was 0.03454, with unrealized gains of +253.36%. The price action under pressure at the lows gave us the answer. The wait paid off—the tokens that couldn’t find support at the highs finally broke down.
Don’t let profits go to your head, and don’t despair over drawdowns. Profits are the payoff for what you know; losses
post-image
SKYAI+13.10%
BTC-0.18%
ETH-1.31%
Why can adding more technical indicators actually make trading decisions more complicated?
When many traders first start studying technical analysis, they go through a phase:
Moving averages aren't enough, so they add RSI; RSI isn't enough, so they add MACD; worried about misjudging the trend, they add Bollinger Bands, volume, and other indicators.
The chart gets more crowded, and the analysis looks more professional, but have trading results really improved as a result?
Not necessarily.
Adding indicators increases the amount of information, but not necessarily the quality of decisions.
I. Why
post-image
  • 1
evening update
live-cover
LIVE1,933
I'm trading on Gate, a top-tier exchange with a 13-year track record. Come join me and dive into the hottest events right now! https://www.gate.com/campaigns/6729?ref_type=132
  • 3
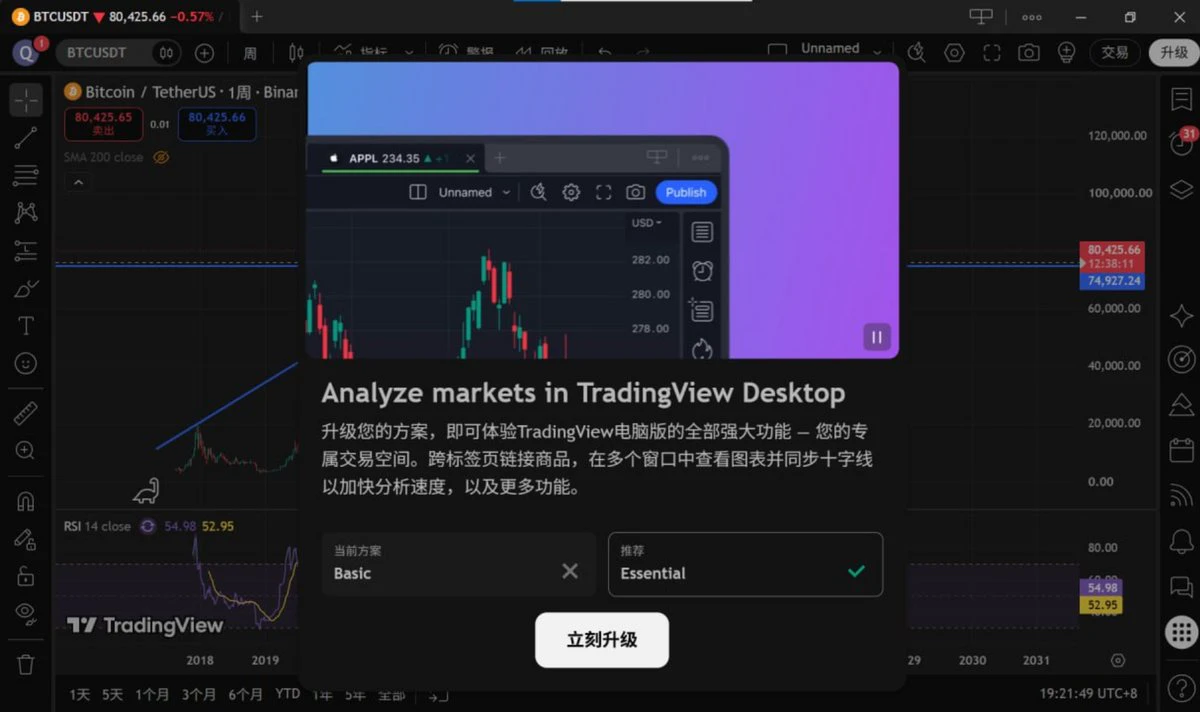
TradingView, what a shameless money grab! HK$100 a month? Are you kidding? The worst part is that you can't even close the pop-up. It's just like malware. I might consider it if it were cheaper.
This kind of forced, extortionate payment scheme just makes people want to uninstall it!
Have you run into this kind of payment pop-up while using this software? How do you close it?
#TradingView
post-image
Bitcoin Faces a Critical Week: $82K Is the Level to Watch
BTC has shown resilience despite pressure across global markets, but the bullish case still needs confirmation.
The key battle is around $82,000 and the weekly 50MA. A confirmed weekly close above this zone could strengthen bullish momentum. Failure to reclaim it keeps the market vulnerable to another downside move.
3 Macro Catalysts That Could Move Crypto
📌 Oct 28 — FOMC Decision
The Fed's decision and forward guidance could trigger sharp moves across risk assets.
📌 Oct 29 — US PCE Inflation & GDP
Cooling inflation alongside solid gr
BTC-0.19%
Invite Friends to Trade and Win XAUT Airdrops with Every Draw https://www.gate.com/campaigns/6716?ref=VLARBF1YAG&ref_type=132&utm_cmp=gUEy9rJe
post-image
XAUT-0.10%
  • 4
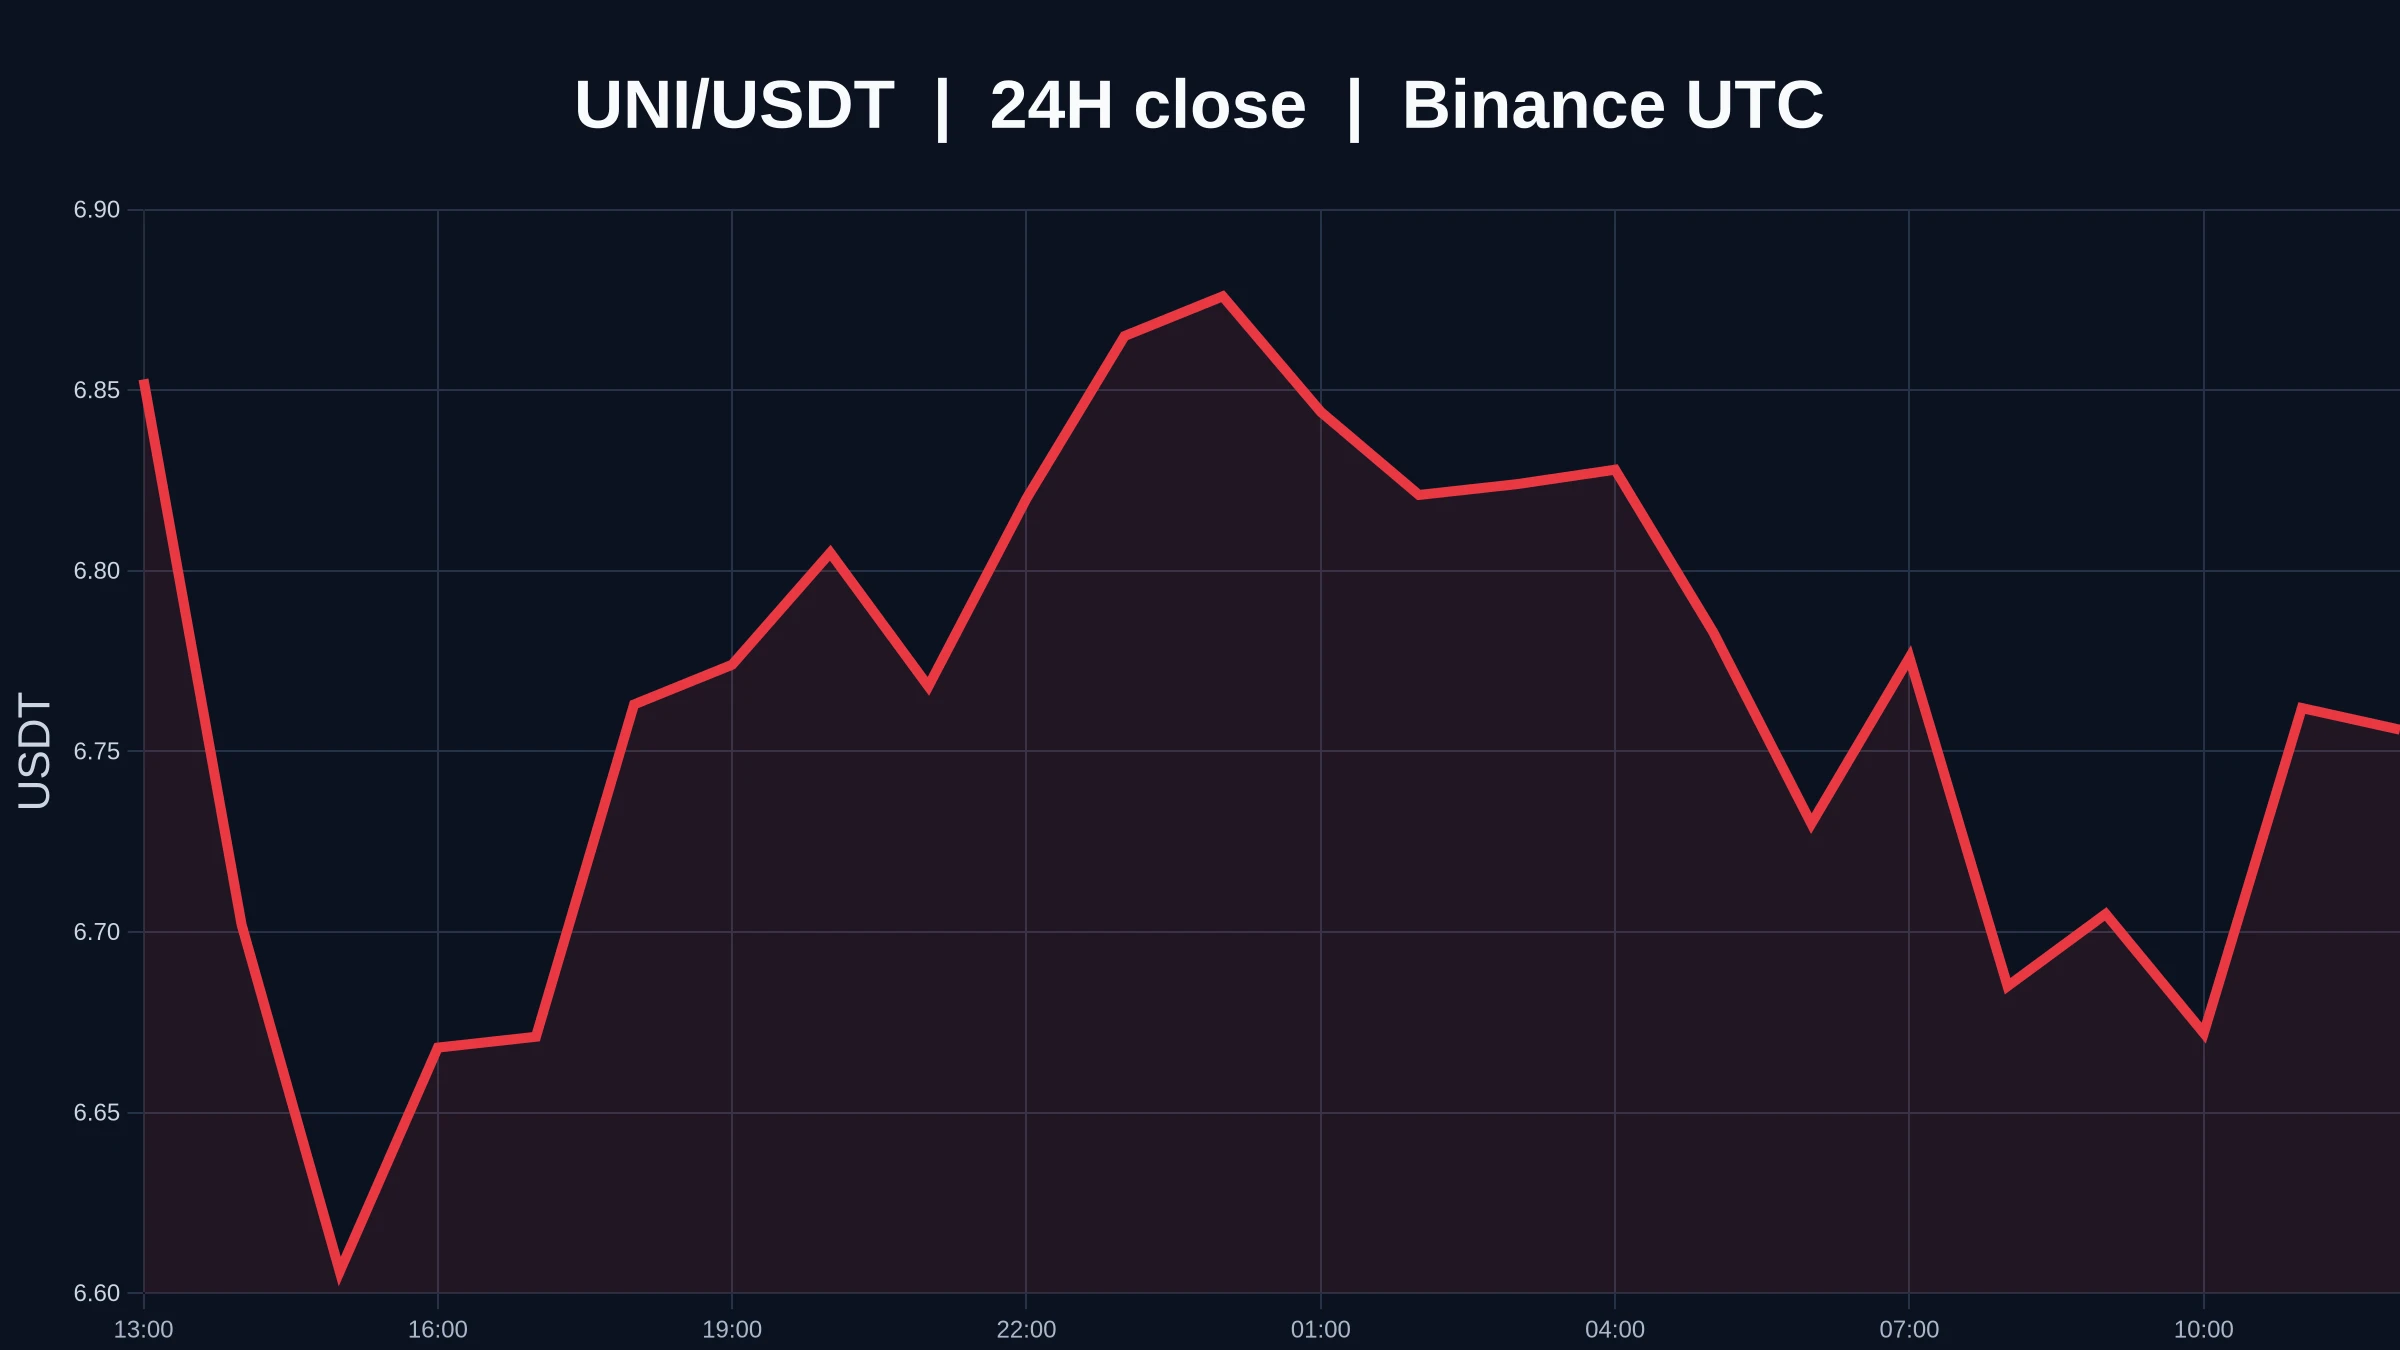
Oversold does not mean a bottom is in. $UNI is currently at 6.754 USDT, with a 24-hour low of 6.516. The 1-hour support and resistance levels are 6.516 and 6.899, respectively. Both the 1-hour and 4-hour trends are weak, and trading participation is only 0.01x. Will you treat oversold conditions as a rebound signal, or wait for the price to stop making new lows?
My view is to treat conditions as weak for now and not assume oversold means a bottom is in. The decline only shows that selling pressure has emerged; it does not prove anyone is defending 6.516 or that the structure has stopped weaken
post-image
UNI-1.10%
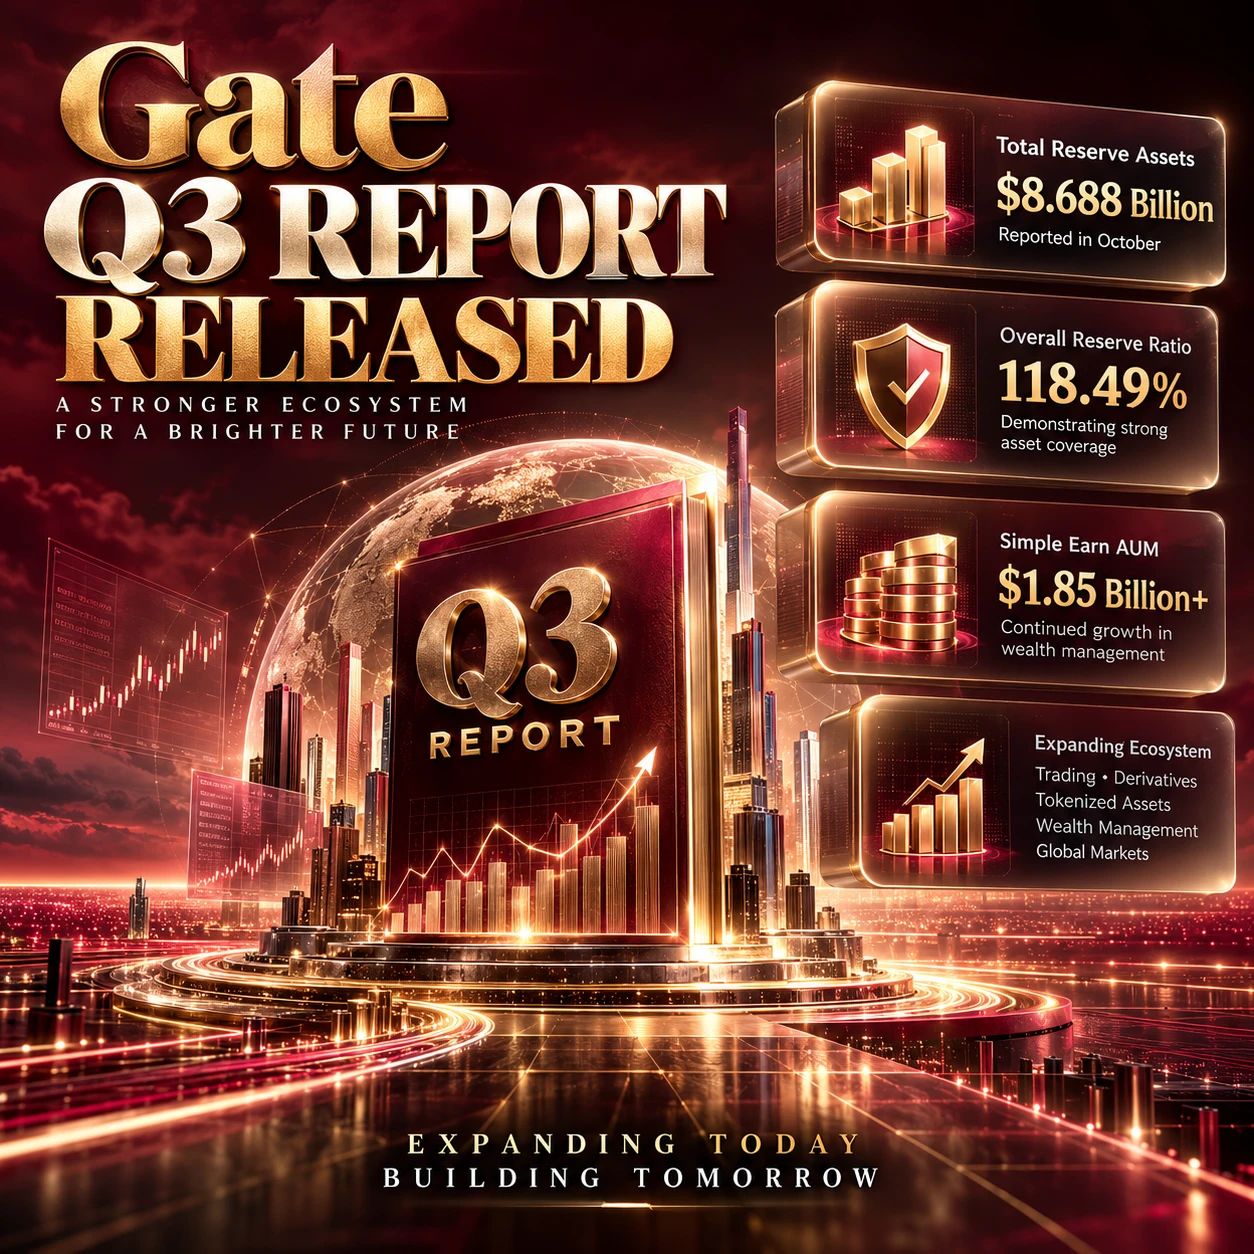
#GateQ3ReportReleased

Gate Q3 Report Released Signals a New Phase for Ecosystem Growth and Market Confidence
The release of Gate’s third quarter report offers an important opportunity to evaluate the platform’s progress, business priorities, and broader ecosystem development. Quarterly reports provide more than a snapshot of activity because they help users understand how an exchange is evolving in response to changing market conditions, competitive pressure, and growing demand for digital asset services. For traders and investors, the significance lies in examining the relationship between
post-image
GT-0.60%
$ETH is currently trading at 2329.39, down 1.72% over 24H (range: 2282.46–2373.18). The 1H trend is weak, with RSI at 44; price has fallen below the EMA20 at 2346.8. The 4H trend is weak, with RSI at 30, and the EMA20 at 2375.9 is acting as resistance. To move higher, price needs to hold above the 2373.18 resistance; to the downside, watch for a break below the 2282.46 support. Volume is only 0.15x the average, so any single breakout needs volume confirmation. In the next review, check whether price can hold above 2373.18 and whether it can reclaim 2282.46 after a breakdown. Market volatility
post-image
ETH-1.30%
Seeing this is quite shocking
Dongxing dinner gathering changes, 9 years later:
----------------
Zhang Yiming 19x
Su Hua 10x
Lei Jun 3.5x
Wang Xing 3x
Shen Nanpeng 2.3x
Ma Huateng 2x
Yang Yuanqing 1.7x
Zhang Lei 50%
----------------
Cheng Wei down 30%
Liu Qiangdong down 30%
Liu Qiangdong down 25%
Yao Jinbo down 20%
post-image
Load More

Join 40 M users in our growing community

⚡️ Join 40 M users in the crypto craze discussion

💬 Engage with your favorite top creators

👍 See what interests you

Trending Topics

USEarningsSeason

90.06k Views3.46k Discussing

The U.S. Q3 earnings season is in full swing, with major tech companies including Tesla and Meta reporting results. Market focus is shifting beyond revenue and profit toward AI spending, capital expenditure, margins and forward guidance. Which company’s earnings are you watching most closely?

GateWCTCS9GlobalTradingCompetition

696.13k Views8.03k Discussing

USConsumerSentimentNearRecordLow

10.06k Views273 Discussing

View More