


Square
Following
Hot
News
Profile
Share your thoughts
placeholder
Article
$RLC ’s direction looks consistent, but the volume contraction has yet to confirm it
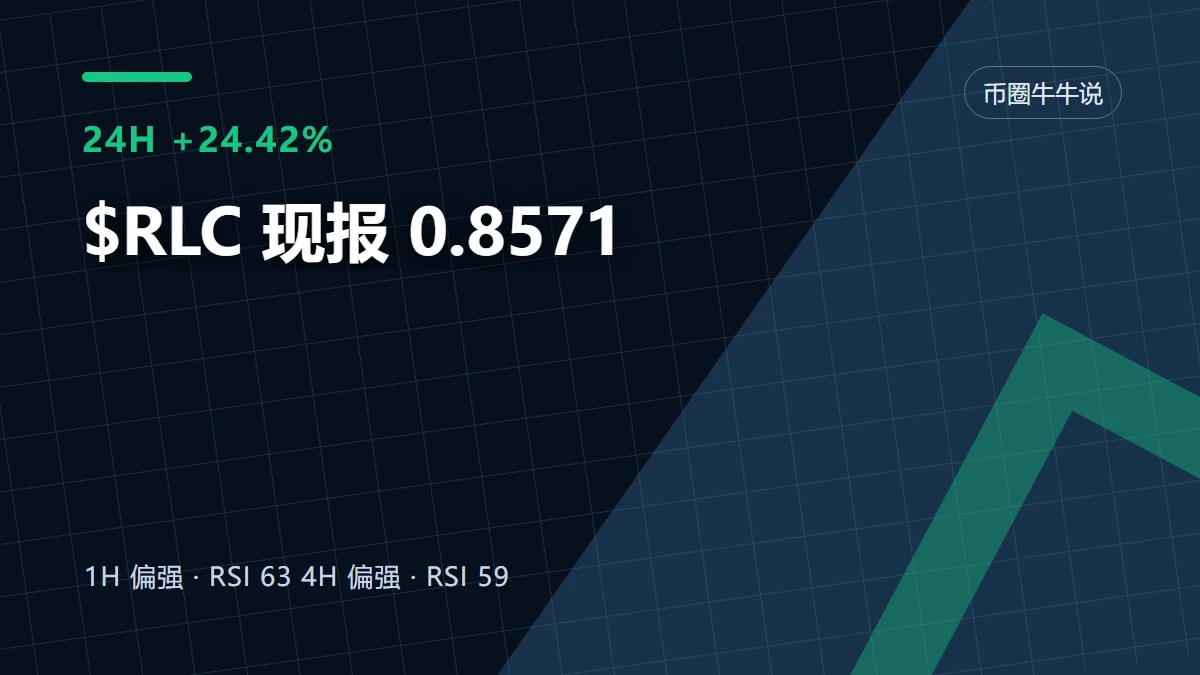
$RLC 24-hour +24.42%, current price 0.8571. The 1-hour and 4-hour structures are both relatively strong, but current volume is only 0.07 times the average volume of the previous 20 candles. The direction is consistent, but participation has not kept up—that is the point most worth debating right now.
Let’s pull the camera back to the 24-hour range: low 0.6515, high 1.0845. Where does the current price of 0.8571 sit within this range? That directly affects the meaning of the same signal. Near the high, strength
post-image
RLC+36.29%
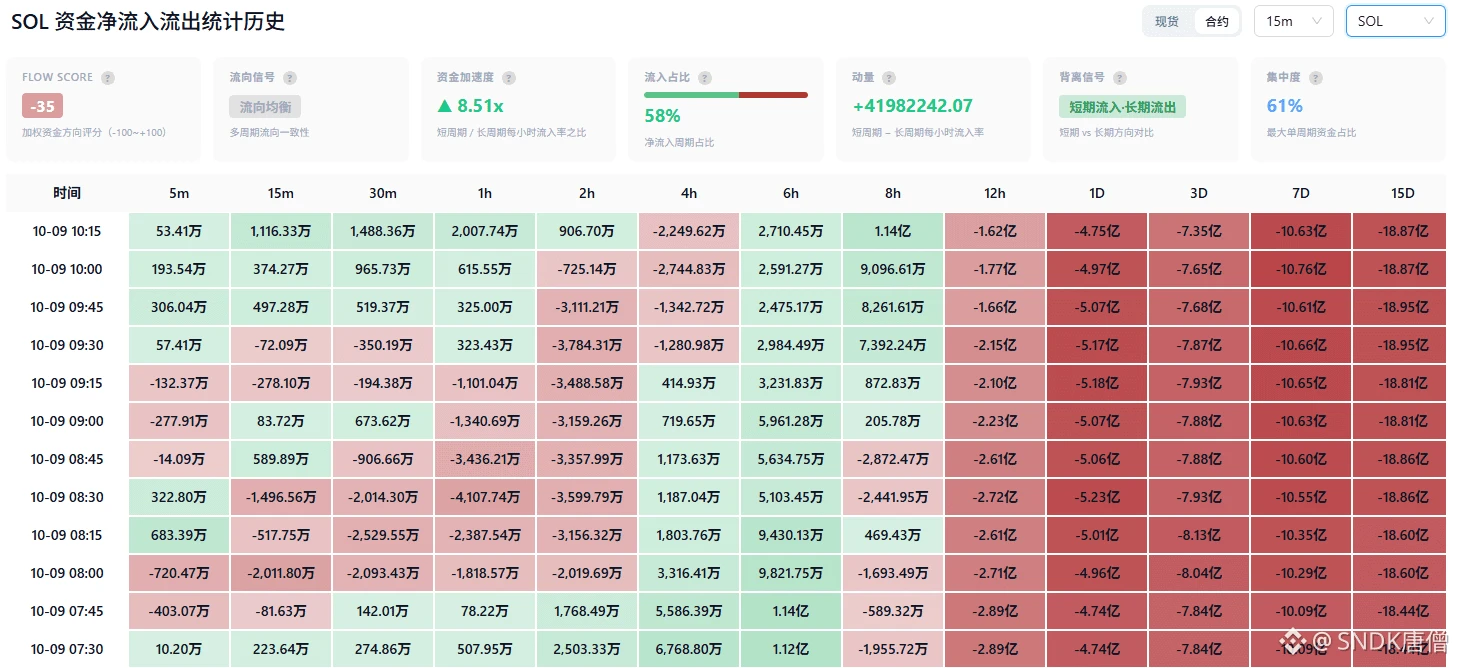
18% plunge followed by short-cycle funds bucking the trend to buy the dip! A pullback of $SOL to 109 could trigger short liquidations
Direction: Long (oversold rebound)
Entry range: 109.0–110.0
Take-profit target: 113.0–116.0
Personal view: SOL plunged from 123.77 to 105.61, down more than 14%. Short-cycle funds flowed back against the trend—1h inflows exceeded $20.07 million, while 8h inflows exceeded $114 million, clearly showing dip-buying funds entering the market; short liquidations are concentrated around 112–116, and once the oversold rebound is triggered, it could easily spark a short
post-image
SOL-5.12%
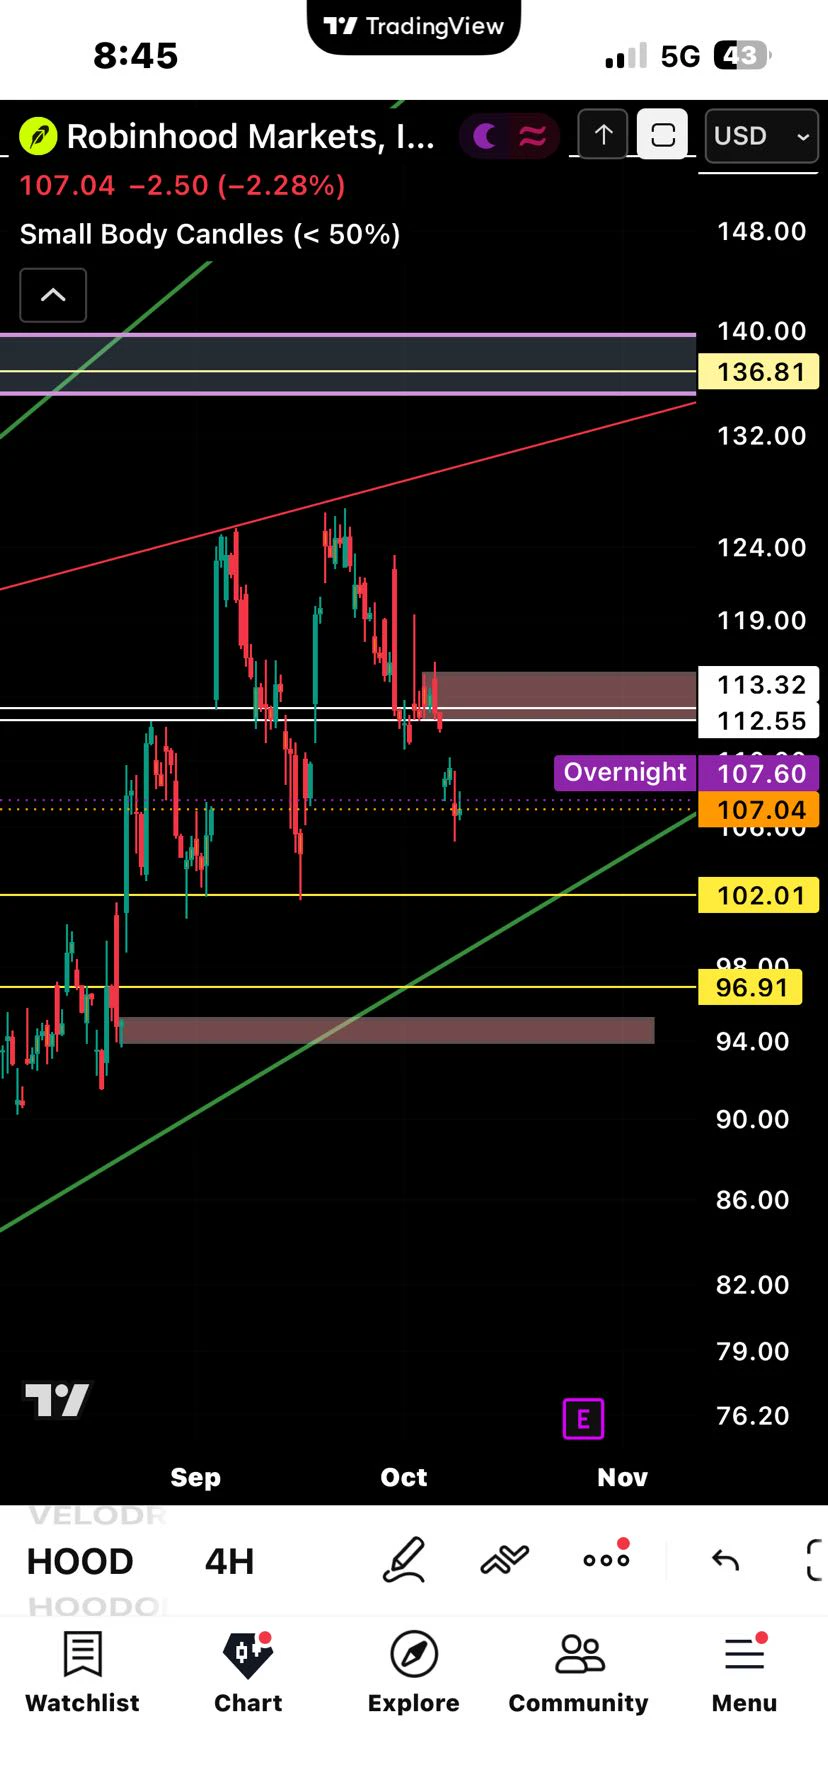
$HOOD Based on the 4-hour (4H) technical chart for Robinhood (HOOD) shown in the image, here are the key support levels where the stock has the potential to bounce:
1. Nearest Support Level (102.01)
Price Level: 102.01 
Analysis: Indicated by the yellow horizontal line, this level represents a previous swing low. With the current price around 107.04, 102.01 serves as the first line of defense if the current pullback continues. 
2. Major Ascending Trendline Support (Green Line)
Price Level: Approximately 100.00 – 102.00 
Analysis: The green upward trendline intersecting near the 102.01 s
post-image
HOOD-2.29%
#GateMoneyOfficiallyLaunches
Gate Money: One Gate, Everything Money — Bringing Crypto Closer to Everyday Life
Crypto becomes more useful when people can do more than buy, sell, and hold it. The real breakthrough comes when digital assets connect with the financial activities people already understand: receiving money, transferring funds, managing savings, exchanging currencies, and paying for everyday needs. Gate Money’s official launch is an important step in that direction, bringing a broader financial experience into the Gate ecosystem.
What makes this development exciting is the thinking
  • 5
  • 2
ETH Watch from a Jerk
The jerk hasn't mentioned Ethereum in a long time.
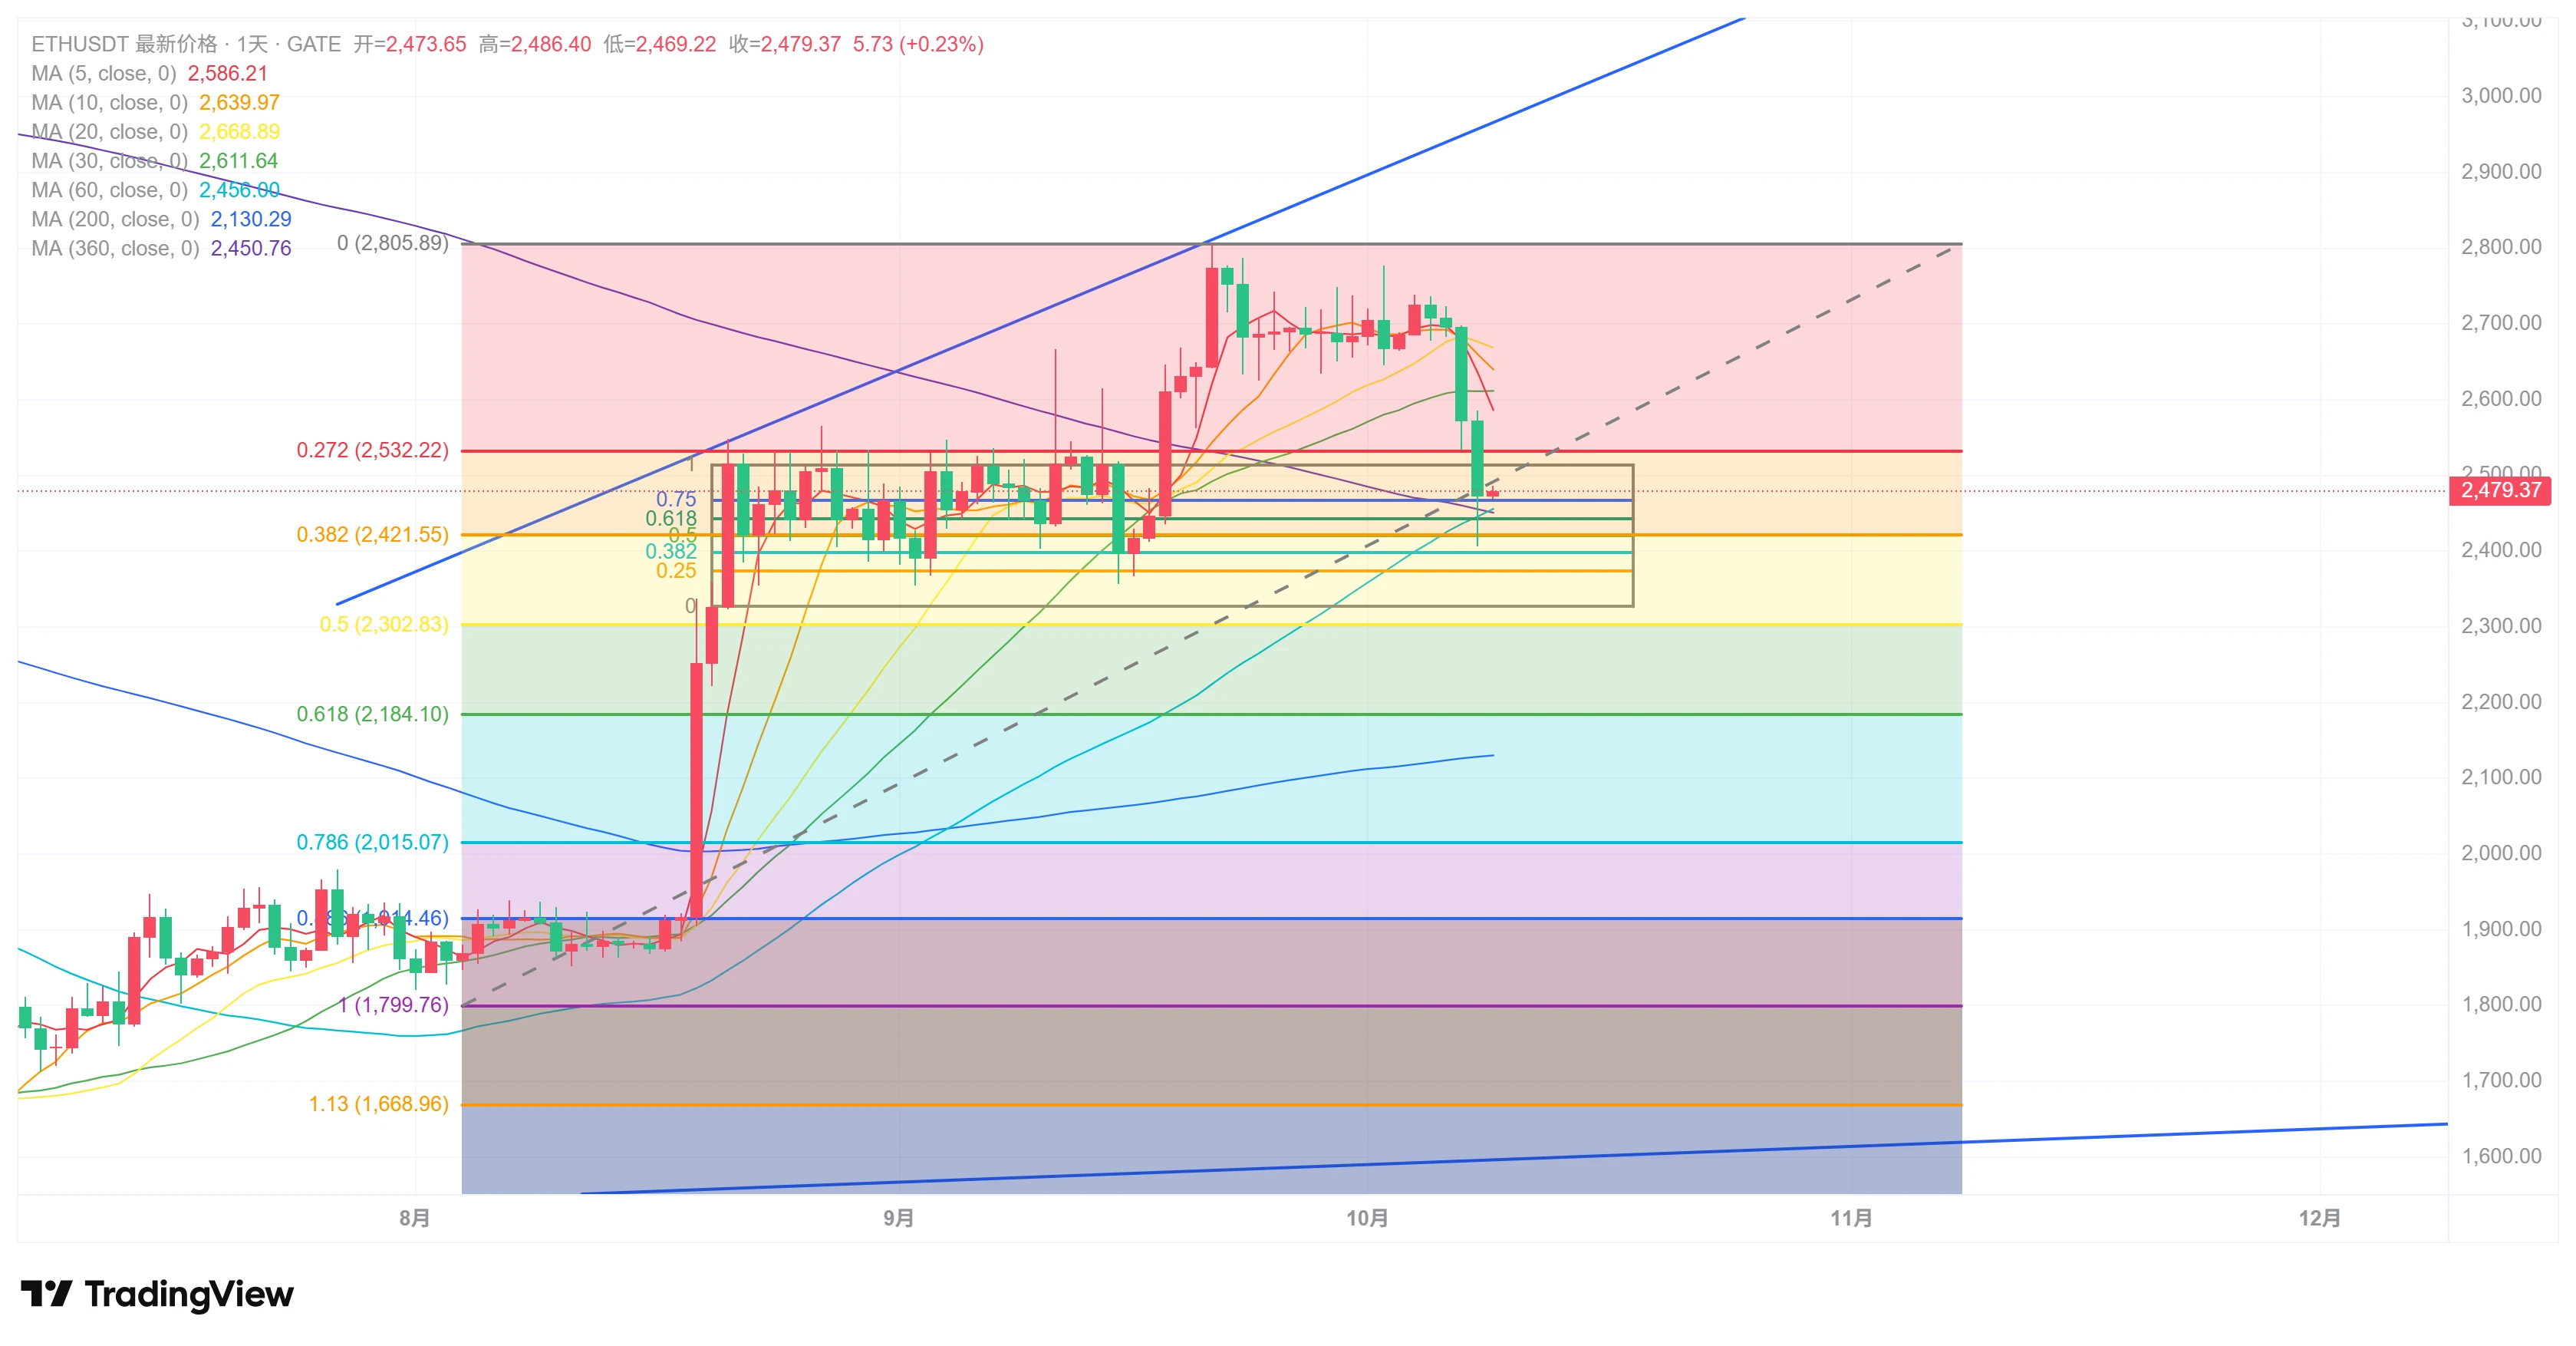
Cryptocurrencies fell again today. Let's see what the jerk's next move should be. As we can see in the chart, yesterday's decline has pushed ETH's price back into the range of the large bullish candle created on 8.21. In the short term, we should look for rebounds near several midlines. Of course, we also need to be mindful of the possibility of a market breakdown and a direct plunge, in which case the price could crash to around 1900.
In the short term, let's look at rebound levels such as 2370 $ETH
post-image
ETH-3.22%
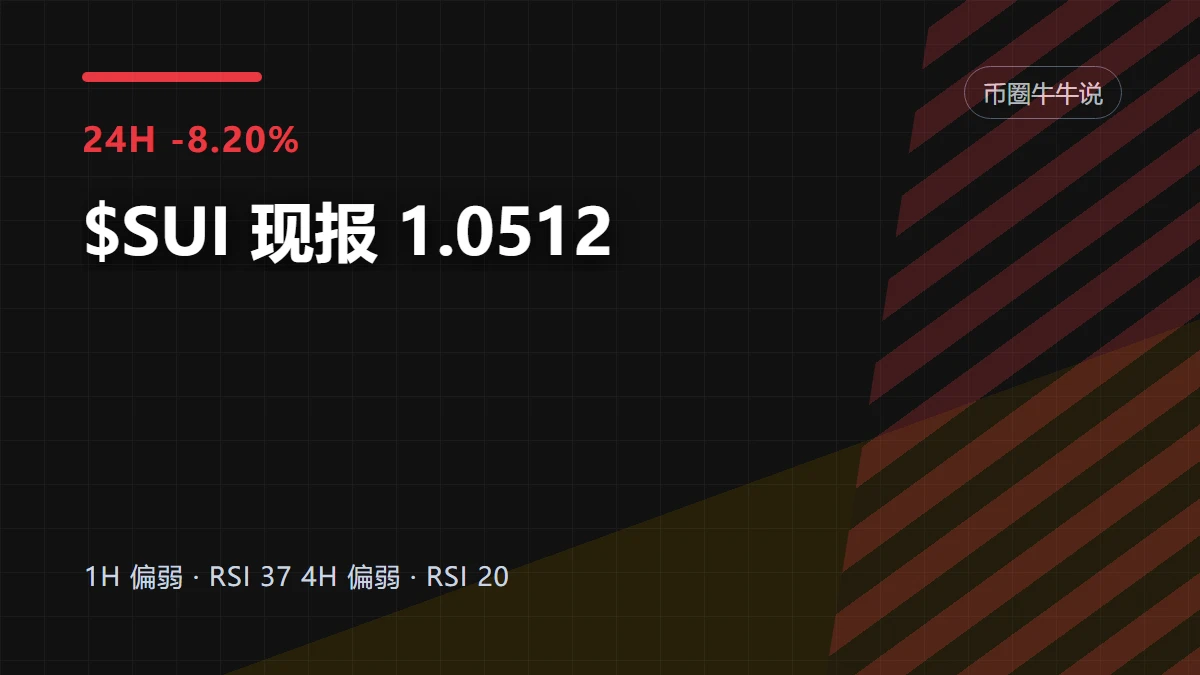
$SUI has fallen to current levels, and the easiest illusion to fall into is: if it has dropped a lot, it must already be cheap.
This time, instead of looking at the gainers and losers list, let’s focus only on the levels. The current price is 1.0512, about 5.06% above the 1-hour support at 0.998 and about 9.02% below the resistance at 1.146.
My criteria are simple: only a breakout above 1.146 followed by continuation would count as an upside handoff; a break below 0.998 invalidates the previous view. The 1-hour and 4-hour trends are both weak, with RSI at 37 and 20, respectively.
The issue no
post-image
SUI-7.58%
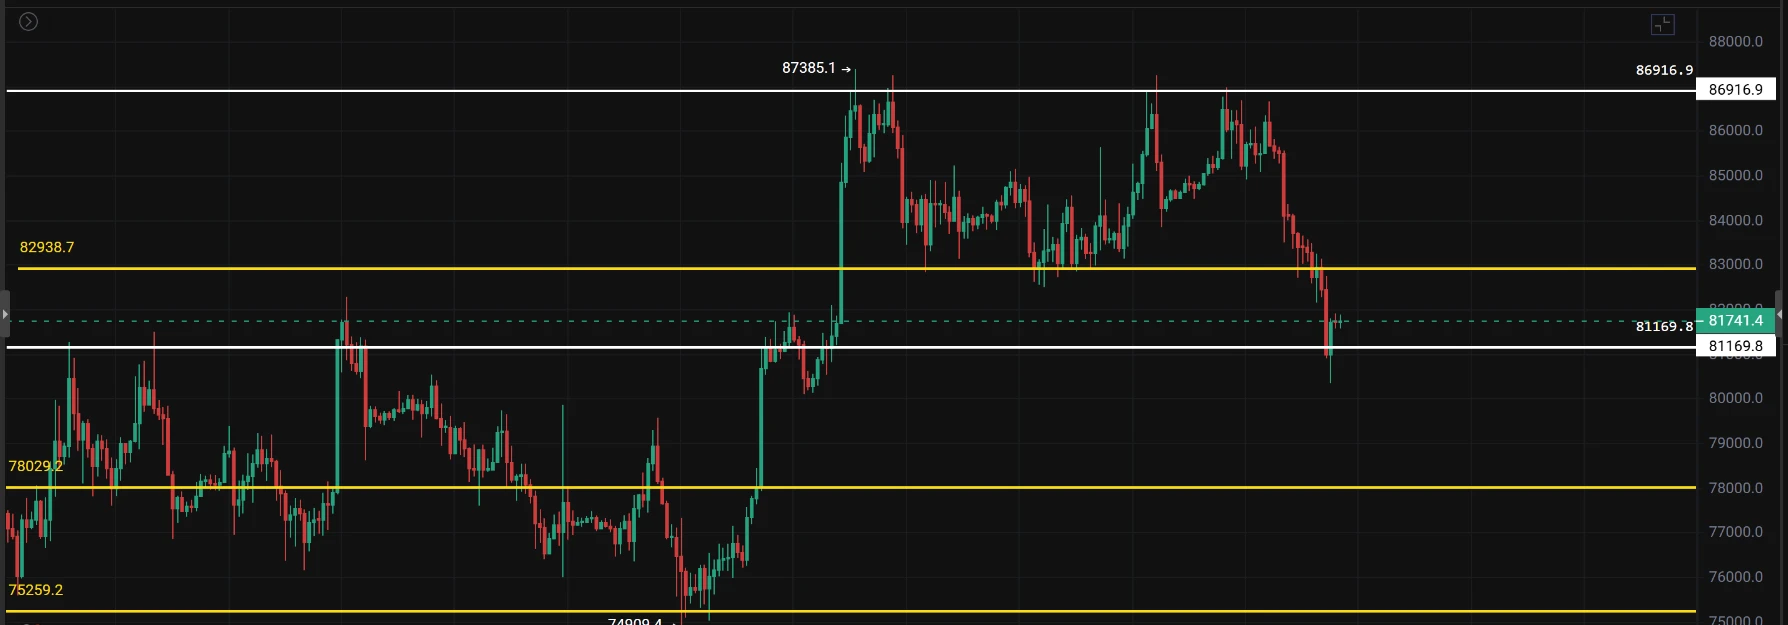
Those who bought the dip around 80,000 yesterday are probably feeling a bit of pain today—the person on my list hasn’t rushed to act, waiting for 81,900 to speak for itself.
The captain put it plainly: this level was the floor yesterday, but turned into the ceiling today—the 81,900 zone from last night was tested again this morning.
This is exactly what I look for when choosing people: he dares to lay out the levels—82,000 above and 80,000 below, clearly marking both ends for you.
Do you think he’ll test 82,000 first, or return to 80,000 first? Say it in the comments, and we’ll compare notes t
post-image
BTC-1.00%
The early-session outlook is out. Like, follow, and comment for continued strategy updates!!
The small flame 🔥 marks key support and resistance levels; it may not be reached in the short term, but offers the best risk-reward ratio
Regular trades without the small flame 🔥: consider entering intraday; even with small intraday fluctuations, you can enter and trade
Remember not to place orders at all levels, to avoid being repeatedly stopped out during shakeouts. Manage your position size well!!!!
Live stream at 20:30 tonight—see you there!!!!!!
[New Streamer] Market Prediction
live-cover
LIVE40
The morning's DuoDan strategy arrived at its destination as scheduled, $BTC gained 700 points, and $ETH gained 30 points.
Original content no longer visible
BTC-1.00%
ETH-3.22%
  • 1
Robinhood adds $25 million worth of Bitcoin to its balance sheet
live-cover
LIVE1,805
October 9 $BTC Overall Market Analysis
💫 Market News:
The 10-year U.S. Treasury yield is around 5.3%, with real interest rates relatively high, unfavorable for assets with no cash flow
Brent crude rose to around $105.60 per barrel, up about 5.4% in a single day, amid tanker attacks and shipping disruptions in the Strait of Hormuz. Inflation expectations have been reignited, and the market has once again priced in the “rate hike” trade
BTC liquidations over the past 24 hours totaled approximately $167 million, with longs accounting for about 94%
💫 Fund Flows:
Bitcoin ETFs saw net outflows of
post-image
GT-0.82%
BTC-0.96%
🔴 I’m LIVE on Gate! Robinhood Adds $25 Million Worth of Bitcoin to Its Balance Sheet
🎙️ Today's Topic: Robinhood adds $25 million worth of Bitcoin to its balance sheet.
🔗 Join My Livestream Now:
https://gate.com/post?post_id=24836651&tim=g1KC2kfIAUgeMQI7Hr&ref=VFBHUV8LVQ&ref_type=105
📊 What Are We Discussing?
Robinhood’s reported Bitcoin addition raises interesting questions about how financial companies view BTC as a treasury asset and its role in the broader crypto industry.
🔹 Why might companies hold Bitcoin on their balance sheets?
🔹 What does this mean for institutional interest in
post-image
HOOD-2.29%
BTC-0.96%
  • 7
🎉 Up to 100 USDT per week! Gate Square’s “Weekly Share” is in full swing!
📌 How to participate
① Sign up for the event 👉 https://www.gate.com/campaigns/6244
② Include #每周来晒 and #美联储9月纪要偏鹰 when sharing your market insights
💬 This week’s hot topic
The September meeting minutes sent a hawkish signal, and a rate hike later this year has not been ruled out. However, market pricing for an October rate hike has fallen below 20%, while the CPI release on October 14 may become the next key variable. Do you think there will be another rate hike in October?
💡 This week’s discussion
1️⃣ If CPI exce
GateSquare
🎉 Up to 100 USDT per week! Gate Square’s “Weekly Share” is in full swing!
📌 How to participate
① Sign up for the event 👉 https://www.gate.com/campaigns/6244
② Include #每周来晒 and #美联储9月纪要偏鹰 when sharing your market insights
💬 This week’s hot topic
The September meeting minutes sent a hawkish signal, and a rate hike later this year has not been ruled out. However, market pricing for an October rate hike has fallen below 20%, while the CPI release on October 14 may become the next key variable. Do you think there will be another rate hike in October?
💡 This week’s discussion
1️⃣ If CPI exceeds expectations, how will expectations for an October rate hike change?
2️⃣ How will Federal Reserve policy expectations affect crypto and U.S. stocks?
3️⃣ Have current market expectations already been fully reflected in asset prices?
Share now, earn points, climb the leaderboard, and win rewards: https://www.gate.com/post

repost-content-media
  • 2
Hit Targets to Earn USDT, Win 200 NVDA Shares in Three Reward Pools https://www.gate.com/campaigns/6394?ref=VLARBF1YAG&ref_type=132&utm_cmp=tC1WEtA2
post-image
NVDA-2.86%
BTC October 9 Market Analysis
1. The rise of wave 1 has most likely ended, and a wave 2 correction may come next. The larger bull-market cycle is not over, but major pullbacks can also occur within a bull market—even a correction to 72,000-75,000 is possible;
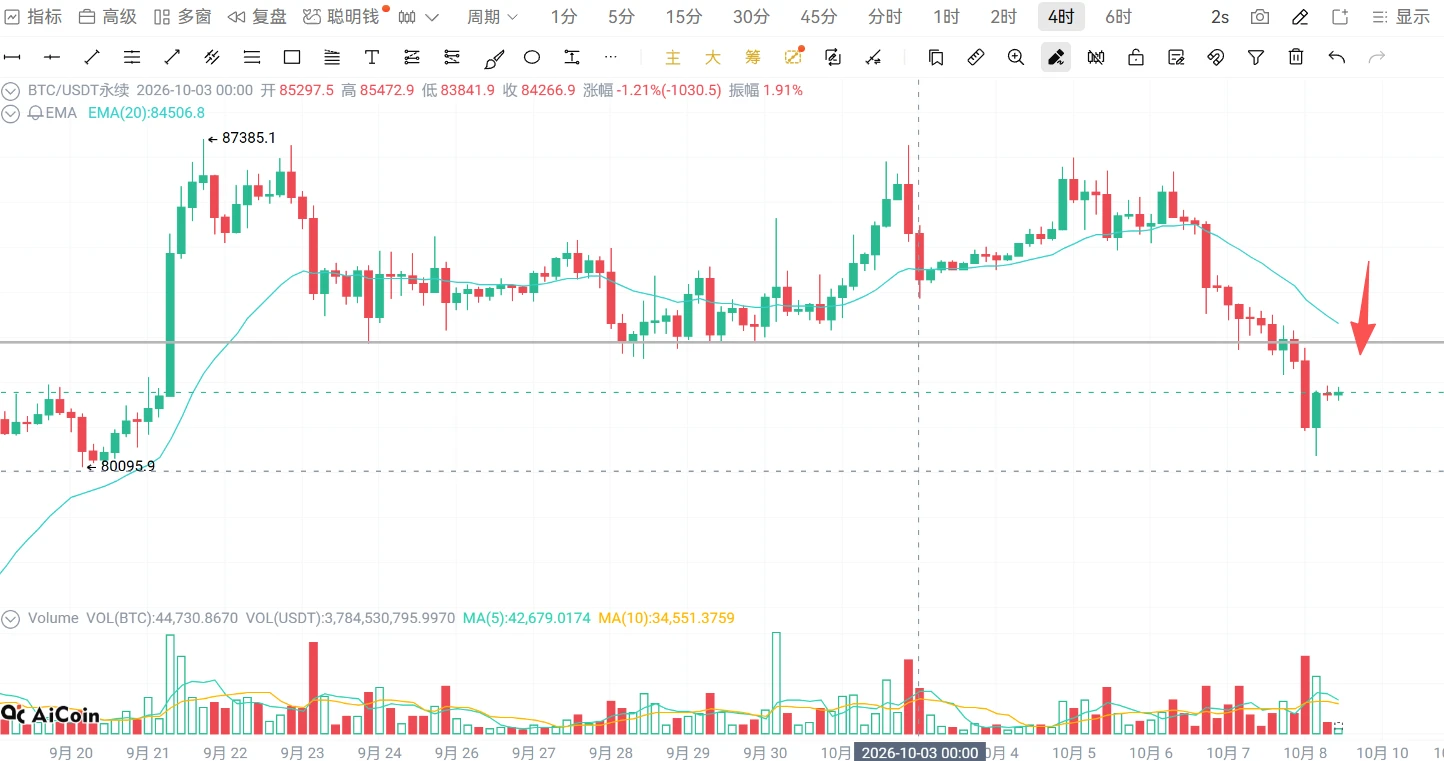
2. BTC in the 70,000s may have a chance to be seen again. In any case, it is now clear that key support has been breached. Consolidation is needed in the short term, and the probability of a direct V-shaped reversal is low. Personally, I believe the decline is not over yet, so do not go long for now; continue to focus on short positions d
post-image
BTC-0.96%
An in-depth analysis of BTC’s short-term trend from Dow Theory, Chan Theory, Elliott Wave Theory, volume-price relationships, order flow, and price action
C-wave progress verification: Yesterday’s projected C-wave targets have been met one by one—the October 8 sell-off was hit by 32.2 billion in volume + Delta of -5.08 billion (a cumulative -11 billion over two days, meaning 75% of the +14.6 billion buying on September 21 has been given back), with a low of 80,316 (precisely touching the 80,167 triangle measurement target zone). The current rebound to 81,669 is capped below the broken central
BTC-0.96%
One benefit of being on the conference circuit is being able to stay in close contact with the old OGs when the market becomes highly volatile and ease the stress😆
Yesterday, I happened to be having dinner with Brother Sun when the crash hit. My phone kept lighting up with alerts, but fortunately all the strategies had already been set, so I knew which orders had been triggered without even checking.
I also chatted with a few old friends. Everyone was quite calm—eating and drinking as usual.
Recently, there have been quite a few objective negative factors affecting the market: the bill failed
post-image
BTC-0.96%
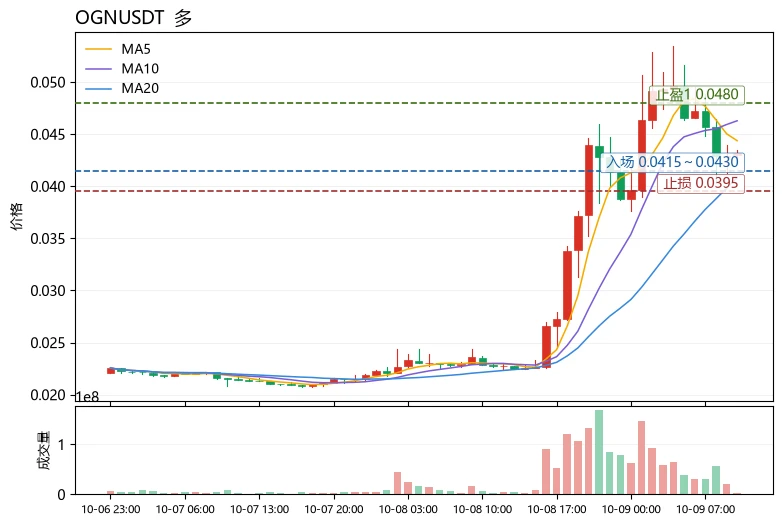
Fear & Greed Index: 59, in the greed zone. BTC’s recent stabilization has driven rotational gains in the altcoin sector. $OGN surged 84.19% in 24 hours, with the current price at 0.04321 and trading volume reaching 59.2M USDT, showing a clear influx of funds. In terms of moving averages, MA5=0.04437 has crossed above MA20=0.040837, with a bullish alignment beginning to form; however, RSI=62.4 has not yet entered overbought territory, leaving room for further upside. The MACD histogram=-0.0006416 indicates potential divergence concerns in short-term momentum. The key signal is the funding rate
post-image
OGN+89.85%
DOGE-4.47%
RLC+36.29%
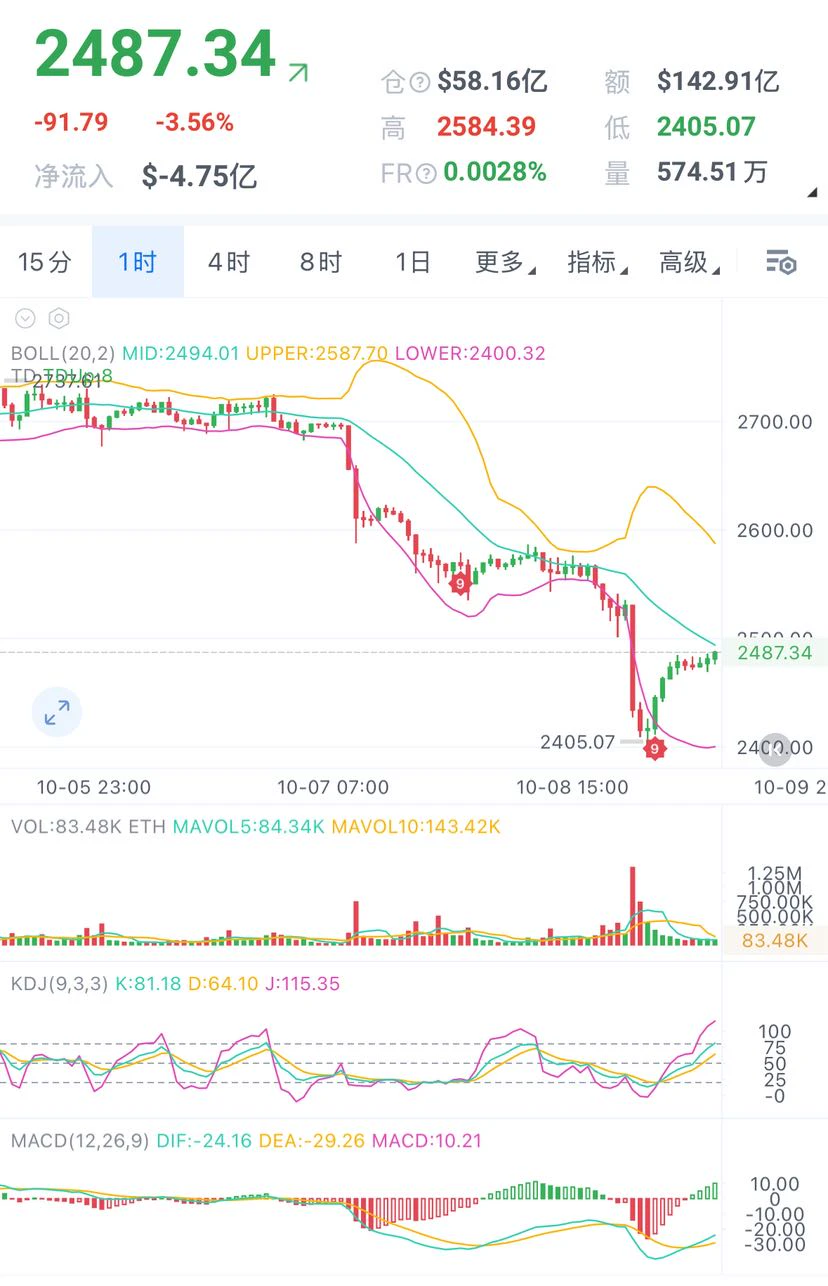
Ethereum’s 1-hour chart staged an oversold recovery rebound after plunging to a low of 2405, but this rebound is defined as a rally within a continuing decline, not a reversal into a bullish trend. In terms of indicators, the price has rebounded to below the Bollinger middle band, with a strong resistance zone forming near the middle band. This is the key test level for this rebound. Once the price reaches this area, selling pressure will be released intensively. On the indicator side, KDJ has risen into the overbought zone, with short-term bullish momentum severely depleted and insufficient s
post-image
ETH-3.22%
Load More

Join 40 M users in our growing community

⚡️ Join 40 M users in the crypto craze discussion

💬 Engage with your favorite top creators

👍 See what interests you

Trending Topics

Gate Money Officially Launches

3.48k Views12.91k Discussing

Gate officially launches Gate Money, a global integrated financial services app that brings digital assets, fiat, stocks, ETFs, gold, bank accounts, and payments into one Gate App. Users can manage assets, invest, send and receive funds, convert currencies, and make payments — all from a single account. Which use case are you most excited about? [👉 Learn more](https://www.gate.com/announcements/article/102094)

BTC Pulls Back to 81000

25.4k Views35.65k Discussing

AIStocksFallALABDropsOver9%

24.52k Views539 Discussing

View More