Share your thoughts
placeholder
Article
#EthereumSpotETFsSee144MNetInflow
Ethereum Spot ETFs See $ETHNet Inflow: Institutional Demand Returns
Ethereum is once again attracting strong attention from institutional investors as U.S. spot Ethereum ETFs recorded approximately $BTC million in net inflows on September 18, according to data attributed to SoSoValue. The inflow ended a three-session streak of net outflows and highlighted renewed demand for exposure to ETH through regulated investment products.
bloomingbit
The biggest contributor was BlackRock’s iShares Ethereum Trust (ETHA), which attracted about $114.32million in a single
post-image
CryptoEye
#EthereumSpotETFsSee144MNetInflow
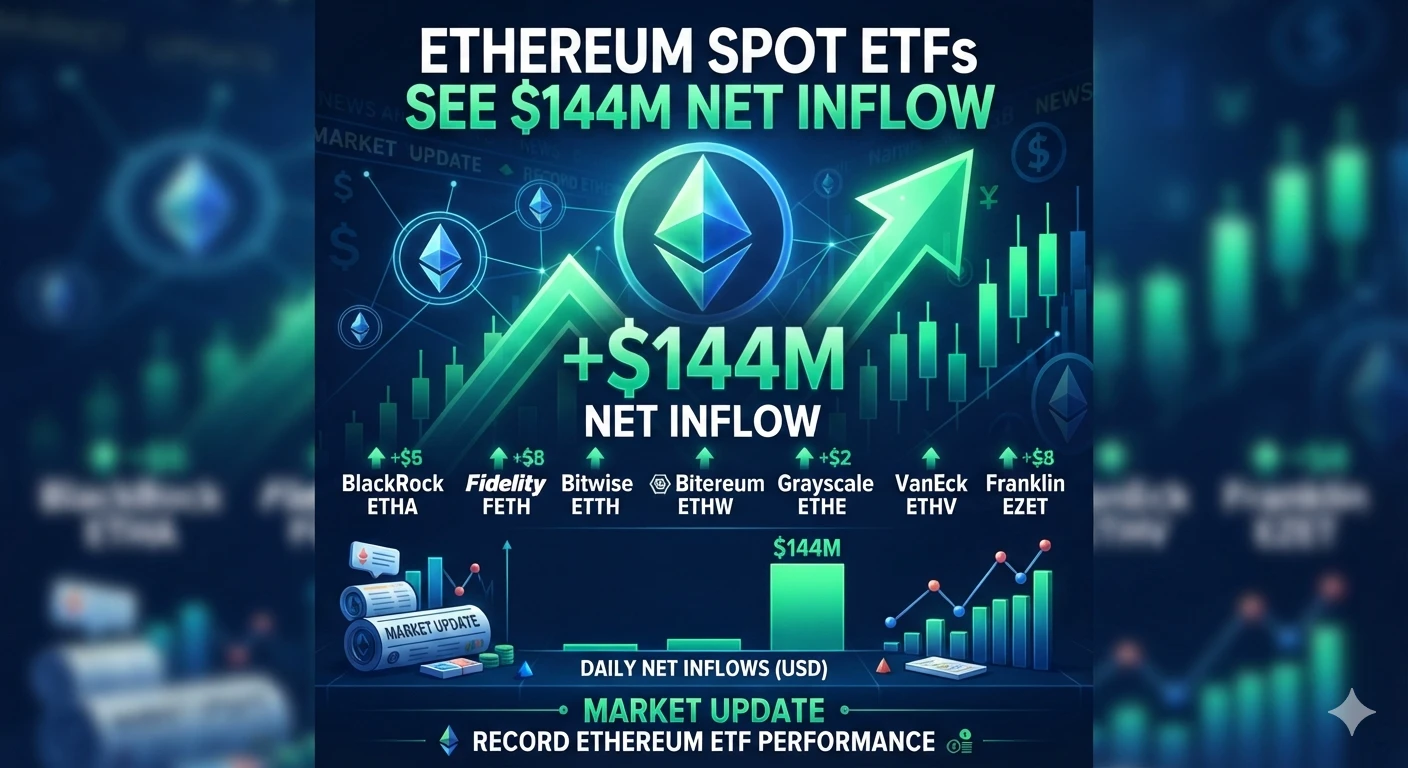
Ethereum Spot ETFs See $144M Net Inflow: Institutional Demand Returns
Ethereum is once again attracting strong attention from institutional investors as U.S. spot Ethereum ETFs recorded approximately $143.8 million in net inflows on September 18, according to data attributed to SoSoValue. The inflow ended a three-session streak of net outflows and highlighted renewed demand for exposure to ETH through regulated investment products.
bloomingbit
The biggest contributor was BlackRock’s iShares Ethereum Trust (ETHA), which attracted about $114.32 million in a single session. Fidelity’s FETH followed with approximately $26.24 million, while several other Ethereum ETFs also recorded positive flows. Collectively, these figures indicate that capital was moving back into Ethereum investment products after recent selling pressure.
bloomingbit
The broader picture is also notable. U.S. spot Ethereum ETFs have accumulated roughly $13.25 billion in historical net inflows, while total assets held by the products stood around $16.72 billion in the latest reported data.
PANews
For the Ethereum market, ETF flows are an important sentiment indicator. Sustained inflows can signal growing institutional participation and potentially provide additional demand for ETH. However, one positive trading session should not be treated as confirmation of a long-term trend. Crypto markets remain sensitive to macroeconomic conditions, liquidity, Bitcoin movements, and changes in risk appetite.
The latest flow data therefore gives Ethereum traders another important metric to watch. If positive ETF flows continue alongside improving market liquidity and stronger spot demand, attention could increasingly return to ETH’s broader recovery structure.
Key takeaway: $144 million of net ETF inflows represents a meaningful return of capital to Ethereum products, but the durability of this trend will depend on whether inflows continue over multiple sessions.
#Ethereum
@Gate_Square
repost-content-media
ETH+7.79%
BTC-0.35%
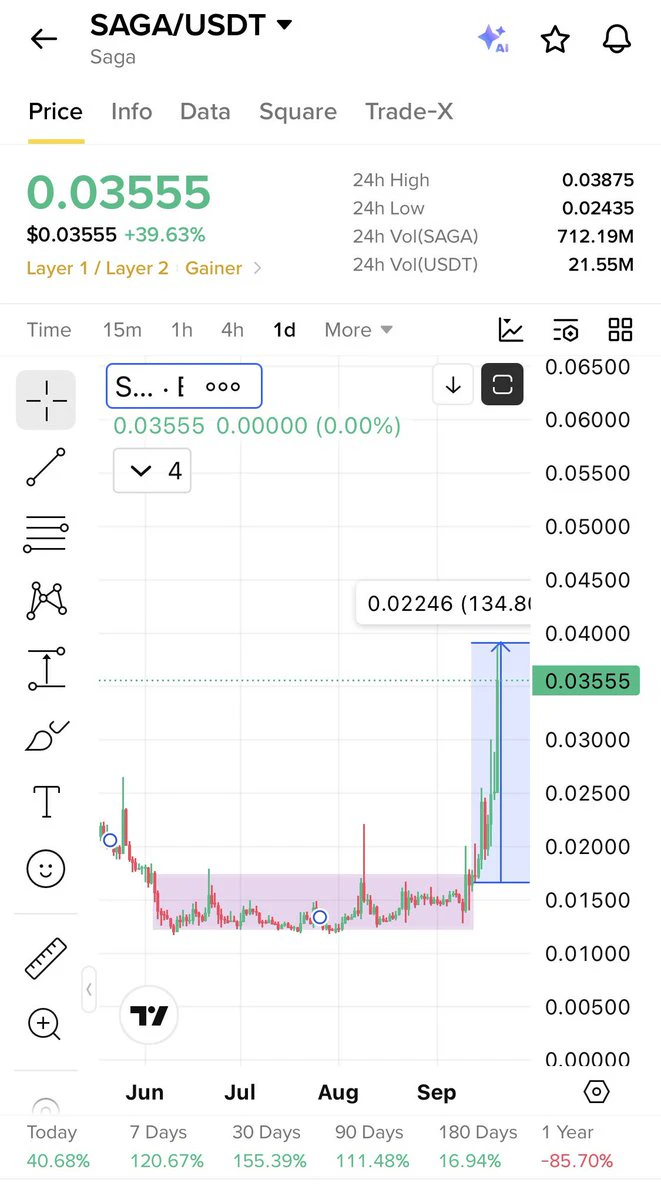
$Manta ready and breaking out like $Saga
Few added $Saga with me now up huge
Will appreciate love fam ❤️
post-image
MANTA+8.38%
SAGA+47.99%
We’re checking out first thing in the morning! 👀👀
Prepared a little surprise (hope the housekeeper won’t be startled)
post-image
( new streamer) market overview
live-cover
LIVE64
[New Streamer] Market Prediction
live-cover
LIVE13
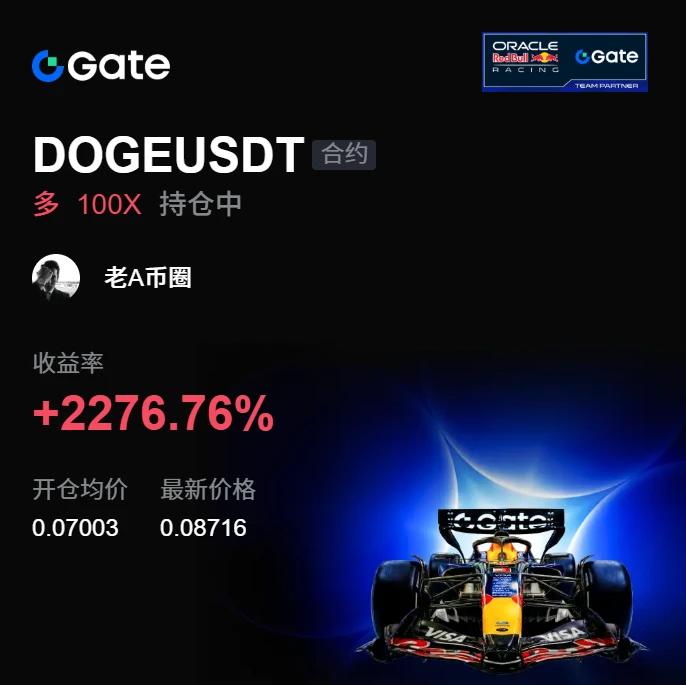
To be honest, I’m surprised this trade has survived until now; luck played a significant part.
A few days ago, I was watching $DOGE in the early hours. It held above the key level and stabilized after the pullback, so I gave just one signal at the time: open a long. I didn’t expect it to actually come through.
From 0.07003 all the way to 0.08705, +2260.82% says it all. That was a satisfying bite of profit—staying up late wasn’t for nothing.
The market is won by waiting, and profits are secured by holding. Putting risk control first is rational; cutting after taking a loss is a last-resort move
post-image
DOGE-2.99%
BTC-0.33%
ZEC-0.09%
Everyone in the group is calling for a bullish move, so I’m taking the contrarian side. The Fed slapped the S&P down this week, sending it from 7600 to 7650 before it climbed back—sellers clearly had a chance to break through but couldn’t hold it down, which shows there are buyers underneath. The 7800 level still hasn’t broken. Before the 0DTE options expire, the market is most likely to spike during the early morning hours, when liquidity is thinnest. Don’t chase the highs; staying alive is more important than making quick money. Share your position.
post-image
SPX-5.20%
$AVAX Go long
Entry price: 11.31 Target 1: 11.55 Target 2: 11.85 Target 3: 12.20 Stop-loss: 10.98 Price remains stable in the current area, and bulls are attempting to build momentum. If nearby resistance is broken, the price may move further upward.
post-image
AVAX+15.68%
The Double RR stands for Risk & Reward.
@RollsRoyce
Only the best of the best.
Why is everyone suddenly shorting SKHYNIX just as the 4h setup clicks into place?

$SKHYNIX /USDT - SHORT

Trade Plan:
Entry: 1340.19 – 1342.45
SL: 1352.16
TP1: 1333.19
TP2: 1327.77
TP3: 1319.63

Why this setup?
Why now? The daily trend is range-bound, so a directional push needs a catalyst that has not arrived yet, and the 1h ATR of 4.517794 tells us volatility is compressed enough for a sharp move once it breaks. The 15m RSI at 64.17 shows the bounce is still climbing but not yet overbought, which supports the short thesis if sellers step in. The entry zone sits between 1340.19 and 1342.4
SKHYNIX+0.26%
$MSTR ‌The Leveraged Proxy: How Strategy Topped the Nasdaq 100 by Nearly Doubling Bitcoin's Gain
There is a particular kind of outperformance that emerges when a company stops being valued on its operating business and starts being valued on the assets it holds. Strategy Inc. (MSTR) is living in that territory now. Over the past month, the stock gained approximately 48%, making it the best performer in the Nasdaq 100. Bitcoin, the asset that drives its balance sheet, rose roughly 12% over the same period. That is a fourfold amplification of the underlying move, and it explains both the appeal
post-image
MSTR+16.35%
  • 16
  • 1
#GarrettJinHolds320MInZEC
Zcash is suddenly one of the most closely watched large-cap assets in the market, and the reported $320 million position linked to Garrett Jin adds another major layer to the story.
According to Gate News, Jin reportedly holds around 202,080 ZEC, valued at approximately $320 million based on a reference price near $1,580. But the more interesting part is that the position is not simply a massive spot bet. Reports also indicate that Jin holds roughly 38,000 ZEC in a Hyperliquid short position worth around $60 million.
That creates a much more complicated market struct
post-image
ZEC-0.19%
  • 3
Insiders are quietly fading the daily bullish trend on $NEAR /USDT

$NEAR /USDT - SHORT

Trade Plan:
Entry: 4.0237 – 4.0925
SL: 4.4880
TP1: 3.7357
TP2: 3.5207
TP3: 3.1983

Why this setup?
Why now? The 1h price is sitting at 4.0582, right inside the entry zone of 4.0237 to 4.0925, while the 15m RSI at 62.8 shows the bounce is already losing steam. The 1h ATR of 0.137784 tells us the average hourly move is large enough to reach TP1 at 3.7357 and TP2 at 3.5207 without a slow grind. Because the daily trend is still labeled bullish, this short is a reversal play against crowd psychology, and the
NEAR+11.95%
Everyone is calling this a breakout but the 1h tape says something else entirely.

$ETH /USDT - SHORT

Trade Plan:
Entry: 2642.85 – 2651.51
SL: 2701.27
TP1: 2606.61
TP2: 2579.56
TP3: 2538.99

Why this setup?
Why now? The 4h structure is rolling over while the daily trend remains stubbornly bullish, creating a squeeze that favors the short side. The 15m RSI is reading 78.92, which means momentum is exhausted and a mean reversion toward the lower targets is the highest probability move. The 1h ATR of 17.338085 tells us that the current volatility is enough to push price clean through the 2606
ETH-0.34%
  • 1
Everyone is sleeping on this bullish setup while SYMBOL quietly stacks gains.

$BTC /USDT - LONG

Trade Plan:
Entry: 81087.28 – 81254.04
SL: 80370.21
TP1: 81771.00
TP2: 82171.22
TP3: 82771.56

Why this setup?
Why now? The daily trend is firmly bullish and the 1h ATR of 333.52 confirms enough volatility for a clean move. The 15m RSI at 65.75 shows momentum without being overbought, leaving room to run. The entry zone sits between 81087.28 and 81254.04, with the entry reference at 81170.66 acting as the precise trigger. TP1 at 81771.00 and TP2 at 82171.22 define the first two profit targets,
post-image
BTC-0.33%
#JapanRealEstatePowerChipStocksRise
Japan’s equity market is seeing renewed attention across two distinct areas: real estate and semiconductor-related companies. Recent land-price data showed Japanese land prices increased 1.5% in the year through July 1, marking the fifth consecutive annual increase. Prices across the Tokyo, Osaka and Nagoya metropolitan areas rose 4.4% on average.
The property-market trend has also been reflected in listed real-estate companies. Recent market reporting showed gains across several major Japanese developers following the land-price data, with investors monito
#ShareWeekly #Gate广场中秋团圆局
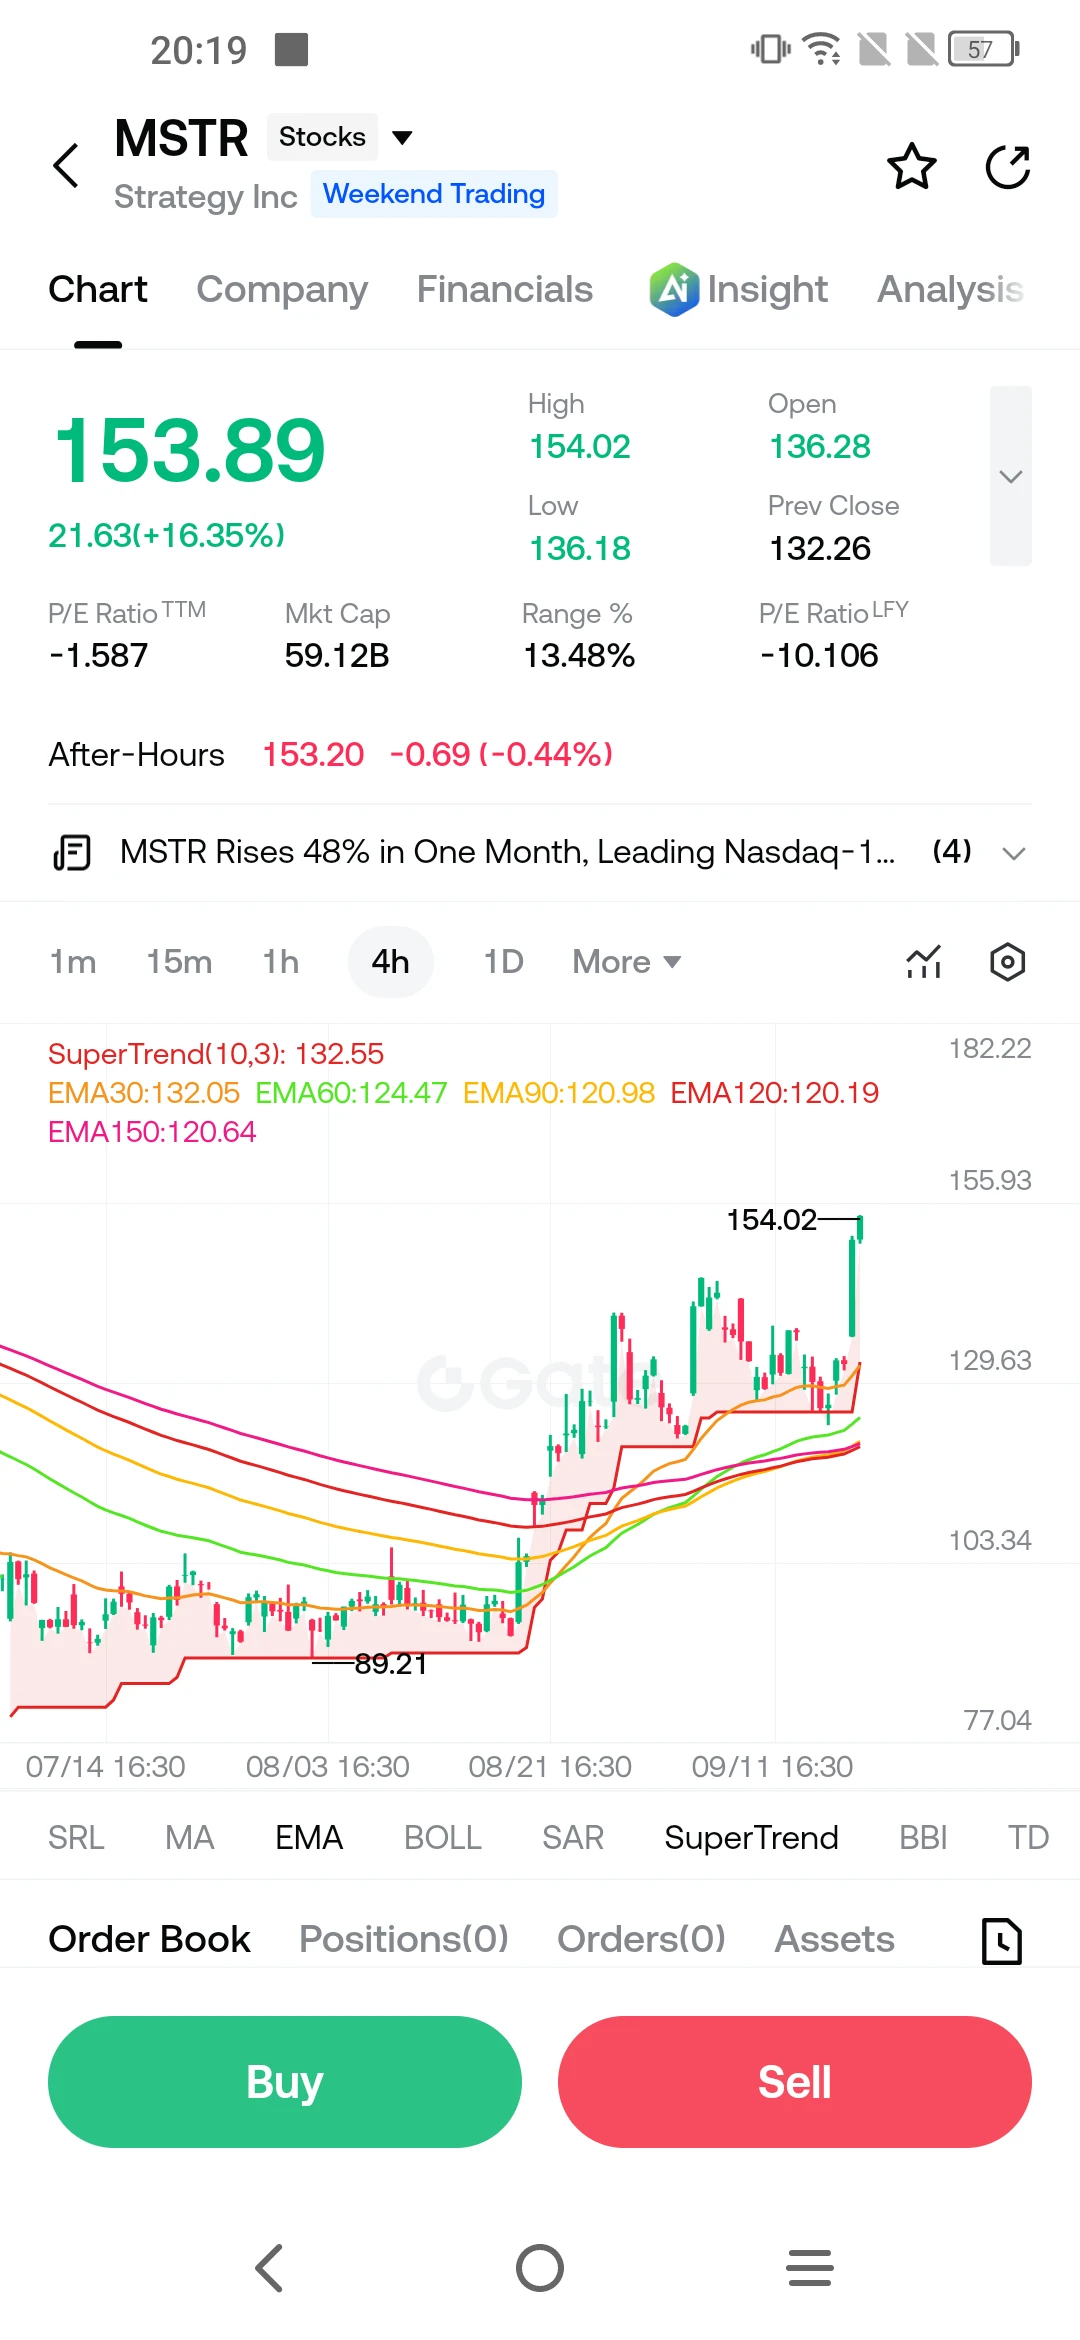
MSTR is no longer just following Bitcoin the relative-strength move is the part I’m watching
The latest close gave MSTR a very different chart from the usual slow BTC-beta move. Strategy closed at $153.92, up 16.39% in one session, with 53.97 million shares changing hands. The intraday range was wide $136.18 to $154.02 and that combination of price expansion + volume makes the move worth separating from Bitcoin itself.
① Start with the BTC comparison
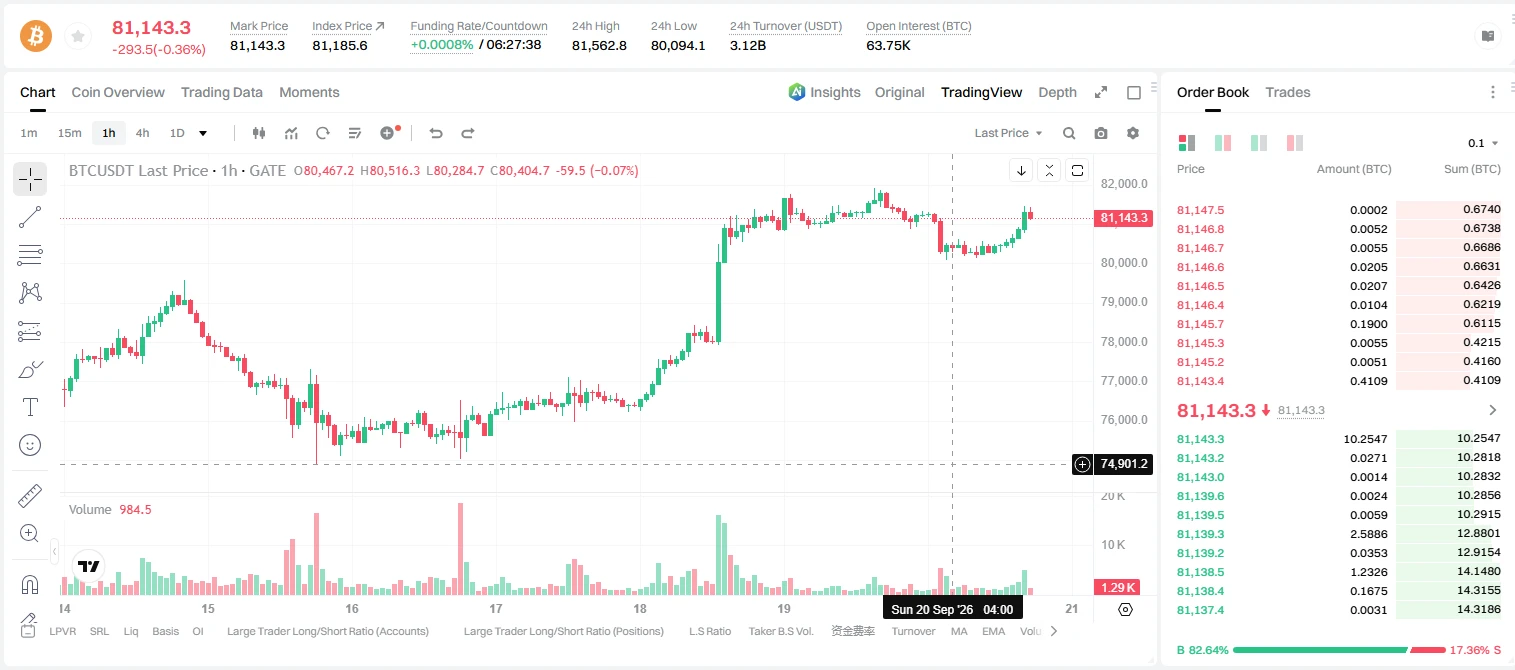
Bitcoin was around $81,000–$81,500 during the same market window, after reclaiming the $80,000 area. On September 18,
post-image
MSTR+16.35%
BTC-0.35%
ETH-0.39%
TOKEN2049 Singapore is back.
7–8 October. Marina Bay Sands. The biggest crypto gathering of the year.
This is not just another conference. TOKEN2049 has become the industry’s annual checkpoint.
Founders, funds, exchanges, L1s, L2s, market makers, and institutions from 160+ countries pack five floors of Marina Bay Sands.
25,000+ people. 500+ exhibitors. 300+ speakers. And over 1,000 side events across the city the entire week.
It happens every year for a reason. Singapore is where Asia’s capital, regulation, and crypto liquidity sit in one place. Deals get done in hallways.
Partnerships get an
post-image
#GlassnodeSaysBTCMarketStillBullish
Glassnode just gave me another reason to watch Bitcoin closely.
A lot of the BTC being sold recently is still being sold in profit, but I don't think that automatically means we are at a market top. The more important question is what happens to that profit-taking after the coins are sold.
Glassnode's latest data shows something interesting: Bitcoin's Sell-Side Risk Ratio has fallen to around 7 basis points per day on a 7-day basis, less than half the 16 bps seen at the August peak. At the same time, long-term holders' share of realized profit has dropped f
post-image
BTC-0.35%
Everyone is sleeping on SYMBOL while the 1h ATR screams volatility ahead.

$ETH /USDT - LONG

Trade Plan:
Entry: 2620.25 – 2629.85
SL: 2579.01
TP1: 2659.58
TP2: 2682.59
TP3: 2717.12

Why this setup?
Why now? The daily trend is bullish and the 1h price is holding at 2625.05, which anchors the entry zone between 2620.25 and 2629.85. The 15m RSI at 68.33 shows momentum is still running but not yet overbought, giving room to run. The 1h ATR of 19.181656 means each candle is already pricing in big moves, so a breakout from entry should be explosive. Targets sit at 2659.58 for TP1 and 2682.59 for
ETH-0.34%
Load More

Join 40 M users in our growing community

⚡️ Join 40 M users in the crypto craze discussion

💬 Engage with your favorite top creators

👍 See what interests you

Trending Topics

MSTRTopsNasdaq100

74.26k Views3.03k Discussing

Strategy (MSTR) has gained about 48% over the past month, making it the best-performing stock in the Nasdaq 100, while Bitcoin rose roughly 12% over the same period. The company holds 845,050 BTC with a cumulative cost basis of about $63.73B. MSTR is not a pure Bitcoin proxy — its price swings can be more extreme. Can this rally last?

Gate Tops 24H Net Inflows Among Exchanges

26.51k Views3.69k Discussing

BTCRetakes80K

57.37k Views60.68k Discussing

View More