
Futures
Access hundreds of perpetual contracts
CFD
Gold
One platform for global traditional assets
Options
Hot
Trade European-style vanilla options
Unified Account
Maximize your capital efficiency
Demo Trading
Introduction to Futures Trading
Learn the basics of futures trading
Futures Events
Join events to earn rewards
Demo Trading
Use virtual funds to practice risk-free trading
CFD
U.S. stock CFD derivatives
US Stocks
Access real US stocks and ETFs
HK Stocks
Trade quality Hong Kong-listed stocks
Korean Stocks
SK Hynix
Real Korean stocks and top assets
Stock Futures
High leverage, 24/7 trading
Tokenized Stocks
Backed by real stock assets
IPO Access
Unlock full access to global stock IPOs
GUSD
Mint GUSD for Treasury RWA yields
Stocks Activities
Trade Popular Stocks and Unlock Generous Airdrops
Launch
CandyDrop
Collect candies to earn airdrops
Launchpool
Quick staking, earn potential new tokens
HODLer Airdrop
Hold GT and get massive airdrops for free
IPO Access
Unlock full access to global stock IPOs
Alpha Points
Trade on-chain assets and earn airdrops
Futures Points
Earn futures points and claim airdrop rewards


Promotions
AI
Gate AI
Your all-in-one conversational AI partner
Gate AI Bot
Use Gate AI directly in your social App
GateClaw
Gate Blue Lobster, ready to go
Gate for AI Agent
AI infrastructure, Gate MCP, Skills, and CLI
Gate Skills Hub
10K+ Skills
From office tasks to trading, the all-in-one skill hub makes AI even more useful.


End of Adjustment or Trend Continuation: BTC, HYPE Technical Structure Review | Special Analysis
This weekly report focuses on multi-cycle technical structure analysis of two major targets: BTC and HYPE. The Bitcoin section analyzes the adjustment structure since the May 6 high from both the daily and 4-hour cycles, and combines a self-built quantitative model to provide predictions for key resistance, support levels, and medium-to-short-term trading paths this week. The HYPE section focuses on the 4-hour level trend, analyzing the structural evolution of this rebound and offering corresponding risk control suggestions for short-term operations this week. The following are the specific contents.
Last Week's Strategy Verification
I. Bitcoin Multi-Cycle Trend Structure Analysis
1. Daily Level Trend Structure Analysis
Bitcoin Daily K-line Chart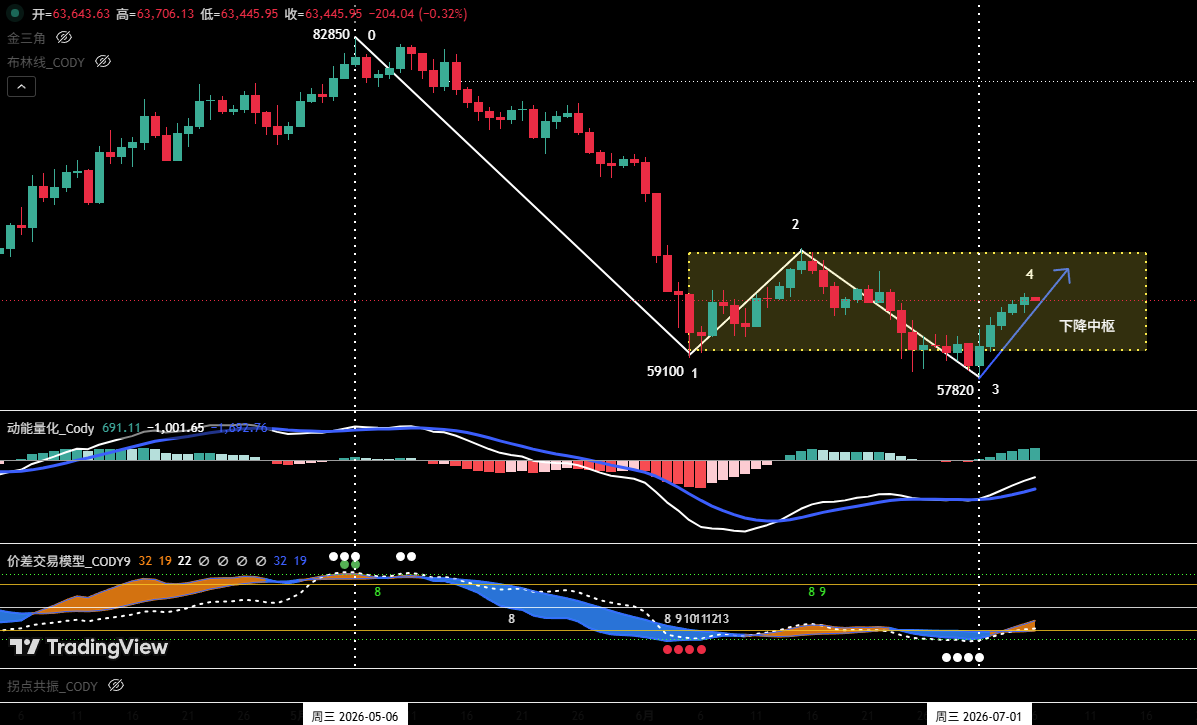
Figure 1
① As shown in Figure 1: Since the adjustment started from the high of $82,850 on May 6, the daily chart has presented a clear four-section adjustment structure from "Endpoint 0" to "Endpoint 4".
② The market is currently running the (3-4) rebound segment. The position of the end point of "Endpoint 4" will determine the short-term trend of the coin price.
③ According to the analysis of the self-built quantitative model, the probability of the market entering range-bound consolidation (i.e., Path One) is significant.
2. In-depth Analysis of Hourly Level Trend Structure (Using 4-hour as analysis cycle)
Bitcoin 4-hour K-line Chart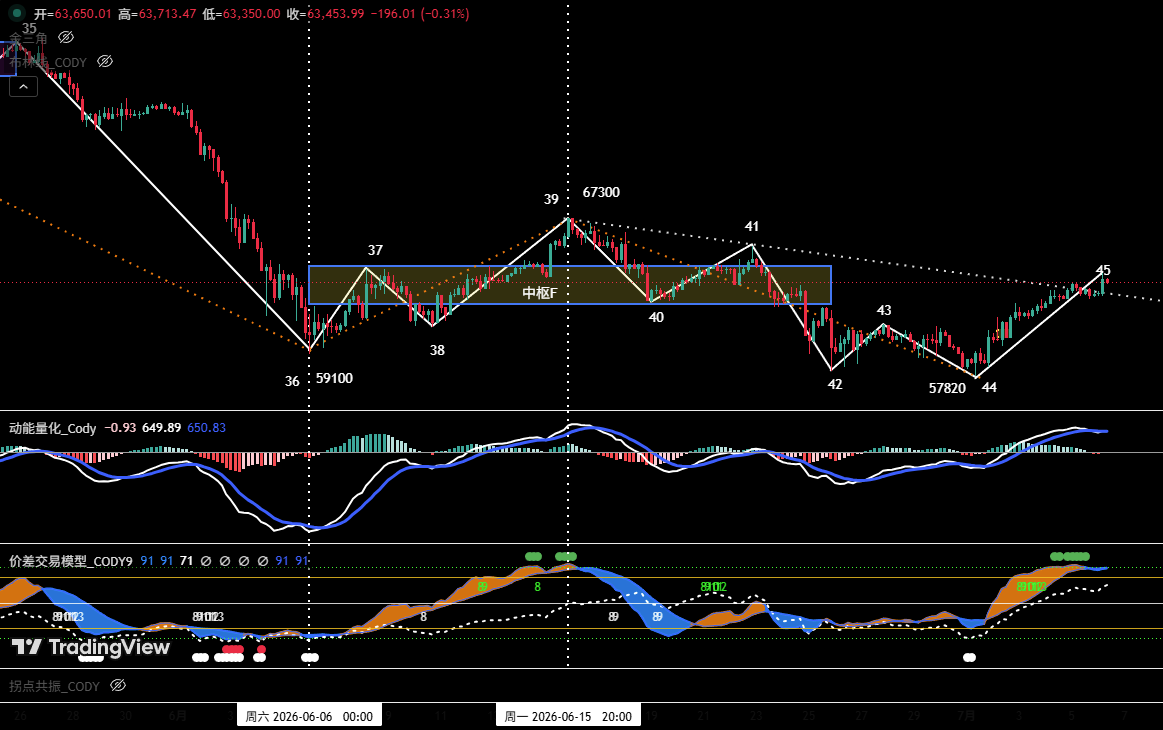
Figure 2
① Last week's review pointed out: "If the end point of Endpoint 44 is below $58,110 and forms a momentum bottom divergence, the market will have a rebound opportunity." The market trend last week validated this judgment, with the actual trend highly consistent with the predicted structure.
② On the 4-hour chart, the hourly-level decline wave starting from the high of $67,300 on June 15 has completed a complete five-section structure. At the same time, at the end of the adjustment, comparing the two lows of "Endpoint 44" and "Endpoint 42," a clear momentum bottom divergence pattern has formed, providing technical support for the subsequent oversold rebound.
③ Currently, the market is in the (44-45) rebound phase. From Figure 2, the current rebound high "Endpoint 45" has broken through the lower rail of the previous "decline center F" (approximately $62,300), and the short-term trend is developing in a bullish direction. If the market can further break through "Endpoint 41" (approximately $65,700), it would indicate an upgrade in rebound strength, and the probability of directly falling below "Endpoint 44" (approximately $57,820) after the subsequent rebound meets resistance and declines would be greatly reduced.
II. Bitcoin This Week's Market Prediction and Operation Strategy (07.06~07.12)
1. BTC This Week's Market Trend Prediction
Core View: Focus on the position of the daily oversold rebound high starting from the low of $57,820.
2. Core Resistance Levels:
• First Resistance Zone: $64,500~$65,700 area (previous important high/low positions)
• Second Resistance Zone: Near $67,300 (previous important resistance area)
• Third Resistance Zone: $69,500~$71,000 area (previous important resistance area)
3. Core Support Levels:
4. This Week's Operation Strategy
① Medium-term Strategy:
** Bitcoin Daily K-line Chart (Position Monitoring Model)**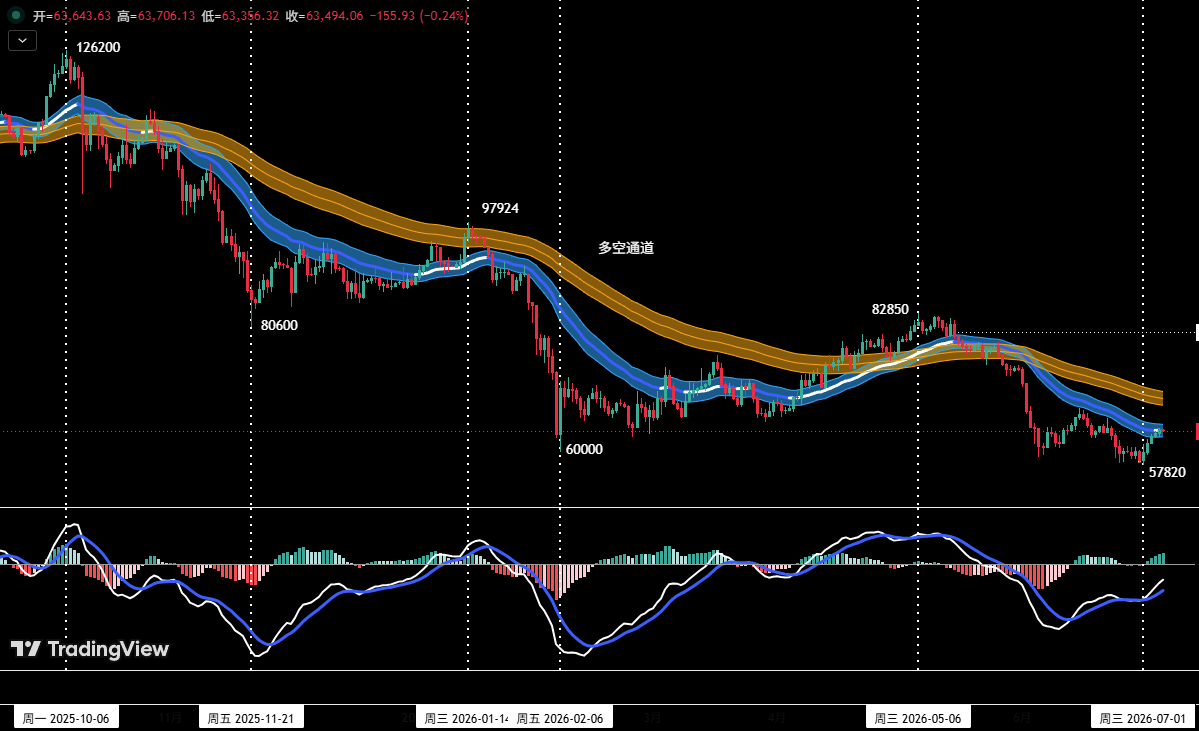
Figure 3
As shown in Figure 3, the current coin price has effectively broken below the "Bull-Bear Channel," and the market structure has confirmed a shift to a bearish dominant pattern.
② Short-term Strategy
Use 30% of positions, set stop-loss points, and look for "spread" opportunities based on support and resistance levels (using 30-minute/60-minute as operation cycles).
③ Short-term Operation Plan
To dynamically respond to complex market developments, prepare two specific operation plans in advance: A and B.
III. HYPE Hourly Level Trend Structure Analysis
HYPE 4-hour K-line Chart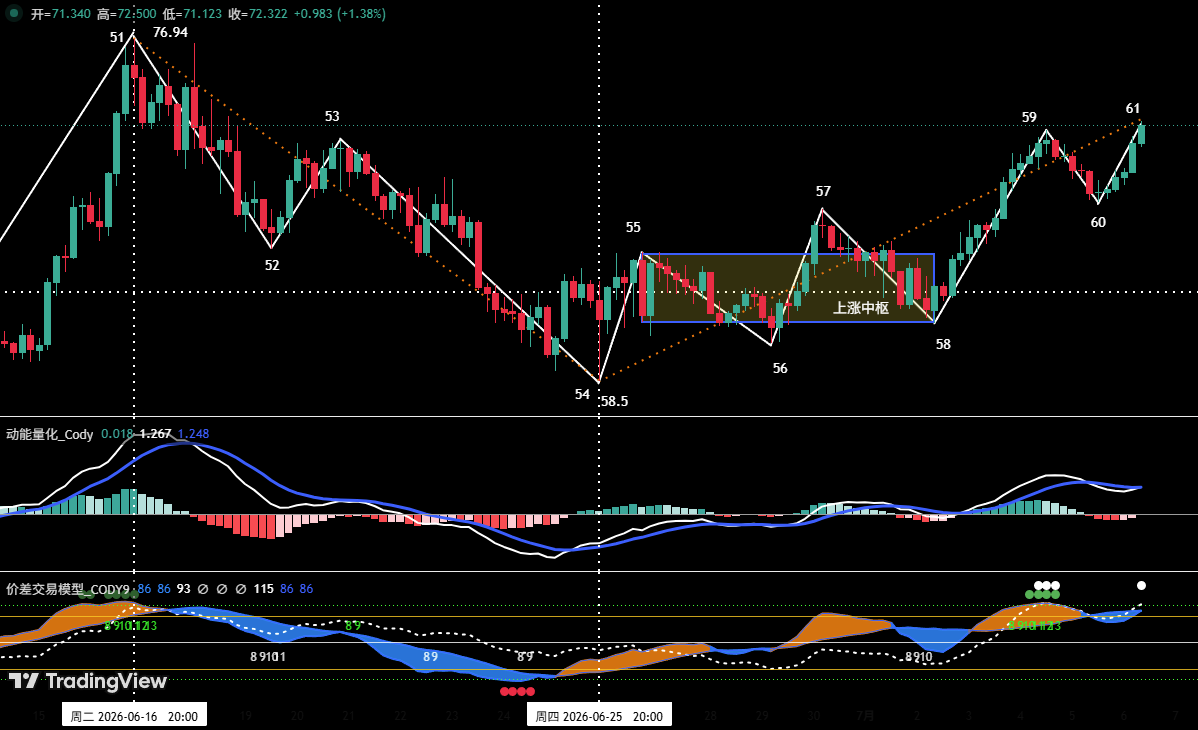
Figure 4
IV. HYPE This Week's Market Prediction and Short-term Operation Strategy
1. HYPE This Week's Market Trend Prediction
Core Resistance Levels
Core Support Levels
This Week's Core View: When the price rises to the $75~$76.94 area, observe the result of the battle between bulls and bears in that area.
2. HYPE This Week's Short-term Operation Strategy
This week, focus on closing positions to lock in profits and prevent risks. If you have already placed long orders in the support area according to the plan, it is recommended to move the stop-loss up to around $68 to protect profits (or decide on your own). If the market adjusts, close positions promptly to take profits.
V. HYPE Short-term Operation Review
We strictly followed the operation plan, based on trading signals from our self-built "spread trading model" and "momentum quantitative model," completing one short-term (long) operation last week, with a total trading profit of approximately 10.23%.
Short-term Trade 1: (See Table 1)
① HYPE Short-term Trade Details Summary: (Leverage *1)
Table 1
② Short-term Trade Review: (See Figure 5)
• Entry Strategy:
a. Based on accurate judgment of the overall upward trend of the price.
b. When the price effectively broke through the short-term downtrend line, and the "spread trading model" and "momentum quantitative model" simultaneously issued bottom divergence resonance signals.
Therefore, we established a 30% long position at $64.
• Exit Strategy:
a. When the price rose to the $72 resistance area and showed stagnation, forming a "top divergence" pattern on the K-line;
b. The "spread trading model" triggered a strong top warning signal (green dot + white dot), and formed a top resonance signal with the "momentum quantitative model."
Therefore, we fully closed the position near $70.55.
• Summary: This trade successfully profited about 10.23%.
HYPE_60-minute K-line Chart: (Momentum Quantitative Model + Spread Trading Model)
Figure 5 (Short-term Trade Illustration)
VI. Special Notes
The financial market changes rapidly. All market analysis and trading strategies need dynamic adjustments. All views, analysis models, and operation strategies mentioned in this article are based on personal technical analysis, solely for personal trading log purposes, and do not constitute any investment advice or operational basis. The market has risks; investment must be cautious. Do not make decisions based on this.