Futures
Access hundreds of perpetual contracts
CFD
Gold
One platform for global traditional assets
Options
Hot
Trade European-style vanilla options
Unified Account
Maximize your capital efficiency
Demo Trading
Introduction to Futures Trading
Learn the basics of futures trading
Futures Events
Join events to earn rewards
Demo Trading
Use virtual funds to practice risk-free trading
CFD
U.S. stock CFD derivatives
US Stocks
Access real US stocks and ETFs
HK Stocks
Trade quality Hong Kong-listed stocks
Korean Stocks
SK Hynix
Real Korean stocks and top assets
Stock Futures
High leverage, 24/7 trading
Tokenized Stocks
Backed by real stock assets
IPO Access
Unlock full access to global stock IPOs
GUSD
Mint GUSD for Treasury RWA yields
Stocks Activities
Trade Popular Stocks and Unlock Generous Airdrops
Launch
CandyDrop
Collect candies to earn airdrops
Launchpool
Quick staking, earn potential new tokens
HODLer Airdrop
Hold GT and get massive airdrops for free
IPO Access
Unlock full access to global stock IPOs
Alpha Points
Trade on-chain assets and earn airdrops
Futures Points
Earn futures points and claim airdrop rewards
Promotions
AI
Gate AI
Your all-in-one conversational AI partner
Gate AI Bot
Use Gate AI directly in your social App
GateClaw
Gate Blue Lobster, ready to go
Gate for AI Agent
AI infrastructure, Gate MCP, Skills, and CLI
Gate Skills Hub
10K+ Skills
From office tasks to trading, the all-in-one skill hub makes AI even more useful.
Will a slowdown in Capex definitely end the market trend?
Recently, volatility in global tech stocks has intensified again. The sources behind this volatility, whether it's last week's price hikes for Apple's product series or this week's Meta leasing/selling computing power externally, all revolve around one concern: whether future demand for computing power will slow down, and whether the high growth in Capex is unsustainable? This is the focus of market attention.
The market's concern about the growth rate of Capex is essentially a concern about tech stocks' earnings growth peaking. The underlying driver of this AI wave is the growth in global demand for computing power, and hyperscalers' capital expenditures are the core engine driving the performance of global tech stocks. Whether for US hardware or software stocks, the consensus expectations for year-over-year growth over the next 12 months are strongly correlated with hyperscalers' Capex year-over-year.
We will not discuss the path of future Capex growth for now, as it is actually very difficult to predict. First, market expectations usually adjust continuously with industry developments and company guidance: from 2024 to 2026, the expected Capex growth rate at the beginning of the year differed from the actual final value by about three times. Second, the pace of corporate capital expenditure deployment itself has a certain degree of subjectivity, and announced Capex guidance is often revised based on their own business progress.
But the recent market concerns have also triggered a thought: will a slowdown in Capex necessarily lead to the end of the bull run? In other words, will stock prices definitely fall when earnings growth declines from a high level? This is a question worth exploring in depth. We review typical leaders from the historical internet bull market and combine it with the corresponding experience of A-shares to answer this core question that the market is highly concerned about.
Since US stocks are the core driver and emotional "anchor" of this global AI bull market, we first summarize historical experience by taking Microsoft, a leader in the internet bull market, as an example.
Throughout the 1990s internet bull market, although Microsoft's stock price rose all the way, it did not always maintain accelerating prosperity. During 1996-2000, Microsoft actually saw two peaks in earnings growth:
The first was in mid-1997. At that time, global PC penetration entered a stage of saturation, installation demand slowed marginally, corporate IT procurement entered a period of consolidation, and combined with the high base of previous performance, Microsoft's EPS_TTM year-over-year peaked and declined from a high of 70%.
The second was the more well-known March 2000. As the Y2K replacement wave prematurely drained capital expenditure demand, orders for leading companies shrank significantly. Microsoft's EPS_TTM year-over-year fell from a high of over 50% all the way down and even turned negative.
However, these two peaks in earnings growth had two completely different outcomes reflected in the stock price. The earnings peak in mid-1997 only caused Microsoft's stock price to level off, without a systemic decline. After earnings growth resumed its upward trend in 1998, the stock price also began a new round of increases. In contrast, the earnings growth peak in March 2000 confirmed the stock price's high point. Microsoft's stock price followed earnings growth downward throughout the year, and only stopped declining after earnings growth bottomed out and stabilized in 2001.
Why the difference? We believe the "absolute level" of earnings growth is important, with 30% being a key watershed. In mid-1997, although earnings growth began to decline, it stayed near 30% at its lowest, still within the "high growth" range. Therefore, the stock price only flattened rather than declined systematically. But the decline in March 2000 broke through 30% and even turned negative. The collapse of the "high growth" logic caused the stock price to enter a sustained downward channel.
Why 30%? The valuation center of US tech manufacturing leaders is generally around 30 times PE. A 30% earnings growth rate is a relatively desirable level relative to that valuation.
Therefore, by reviewing Microsoft in the internet bull market, we draw an important conclusion: A decline in growth from a high level does not necessarily lead to a systemic end of the bull run. If earnings can remain within the high growth range and match current valuations, stock prices will not necessarily decline systematically. A 30% earnings growth rate is an important watershed.
Furthermore, in retrospection, during a large-scale industrial trend that is hard to easily falsify, the market itself has its own criteria for judging whether the "high growth logic" can continue. Only when the signal of the growth logic's collapse is strong enough will the market completely break the original pricing logic; otherwise, it often waits for clearer fundamental verification signals. In the internet bull market, a phase of slowing penetration was insufficient to end a major industrial trend. What truly caused the systemic end of the bull run was "the end of the replacement wave demand," a core demand inflection point that undermines the underlying support of capital expenditures.
Corresponding to the current cycle, first, the explosion of Capex follows the progress of AI commercialization, often being nonlinear and unpredictable. Even if growth slows temporarily at some point in the future, it does not necessarily mean the end of the bull run. As long as the earnings growth of leading companies can remain within the high growth range, even if the growth rate edges down, stock prices may not decline systematically. Second, we need to distinguish the underlying logic of the Capex slowdown. If it stems from a confirmed slowdown in end-user demand in the AI industry, caution is needed; otherwise, we can wait for clearer validation signals.
At the individual stock level, if we take the leader Zhongji Innolight as an observation, we can also draw similar conclusions. In mid-2024, as global capital expenditure and leading companies' net profit growth both passed the fastest stage of low-base growth in the early industry phase, Zhongji Innolight's earnings growth peaked and declined. The resulting stock price volatility, in hindsight, was only a minor disturbance before the "main uptrend" (and the decline was mostly contributed by emotional shocks such as DeepSeek narratives and trade wars). In mid-2025, as global capital expenditure entered a new round of explosive cycle and earnings growth bottomed and rebounded (stopped declining at 74%, with the high-growth logic not systemically impacted), the stock price also entered the "main uptrend" stage.
From an overall statistical perspective, does this rule still hold? We classify all individual stocks into different prosperity types based on current earnings growth rate and its change relative to the previous period, using 30% as the threshold for "high growth." We calculate the median excess return over the All A-share Index for different prosperity types from 2010 to 2025:
"High growth and accelerating prosperity" is undoubtedly the most favored prosperity type by the market. In some years, the "medium-low growth accelerating to high growth" type, due to its strong earnings elasticity or growth logic, also receives more positive pricing from the market.
More importantly, when a high-growth industry or company experiences a slowdown in prosperity and a decline in earnings growth, stock prices do not necessarily fall; it depends on the level of earnings growth: 1) If it remains above 30% and maintains high growth, it can still achieve relatively high excess returns; 2) If it drops from >30% to a medium-low growth of 0-30%, excess returns will narrow significantly; 3) If it directly turns negative, excess returns will also turn negative and underperform the market.
Therefore, the same conclusion can be drawn from the statistical rules of A-shares: "High growth and accelerating prosperity" is certainly best; but if a high-growth company's prosperity slows, stock prices do not necessarily fall. Whether the growth rate breaks below 30% is the key threshold for whether excess returns narrow significantly.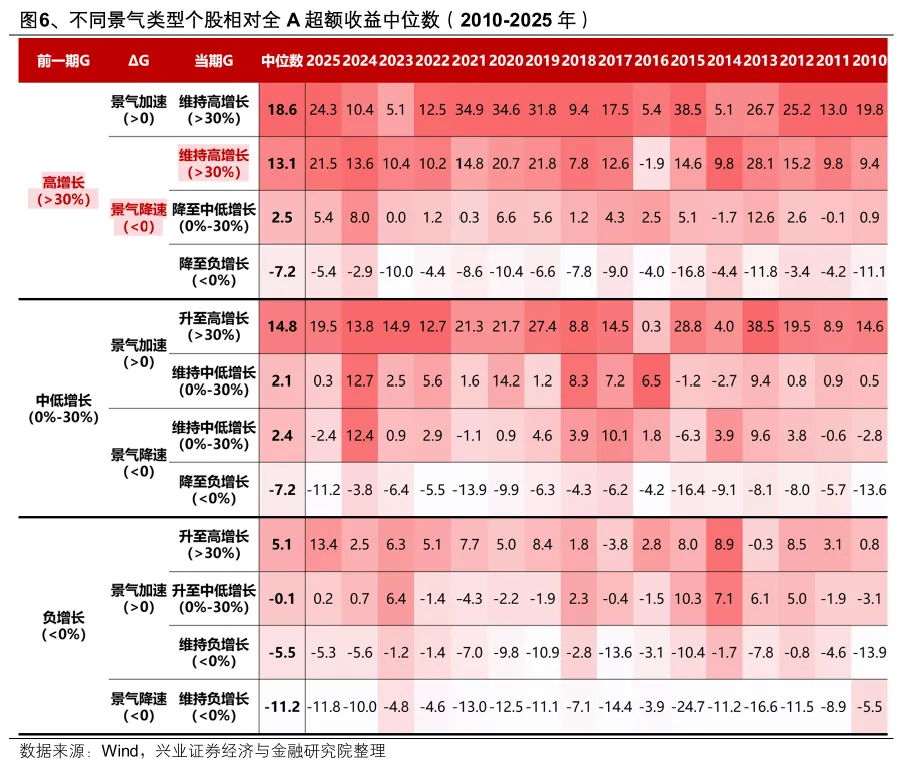
After clarifying the logic of how Capex growth and earnings growth affect stock prices, regarding Capex growth itself, during the current earnings lull, both Apple and Meta are essentially "narratives." The upcoming US earnings season is the real verification window. What key realities should we focus on going forward?
First, the earnings season will be an important window for upward revisions of Capex expectations. Pay attention to whether cloud companies' new Capex guidance can break the expectation that Capex growth will peak in 2026. According to historical experience, whenever listed companies disclose new guidance during earnings season, it is an important window for the market to revise Capex expectations upward. Based on current market consensus expectations, the third and fourth quarters of this year may be the peak of Capex growth. If the new guidance can break the expectation of a Capex growth peak, it will undoubtedly be another strong catalyst for core companies' stock prices.
Second, the market expects that the free cash flow of North American cloud companies will turn negative on a reported basis this year, thus questioning the sustainability of capital expenditure. But more importantly, whether future operating cash flow growth can support high capital expenditure. The earnings reports of several major core cloud companies in late July are key verification windows. As long as the growth in operating cash flow from cloud and AI business revenues exceeds the growth in capital expenditures, future free cash flow will also turn positive, corresponding to sustainable high capital expenditures. Since the beginning of this year, the forward revenue expectations for core North American cloud companies have been continuously revised upward. In late July, the four major core North American cloud companies will successively release earnings reports, which is a key window to verify whether AI business revenues can support their high capital expenditure growth.
Finally, in essence, changes in Capex are mainly determined by return on investment (ROI), which is currently linked to the ARR of leading large model companies. This data will become more transparent after Anthropic goes public, and is expected to continue to support the "spiral upward" of ROI and Capex. As long as computing power can still improve AI performance and the ROI on token generation remains considerable, leading large model companies will continue to increase capital investment. The indirect benefits obtained by cloud service providers as "computing power suppliers" are sufficient to support further increases in their capital expenditure.
In July, as China and the US enter earnings season, the relative strength of prosperity and the relative changes in earnings remain core investment clues.
For AI computing power and upstream resource products (especially AI-related materials such as nonferrous metals, chemicals, and fiberglass) that have strong market consensus on prosperity, after being significantly affected by overseas volatility earlier, as the domestic semi-annual report performance previews are released, they are expected to gradually enter a reallocation range. In the storage, optical fiber cable, liquid cooling, and electronic specialty gas sectors, several companies have disclosed impressive semi-annual report performance previews, confirming the high prosperity of the AI industry chain in Q2. Subsequent performance previews of core leading companies are expected to be even stronger catalysts.
Among them, for the North American computing power chain represented by optical communications and PCB, the previous computing power market "narrowed" to the storage industry chain, and recently experienced significant declines due to overseas influences. Currently, the price ratio between A-share North American computing power chain leaders and domestic computing power chain leaders has rapidly fallen back to the level of June last year. The configuration signal significance of this needs attention.
In addition, before the US earnings season arrives in mid-to-late July, the market may still seek some low-position, high-performing domestic industries for catch-up gains. Currently, these mainly include: the lithium battery industry chain, innovative drugs, brokerages, agrochemicals, refining, and broiler chickens, etc.
Source: Zhang Qiyao Team, Xingzheng Strategy
Risk Warning and Disclaimer
The market carries risks; investment should be made with caution. This article does not constitute personal investment advice, nor does it consider the specific investment objectives, financial situation, or needs of individual users. Users should consider whether any opinions, views, or conclusions in this article are suitable for their specific circumstances. Investment based on this information is at one's own risk.