Futures
Access hundreds of perpetual contracts
CFD
Gold
One platform for global traditional assets
Options
Hot
Trade European-style vanilla options
Unified Account
Maximize your capital efficiency
Demo Trading
Introduction to Futures Trading
Learn the basics of futures trading
Futures Events
Join events to earn rewards
Demo Trading
Use virtual funds to practice risk-free trading
Launch
CandyDrop
Collect candies to earn airdrops
Launchpool
Quick staking, earn potential new tokens
HODLer Airdrop
Hold GT and get massive airdrops for free
Pre-IPOs
Unlock full access to global stock IPOs
Alpha Points
Trade on-chain assets and earn airdrops
Futures Points
Earn futures points and claim airdrop rewards
Promotions
AI
Gate AI
Your all-in-one conversational AI partner
Gate AI Bot
Use Gate AI directly in your social App
GateClaw
Gate Blue Lobster, ready to go
Gate for AI Agent
AI infrastructure, Gate MCP, Skills, and CLI
Gate Skills Hub
10K+ Skills
From office tasks to trading, the all-in-one skill hub makes AI even more useful.
GateRouter
Smartly choose from 40+ AI models, with 0% extra fees
2100NEWS WEEKLY CRYPTO REPORT May-29
The crypto index NWST1100 fell 3.16% over the last week, extending the cooling phase that followed the earlier failed repair impulse. The key event of the week was a test of Pivot P near 4,819**. Over the past 30 days, Ethereum tokens represented by NWSET100 emerged as the strongest relative performer, posting a 3.81% gain.**
*Below, we present a standardized weekly report and next week’s outlook, prepared based on the Theory Swingtum of intelligent finance. We gauge the crypto market’s breadth and direction by showing the 2100NEWS Digital Assets Total Index (NWST1100), which measures the performance of 1100 (by market capitalization) significant crypto assets. The information-dense chart is initially complex to read, but it effectively displays essential price data, key decision-making levels, momentum, trading volume, and crypto market breadth. Monitoring Market Sentiment and Breadth is necessary to detect early signs of trend reversals or continued strength.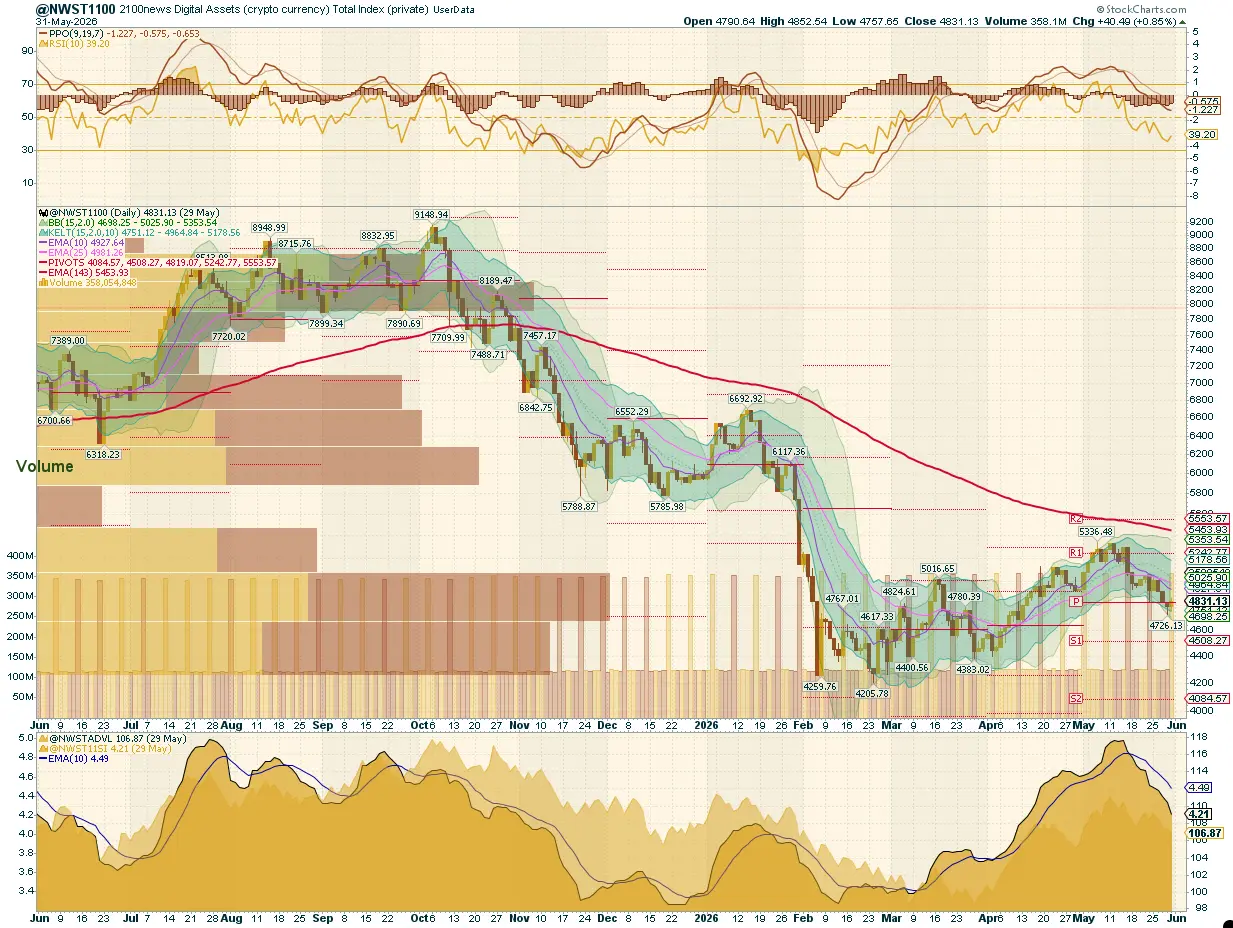
After conducting a detailed examination of the NWST1100 chart, a vital metric for the cryptocurrency market, several essential market dynamics and changes in market sentiment are revealed:
The NWST1100 index fell 3.16% over the last week, trading lower after the previous recovery structure had already lost momentum. The relevant weekly development was a move into the Pivot P support zone near 4,819. The index briefly undercut that level, with the weekly support probe extending toward the 4,726–4,770 area, before closing near 4,831. This means the market has not yet confirmed a full Breakdown regime. The close back above Pivot P shows that buyers were still active near the lower boundary. However, the index has remained below the short-term EMA cluster and below the previous lower-range support area around 4,925–5,000, so the earlier Repair impulse has not resumed. Structurally, the market remains in Cooling Consolidation, with the pivot area now acting as the main short-term decision zone. The broader recovery from the February low remains relevant, but the latest week shows the market has been operating under pressure: the upper end of the prior range has been lost, participation has narrowed, and the structure has become increasingly dependent on whether Pivot P holds.
Market Sentiment (PPO & RSI): Momentum has remained corrective during the week. PPO lines have remained below zero, meaning the market has entered a clearly negative momentum configuration. At the same time, the PPO histogram has stayed below zero, confirming that the negative half-cycle remains active. However, the latest histogram bars have not expanded aggressively lower and appear to be flattening, suggesting that downside momentum may be starting to decelerate rather than accelerate further. RSI has fallen toward 39–40, confirming weak momentum, but not yet capitulation.
Crypto Market Breadth indicators: remain constructive, pointing to consolidation with renewed internal support, rather than a confirmed transition into breadth deterioration. The Advance-Decline Volume Line (ADVL), adapted by 2100News for the crypto market as ADVPL, tracks the net money volume of advancing versus declining digital assets. It has moved lower, but should not be described as panic outflow. The McClellan Summation Index, a long-term breadth measure derived from the McClellan Oscillator, has continued to decline, confirming that participation momentum has weakened further.
A50R Participation: According to the chart on the right, all A50R indicators across the major segments (NWST1100, NWSET100, NWSL100, NWSCo100) remain weak, with readings roughly in the 23%–34% range, confirming that only about one quarter of assets are trading above their 50-day EMA. Participation has therefore moved far below the previous broad repair zone. However, the right edge shows a modest stabilization attempt, suggesting that breadth is no longer collapsing as quickly, even though it remains structurally weak. Large caps are holding up better, while coins and the Ethereum token segments have weakened more visibly. The Ethereum Tokens cohort, represented by NWSET100, remains the weakest segment.
This breadth indicator measures the percentage of digital assets trading above a 50-day moving average
* The percentage of digital assets trading above a specific moving average is a breadth indicator that measures internal strength or weakness in the underlying index. The chart on the right side compares the percentage of DA trading above the 50-day EMA for:
📉 Summary
The NWST1100 spent the week in Cooling Consolidation, with price testing Pivot P near 4,819 and closing slightly back above it. Momentum has remained negative, and RSI weakened toward the 39–40 area. Breadth deteriorated, led by a decline in the McClellan Summation Index, and the week reflected a stressed support test, not yet a confirmed breakdown.
Outlook for this week
This report examines the cryptocurrency market’s short-term outlook, identifying patterns and signals that may offer insights into potential market direction. While predicting market behavior is inherently uncertain, discernible trends in momentum and market breadth indicators suggest possible developments.
📌 Target and Scenario Considerations:
Most likely scenario:
The most likely scenario is therefore an extension of the decline below Pivot P, with a test of S1 near 4,600 as the primary downside target. If selling pressure accelerates, an intraday spike toward S2 near 4,350 cannot be excluded. Such a move would likely increase the likelihood of a sharp relief rally later this week or early next week. A sustained recovery cannot be assumed before capitulation is completed. The first confirmation of stabilization would be a failed downside extension, followed by a rebound. Until then, the market remains in a late-stage decline, with the highest-probability path still pointing lower before a relief rally develops.
📍 Key Levels to Watch:
Performance of different groups of Digital Assets (Coins and Tokens)
Investors and traders rely on historical performance data to contextualize short-term moves and assess the relative strength of different market segments. The latest table shows risk reduction across the market, with the NWST1100 index fell 3.16% over the past week.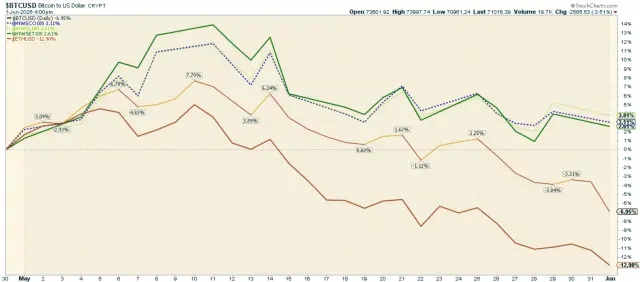 The chart above highlights the performance of various cryptocurrencies, including Bitcoin, Ether, and the 2100NEWS Indices, which represent Ethereum-based tokens (NWSET100), large caps (NWSL100), and Coins (NWSCo100). The market has rotated defensively: larger and more established segments held up better, while higher-beta groups absorbed the strongest selling pressure. Over the 30 days, however, half the groups remain positive. Ethereum tokens represented by NWSET100 emerged as the strongest relative performer, posting a 3.81% gain.
While the broader market has fallen, different segments and individual cryptocurrencies exhibit distinct performance dynamics.
Performance Trends by Market Segment:
✔ NWSCo100 (Coins) and NWSL100 (Large Caps) led**,**
✔ NWSET100 (Ethereum-based tokens) and Bitcoin were weakening.
✔ NWS30 and Ether were improving,
✔ NWSBE lagged.
Investors and traders might use this information to adjust their portfolios, possibly shifting focus toward assets with stronger relative momentum while being cautious about those in the Weakening quadrant.
*RRG® charts show the relative strength and momentum of groups of digital assets. Those with strong relative strength and momentum appear in the green Leading quadrant. As relative momentum fades, they typically move into the yellow Weakening quadrant. If relative strength then fades, they move into the red Lagging quadrant. Finally, when momentum picks up again, they shift into the blue Improving quadrant.
Crypto (Digital Assets) compared with global equity
This report offers a comprehensive analysis comparing the performance of digital assets, as measured by the NWST1100 index, to that of shares on global capital markets, as represented by the Dow Jones Global W1Dow index. The comparison spans multiple timeframes, providing insights into historical and recent performances and potential future trends.
Let’s break down the key observations and implications:
The recent pullback highlights a fundamental truth in crypto investing: market swings define opportunity. Historically, digital assets have significantly outperformed global equities, but their returns often occur in concentrated bursts following periods of pessimism and capitulation. Prices have fallen below the 143-day EMA and below the 600-day EMA, positioning the market at a technically and psychologically critical juncture. Relative to global equities, digital assets continue to trade at a deep underperformance. Looking ahead, sentiment-driven capitulations often create conditions for stronger rebounds, especially when paired with structural oversold signals. While caution remains warranted in the short term, current price levels could present compelling opportunities for disciplined investors preparing for the next leg in crypto’s broader market cycle.
*The box in the middle of the chart shows the original NWST1100 price; at the bottom is W1Dow