Futures
Access hundreds of perpetual contracts
CFD
Gold
One platform for global traditional assets
Options
Hot
Trade European-style vanilla options
Unified Account
Maximize your capital efficiency
Demo Trading
Introduction to Futures Trading
Learn the basics of futures trading
Futures Events
Join events to earn rewards
Demo Trading
Use virtual funds to practice risk-free trading
Launch
CandyDrop
Collect candies to earn airdrops
Launchpool
Quick staking, earn potential new tokens
HODLer Airdrop
Hold GT and get massive airdrops for free
Pre-IPOs
Unlock full access to global stock IPOs
Alpha Points
Trade on-chain assets and earn airdrops
Futures Points
Earn futures points and claim airdrop rewards
Promotions
AI
Gate AI
Your all-in-one conversational AI partner
Gate AI Bot
Use Gate AI directly in your social App
GateClaw
Gate Blue Lobster, ready to go
Gate for AI Agent
AI infrastructure, Gate MCP, Skills, and CLI
Gate Skills Hub
10K+ Skills
From office tasks to trading, the all-in-one skill hub makes AI even more useful.
GateRouter
Smartly choose from 40+ AI models, with 0% extra fees
Bitcoin breaks through the $80k watershed, HYPE trend reversal signals quietly emerge | Exclusive analysis
Bitcoin is currently standing at what I believe is the most critical price level in recent months. The $80,000 to $81,000 range is not just an ordinary technical resistance; it is the “ceiling” of this long-lasting oscillating market, and also the true fork that will determine the market’s next direction.
If you have been observing and waiting during this period, I think your patience is justified. This week is still not the time to chase longs. Whether the price can truly break above this level needs time to verify, and the risk of a “one-day wonder” false breakout still exists. Until the structure is confirmed, rushing into positions often costs more than the regret of missing out.
But I also don’t want to ignore another possibility: If Bitcoin can effectively break through and stabilize this time, then the months of oscillation may be coming to an end, and we will actively position for a bullish trend, riding the momentum.
Summary of core trading views for this week:
So, the key focus this week is on one question—Can Bitcoin truly break through $80,000 to $81,000?
Next, we will analyze step-by-step from daily to hourly levels.
1. Bitcoin Multi-Timeframe Trend Structure Analysis
1. Daily Chart Trend Structure Analysis: (Based on the market since the low on February 6, 2026)
Figure 1
As shown in (Figure 1), Bitcoin is currently at a critical price zone of $79,500 to $80,600 (marked as the purple area), which has become the market’s core “watershed.” Its resistance validity will directly determine the nature and subsequent direction of the rebound rally that started from the February 6 low of $60,000.
Below are two core path analyses:
First Path: Effective Breakout and Stabilization, Increasing Likelihood of Trend Reversal
Second Path: Failure to Break Through, Increasing Downside Risk
Summary: In short, this price zone is a market sentiment test. A break above opens bullish space; failure may mean a deep retracement. The outcome of the bulls versus bears here will guide the next phase of the market structure, serving as a key reference for potential structural shifts.
2. Hourly Chart Trend Structure Deep Dive: (Using 4-hour cycle for analysis)
Figure 2
As shown in (Figure 2), the daily rebound from the low of $65,000 on March 30 can be subdivided into nine segments: 18-19, 19-20, 20-21, 21-22, 22-23, 23-24, 24-25, 25-26, 26-27. Among these, the segments 23-24, 24-25, and 25-26 overlap, forming a “central zone C.” Currently, the market is operating away from the end of segment 26-27.
Because the central zone C is an upward consolidation, it is highly probable that the breakout at the end of segment 27 will push through the previous high of $79,485 and challenge $80,600.
2. Bitcoin Weekly Outlook and Trading Strategies
1. Weekly Market Outlook for BTC:
Main point: Expect this week the price may test the resistance near $80,600, focusing on whether it can effectively break through the key resistance zone of $79,500–$80,600. Despite easing geopolitical tensions providing short-term upward momentum, macro pressures and structural market contradictions suggest the market is more likely to oscillate widely within this range.
2. Key Resistance Levels:
3. Key Support Levels:
4. Trading Strategies for This Week (excluding unexpected news impacts):
① Mid-term Strategy:
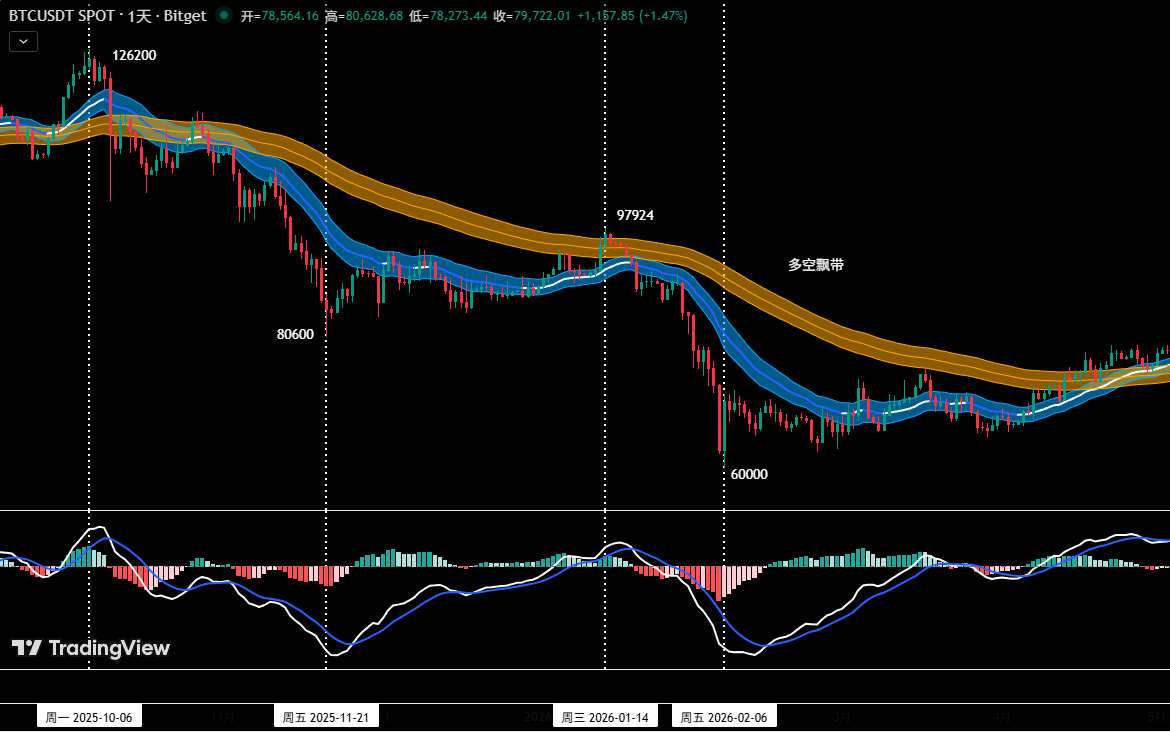
Figure 3
Position Monitoring Model: As shown in (Figure 3), based on trading rules, until Bitcoin effectively breaks above the long/short bands’ upper boundary and confirms validity, maintain a wait-and-see stance with no new long positions this week. We recommend waiting for a clear breakout before entering, avoiding chasing highs or panic selling.
② Short-term Strategy:
Use 30% of capital, set stop-loss points, and look for “spread” opportunities based on support and resistance levels (using 30-minute or 1-hour cycles).
③ A/B Operation Plans:
Currently, Bitcoin is approaching the core zone of $79,500–$80,600, with increased intra-day volatility. To adapt to the complex market evolution, prudent investors should abandon subjective guesses and rely on objective trend structure analysis and quantitative signals, preparing and strictly executing two specific plans:
Plan A: Breakout and Stabilization, Long on Pullbacks
Plan B: Breakdown and Rebound Shorting
After discussing Bitcoin, let’s talk about HYPE.
In my view, the current structure shows a classic trend reversal signal—momentum weakening, rebound strength diminishing. Of course, the trend is not yet definitive. If it can effectively break the previous high of $45.76, the upward trend is not over, and it will likely follow Bitcoin’s strength. After all, if BTC truly breaks above that level, market sentiment will be uplifted, and HYPE is unlikely to be immune.
But before confirmation of a breakout, my advice is: For those already holding positions, set your take-profit levels to protect profits; for those without positions, continue observing and avoid rushing in. Let the structure speak, then decide.
3. HYPE Trend Structure Deep Analysis
Figure 4
1. As shown in (Figure 1), since the high of $45.76 on April 16, a correction has been underway. On the 4-hour chart, this correction can be subdivided into four segments: 31-32, 32-33, 33-34, 34-35. The segments 32-33, 33-34, and 34-35 overlap, forming a “downward central zone.” Currently, the market is operating in segment 34-35.
2. On the 4-hour chart, HYPE’s current trend shows a classic reversal signal. Specifically, during the correction phase (endpoint 32), the price broke below the previous low (endpoint 30, $40.17), and the subsequent rebound (endpoint 33) failed to make a new high (not surpassing endpoint 31, $45.76). This forms a “correction breaking below prior low, rebound not making new high” potential reversal structure. Therefore, the daily upward trend from the April 2 low of $34.44 is likely ending at the previous high of $45.76. The current market is in a daily correction phase. If the price breaks below the key support near $38, it will further confirm this conclusion. Only if the price can break above and stabilize above the $45.76 high will the bearish structure be invalidated, and the trend may reverse.
4. HYPE Weekly Outlook and Short-term Trading Strategies
1. Weekly Outlook for HYPE:
Focus on whether the ongoing segment 34-35 can effectively break through the previous high of $45.76.
2. Short-term Trading Strategies for HYPE:
4. HYPE Operation Review (04.27–05.03)
Market validation of last week’s trading strategy and core views:
1. Short-term operation review: (see Table 1)
Table 1
2. Short-term trade recap: (see Figure 5)
Figure 5
5. Special Reminders:
The financial markets are ever-changing; all analysis and trading strategies should be adjusted dynamically. All viewpoints, models, and strategies discussed are based on personal technical analysis only, for personal trading logs, and do not constitute investment advice or operational guidance. Markets carry risks; please trade cautiously and do not base decisions solely on this information.