Futures
Access hundreds of perpetual contracts
TradFi
Gold
One platform for global traditional assets
Options
Hot
Trade European-style vanilla options
Unified Account
Maximize your capital efficiency
Demo Trading
Introduction to Futures Trading
Learn the basics of futures trading
Futures Events
Join events to earn rewards
Demo Trading
Use virtual funds to practice risk-free trading
Launch
CandyDrop
Collect candies to earn airdrops
Launchpool
Quick staking, earn potential new tokens
HODLer Airdrop
Hold GT and get massive airdrops for free
Pre-IPOs
Unlock full access to global stock IPOs
Alpha Points
Trade on-chain assets and earn airdrops
Futures Points
Earn futures points and claim airdrop rewards
Promotions
AI
Gate AI
Your all-in-one conversational AI partner
Gate AI Bot
Use Gate AI directly in your social App
GateClaw
Gate Blue Lobster, ready to go
Gate for AI Agent
AI infrastructure, Gate MCP, Skills, and CLI
Gate Skills Hub
10K+ Skills
From office tasks to trading, the all-in-one skill hub makes AI even more useful.
GateRouter
Smartly choose from 30+ AI models, with 0% extra fees
BTC higher-level support has been broken—an alert signal is here! 76800 has become the key resistance pressure, and the intraday pullback window has opened.
Current Price: 76802.60
First, the conclusion: BTC’s short-term trend has shifted from range-bound movement to a slightly bearish structure. This belongs to the “pullback stage after a failed push higher.” Intraday, it is more likely to range lower rather than continue attempting to push up.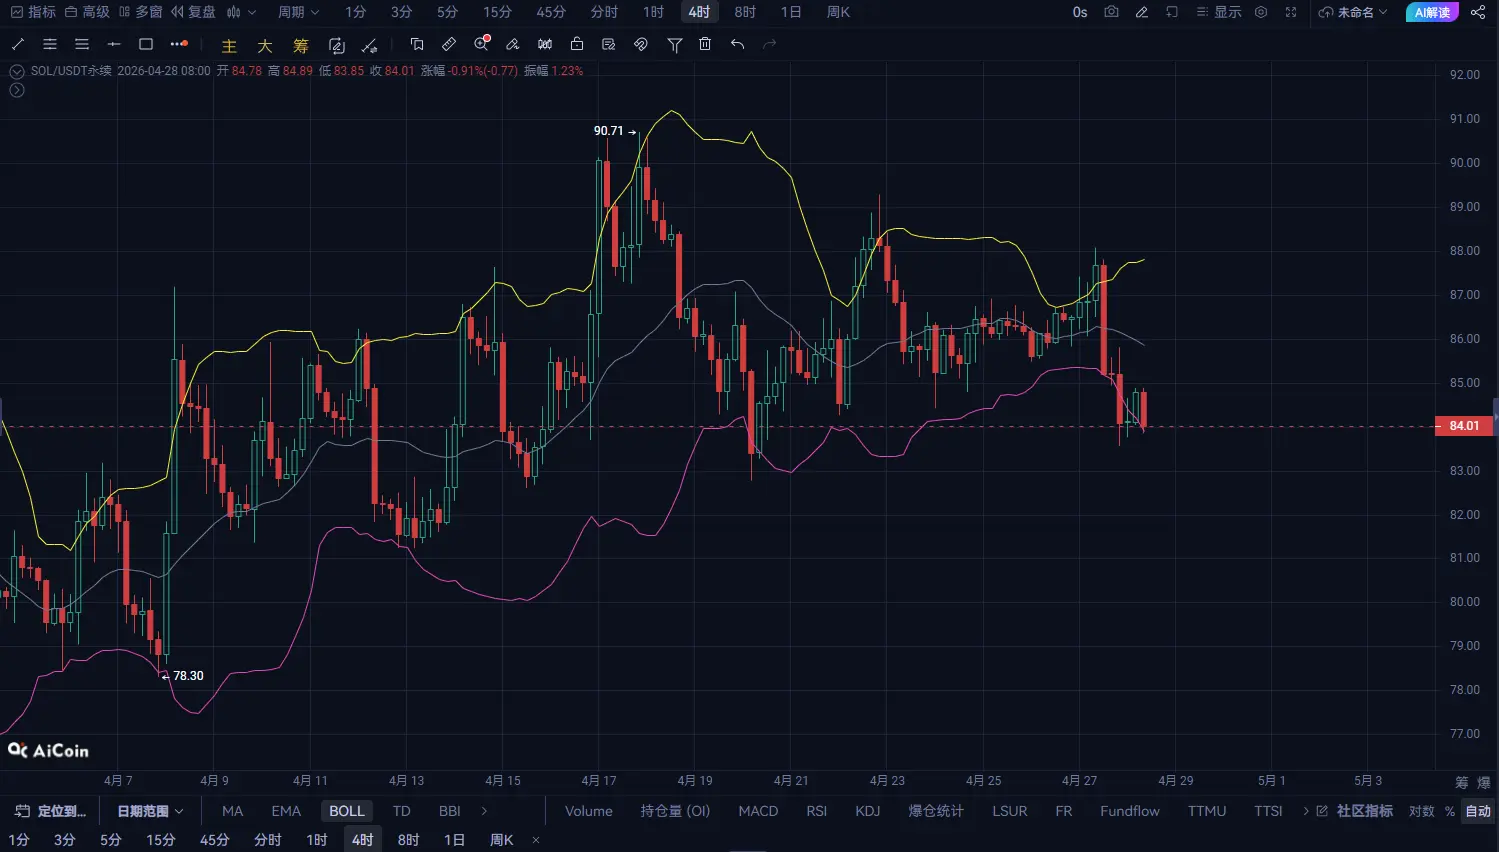
1. 4-hour timeframe: Failed to push higher, structure weakens
The 78000 area above has been struck multiple times without success
The highs gradually keep getting lower, forming a suppression structure
MACD shows clear signs of a bearish cross from high levels (dead cross)
The Bollinger Bands are starting to contract, and price has fallen below the middle band
Core judgment: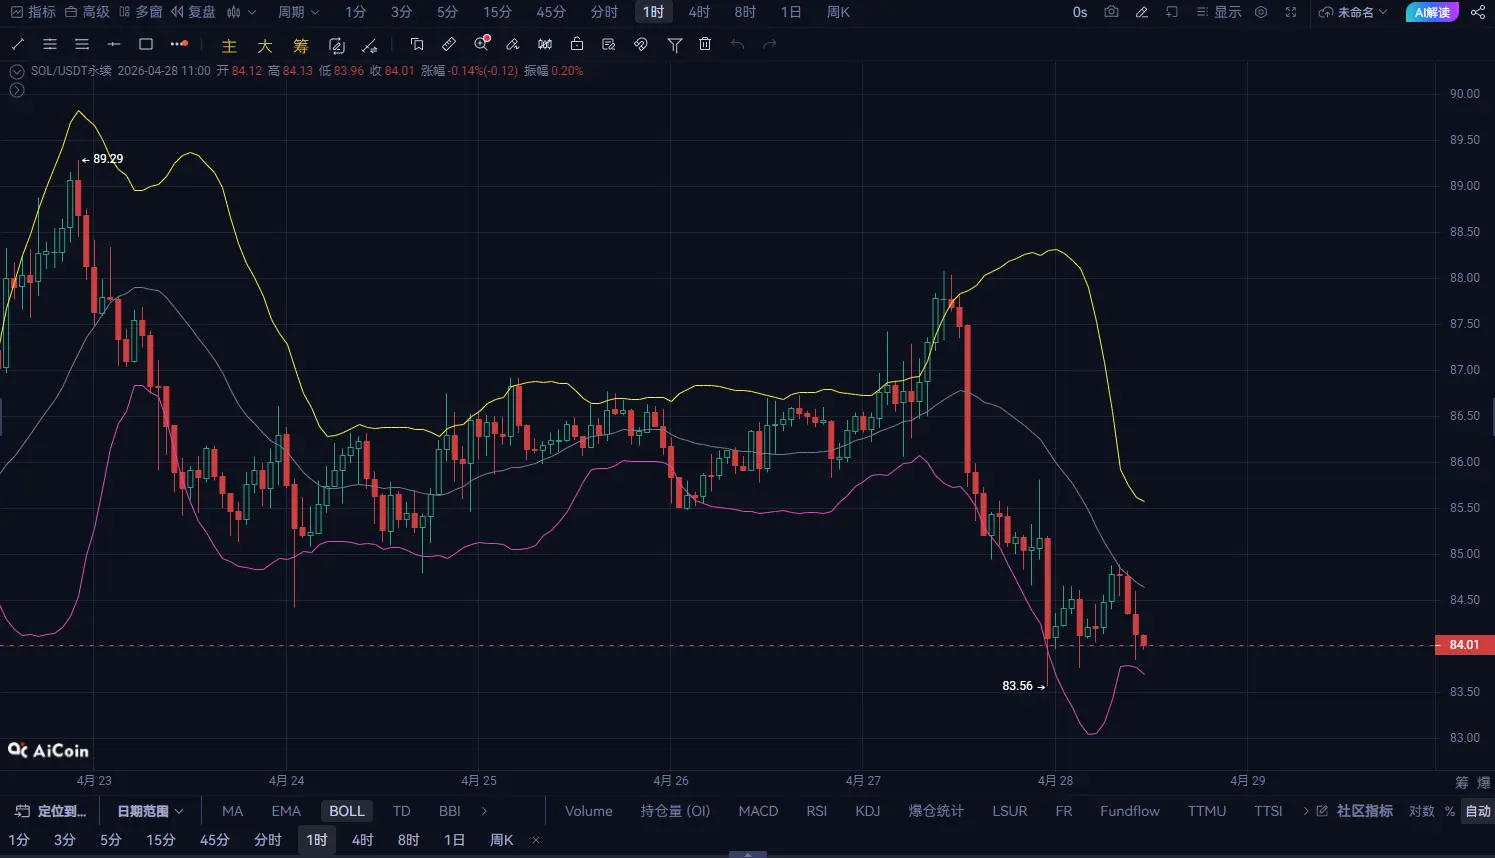
The 4-hour chart has shifted from strength to a range-bound, bearish bias.
2. 1-hour timeframe: Bearish momentum starts to form
A “push higher → pullback → failed rebound” structure appears
Multiple rebounds are capped by resistance above 77000
Moving averages turn downward, and price is trading below the moving averages
Bearish MACD momentum is gradually building in volume
Short-term rhythm:
Weak rebound + step-like pullback
3. Intraday price projection
If it cannot regain and hold above 77000–77200:
Intraday is more likely to see a pullback within the range
First, test support around 76000
If it breaks, it may extend to the 75000 area
4. Direct trading strategy (provided as requested)
Direction: Short (open with a market order)
Entry price: Around 76800
Take profit:
First take profit: 76032 (-1%)
Second take profit: 75264 (-2%)
Stop loss:
Stop loss level: 77952 (+1.5%)