Futures
Access hundreds of perpetual contracts
TradFi
Gold
One platform for global traditional assets
Options
Hot
Trade European-style vanilla options
Unified Account
Maximize your capital efficiency
Demo Trading
Introduction to Futures Trading
Learn the basics of futures trading
Futures Events
Join events to earn rewards
Demo Trading
Use virtual funds to practice risk-free trading
Launch
CandyDrop
Collect candies to earn airdrops
Launchpool
Quick staking, earn potential new tokens
HODLer Airdrop
Hold GT and get massive airdrops for free
Pre-IPOs
Unlock full access to global stock IPOs
Alpha Points
Trade on-chain assets and earn airdrops
Futures Points
Earn futures points and claim airdrop rewards
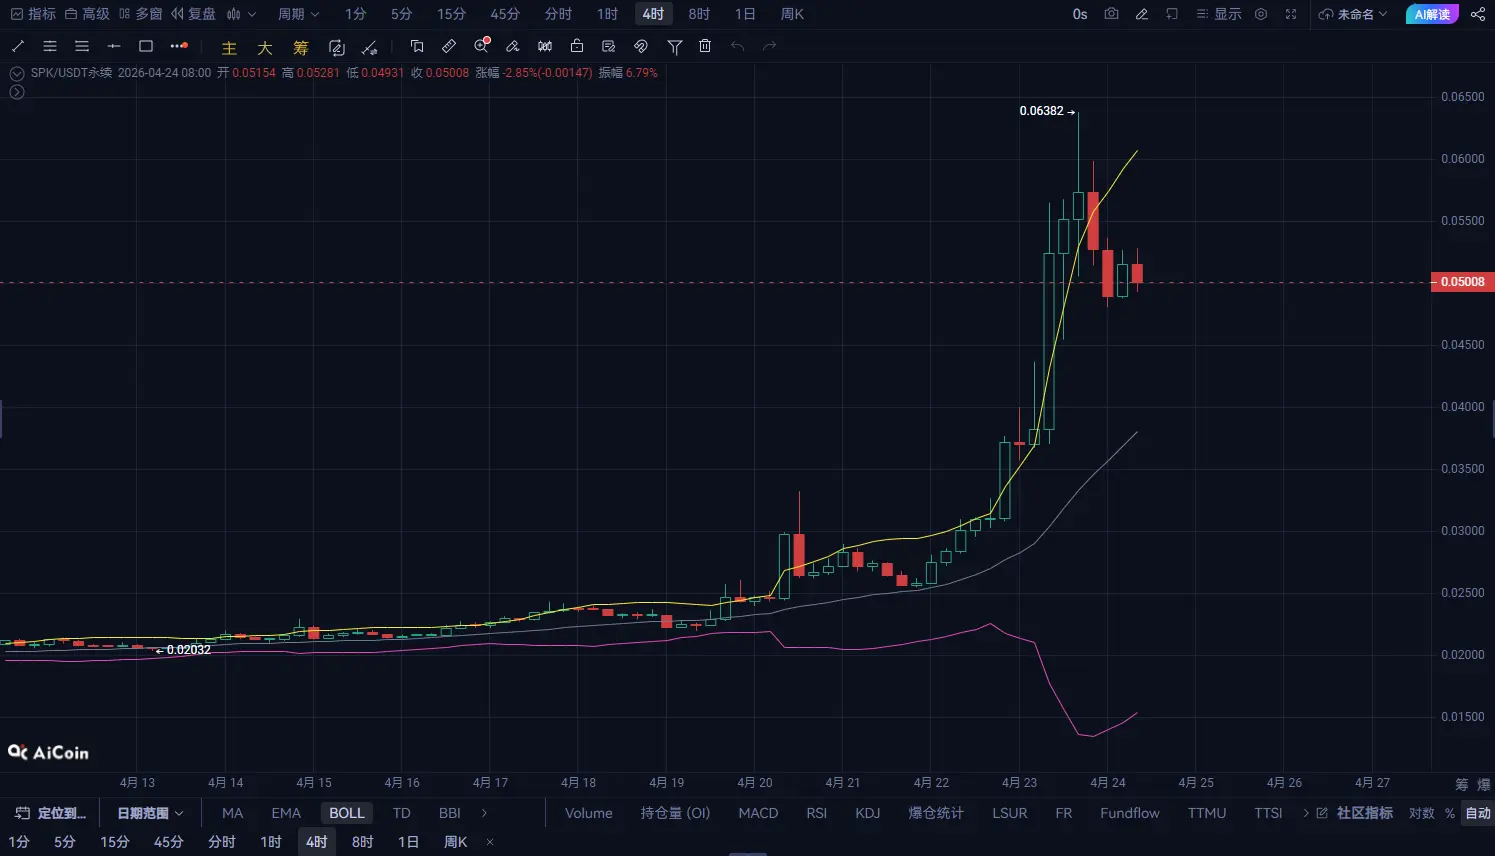
SPK Bearish Signal Formed! Above 0.50 indicates false strength, and the intraday downside space has opened.
Current Price: 0.501
Straightforward conclusion: SPK’s current structure is biased bearish, continuing the downward trend after a weak rebound, with a higher probability of oscillating downward within the day rather than reversing upward.
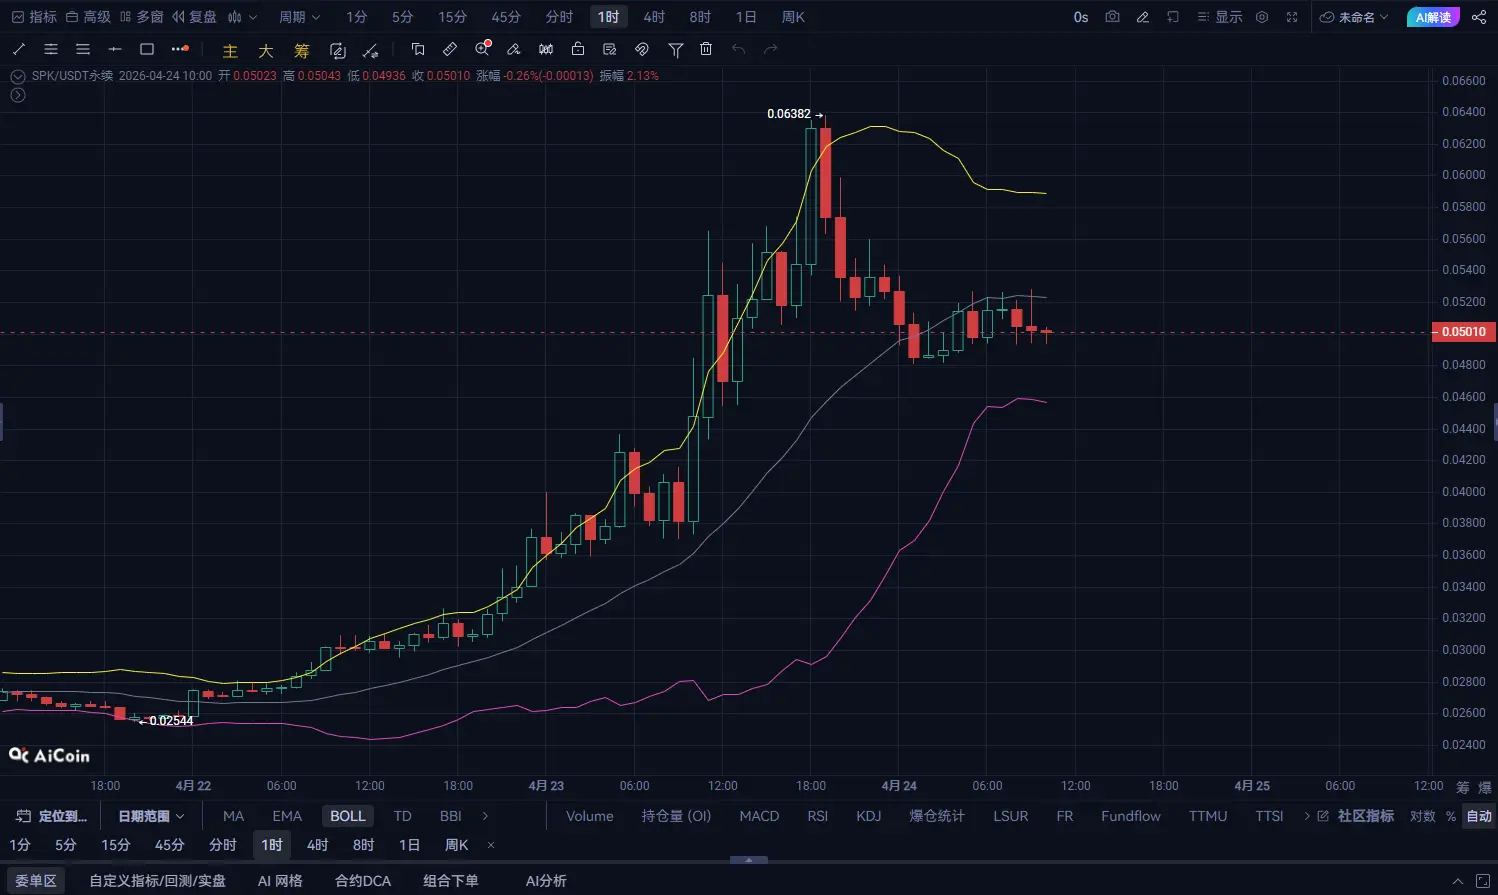
Limited rebound strength after previous decline, no new highs
High points gradually decline, forming a resistance structure
MACD shows a death cross below the zero line twice
Bollinger Bands opening downward, price trading below the middle band
Core judgment:
The 4-hour chart indicates a weakening after the rebound, with a clear bearish trend
Continuous pattern of “decline → weak rebound → decline again”
Moving averages are arranged in a bearish alignment (MA20 clearly suppressing)
Rebound with low volume, insufficient support
MACD continues to expand in the bearish zone
Short-term rhythm:
A bearish decline pattern has formed, with continuation potential
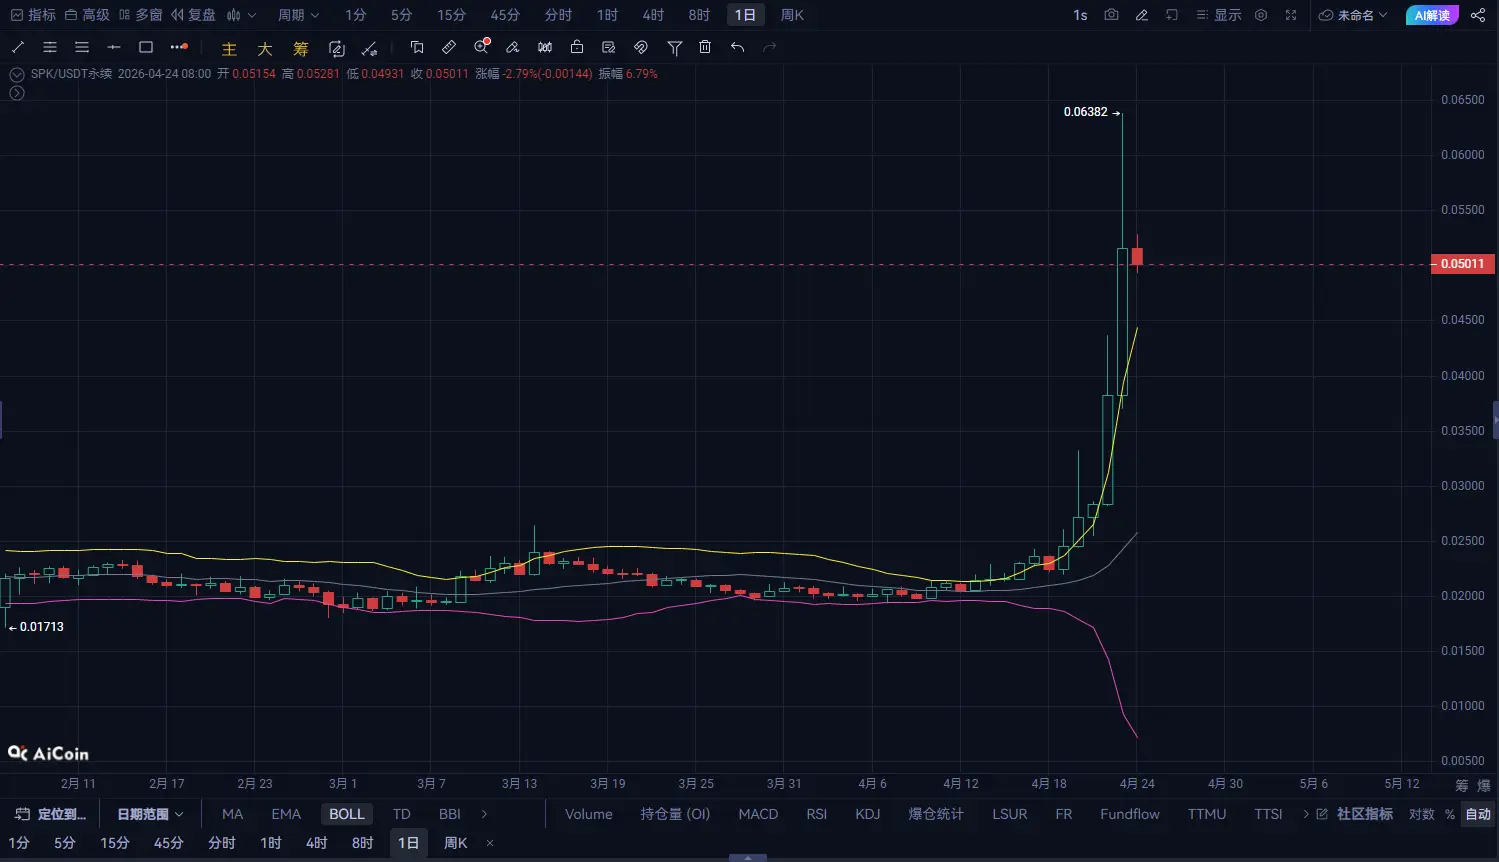
Before a strong volume breakout above 0.508:
Likely to maintain oscillating downward movement
There may be some rebounds along the way, but they are unlikely to sustain
The price will gradually test 0.495 or even lower
Direction: Short (market order to open)
Entry Price: around 0.501
Take Profit:
First TP: 0.496
Second TP: 0.491
Stop Loss:
Stop Loss Level: 0.508