Futures
Access hundreds of perpetual contracts
TradFi
Gold
One platform for global traditional assets
Options
Hot
Trade European-style vanilla options
Unified Account
Maximize your capital efficiency
Demo Trading
Introduction to Futures Trading
Learn the basics of futures trading
Futures Events
Join events to earn rewards
Demo Trading
Use virtual funds to practice risk-free trading
Launch
CandyDrop
Collect candies to earn airdrops
Launchpool
Quick staking, earn potential new tokens
HODLer Airdrop
Hold GT and get massive airdrops for free
Pre-IPOs
Unlock full access to global stock IPOs
Alpha Points
Trade on-chain assets and earn airdrops
Futures Points
Earn futures points and claim airdrop rewards
Is BTC's high-level fluctuation hiding danger? A full analysis of the bullish and bearish battle signals on April 19!
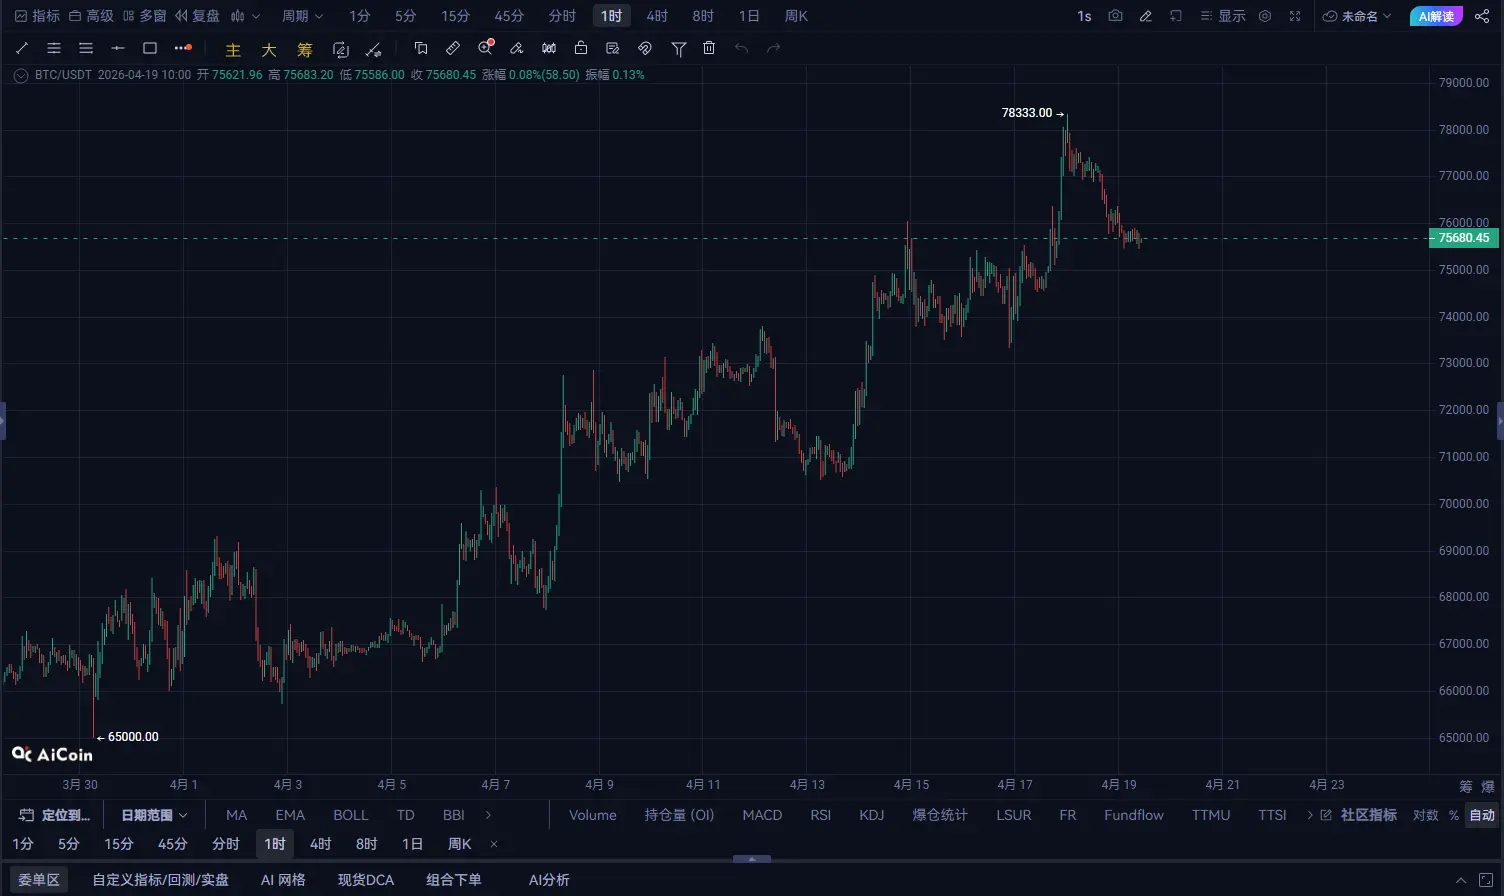
Current Price: 75,680.45
From the overall structure, BTC is in a typical high-level consolidation zone, market sentiment appears calm on the surface, but internal battles are intensifying. Next, we will analyze from the daily, 4-hour, and 1-hour timeframes.
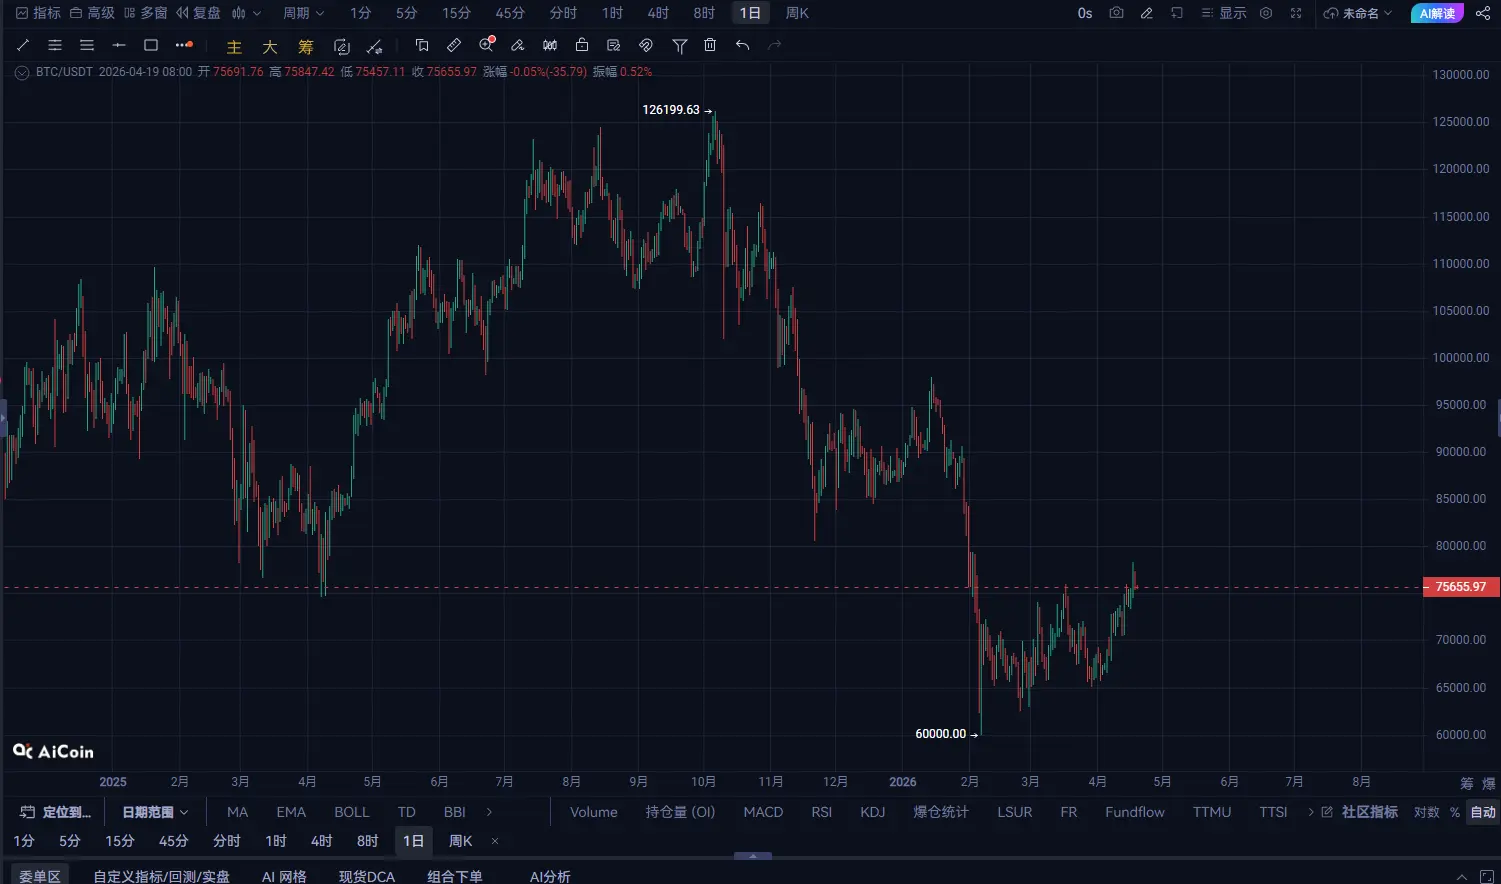
The daily structure still remains within an upward trend channel, the overall bullish pattern has not been broken, but several key points need attention:
The candlesticks continuously close with small bodies, indicating weakening bullish momentum
MACD shows early signs of divergence, with red bars gradually shortening
RSI is in a high-level oscillation zone (60-70), with no further expansion
Key support: 73,000
Key resistance: 78,000
This means the daily level is currently “building momentum to choose a direction.” Once volume breaks through 78,000, a new trend could begin; but if it falls below 73,000, a mid-term correction may be underway.
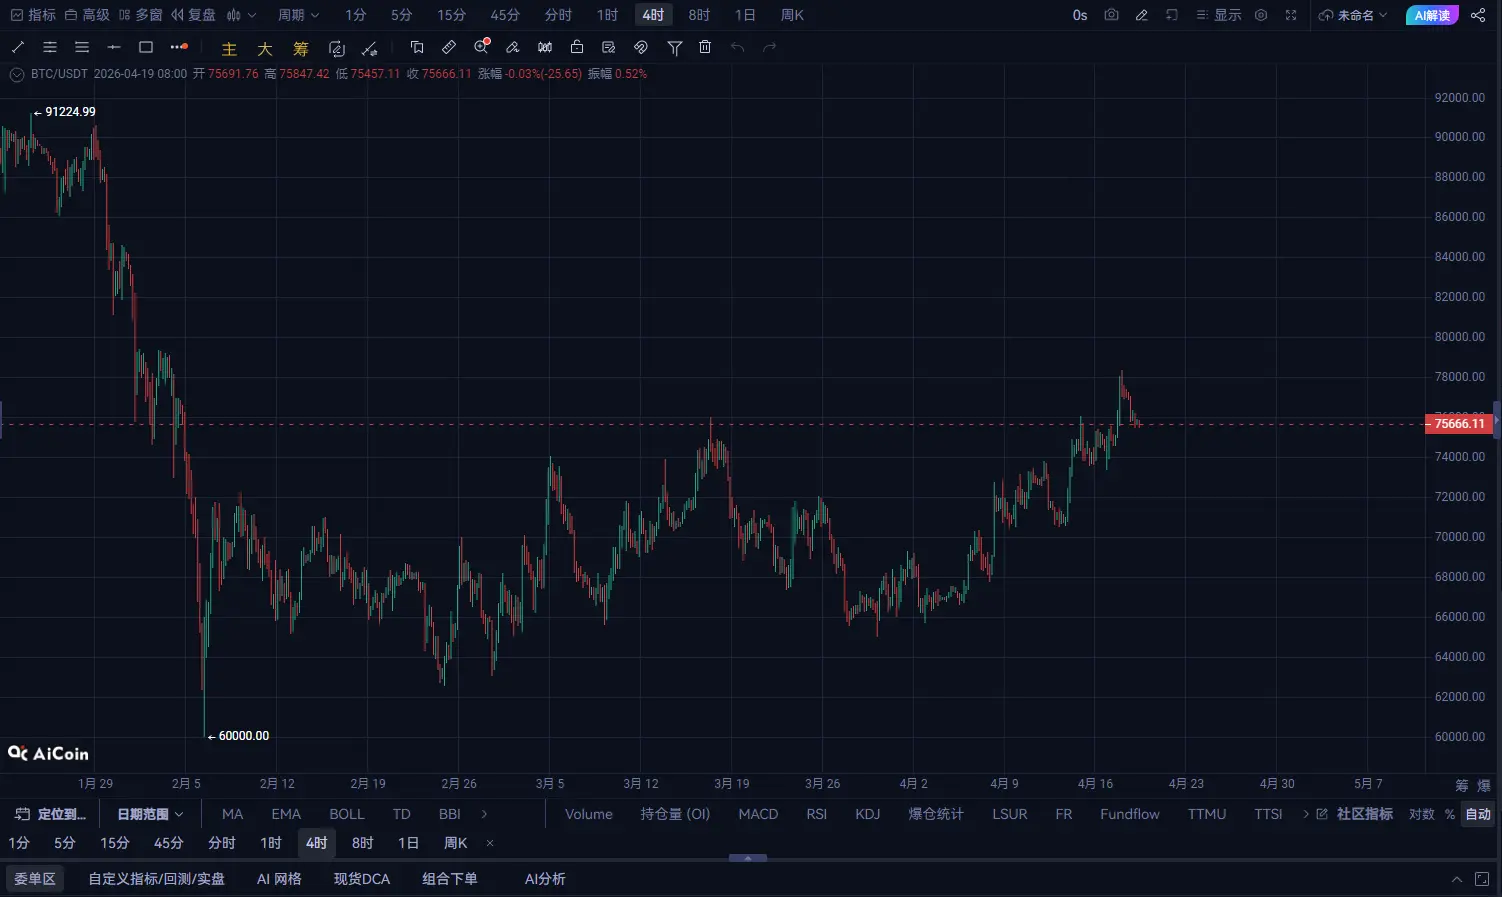
The 4-hour timeframe is very typical — a standard box structure:
Upper boundary: 77,000-78,000
Lower boundary: 74,000-74,500
Technical signals:
Bollinger Bands are narrowing, volatility is compressing, indicating an imminent breakout
MACD is oscillating around the zero line, with no clear winner between bulls and bears
Volume is gradually shrinking, a typical “power accumulation phase”
The key point here is: the direction is about to be chosen, but no answer has been given yet.
Trading-wise, it’s not suitable to chase highs or sell lows; instead, wait for a confirmed breakout.
The 1-hour timeframe has already started showing subtle changes:
Price has broken below short-term moving averages (MA20/MA60)
Rebound with no volume, indicating insufficient bullish support
MACD has entered the bearish zone and is increasing in volume
The short-term structure has shifted from “strong oscillation” to “weak consolidation.”
Key short-term levels:
Support: 74,800
Resistance: 76,500
As long as the rebound cannot stabilize above 76,500, the short-term bias remains bearish.
Currently, BTC is in:
Daily: Bullish trend not broken
4-hour: Oscillating, awaiting a breakout
1-hour: Short-term weakening
This is a very typical “high-level divergence structure.”
The market is waiting for a trigger point (possibly news or capital flow).
Trading Suggestions (Core Focus)
Short-term strategy (high-frequency traders)
Rebound near 76,500-77,000 can attempt light short positions
Stop-loss: above 78,000
Target: 74,500 / 73,500
Logic: Weakness persists on the 1-hour level
Mid-term strategy (trend traders)
Do not chase highs
Wait for two confirmations:
① Volume breakout above 78,000 → go long with the trend
② Break below 73,000 → switch to short with the trend
Risk Control
Currently in the “pre-direction choice” phase, the most taboo is:
Over-leveraging on one side
Frequent chasing in oscillating zones