Futures
Access hundreds of perpetual contracts
TradFi
Gold
One platform for global traditional assets
Options
Hot
Trade European-style vanilla options
Unified Account
Maximize your capital efficiency
Demo Trading
Introduction to Futures Trading
Learn the basics of futures trading
Futures Events
Join events to earn rewards
Demo Trading
Use virtual funds to practice risk-free trading
Launch
CandyDrop
Collect candies to earn airdrops
Launchpool
Quick staking, earn potential new tokens
HODLer Airdrop
Hold GT and get massive airdrops for free
Pre-IPOs
Unlock full access to global stock IPOs
Alpha Points
Trade on-chain assets and earn airdrops
Futures Points
Earn futures points and claim airdrop rewards
After breaking through the 90 mark, SOL is consolidating and fluctuating. Is it preparing to welcome the next wave of gains?
Current Price: 89.98
From this candlestick chart, SOL’s recent performance has been quite strong. After breaking through the previous high, it has entered a period of consolidation and range-bound trading. The current price is consolidating between 89 and 90, but there is still a lot of uncertainty in the market. The key question is—
Where is the next breakout point, and will a pullback become a new opportunity to enter?
Below, we analyze SOL’s price action across three timeframes: the daily chart, the four-hour chart, and the one-hour chart.
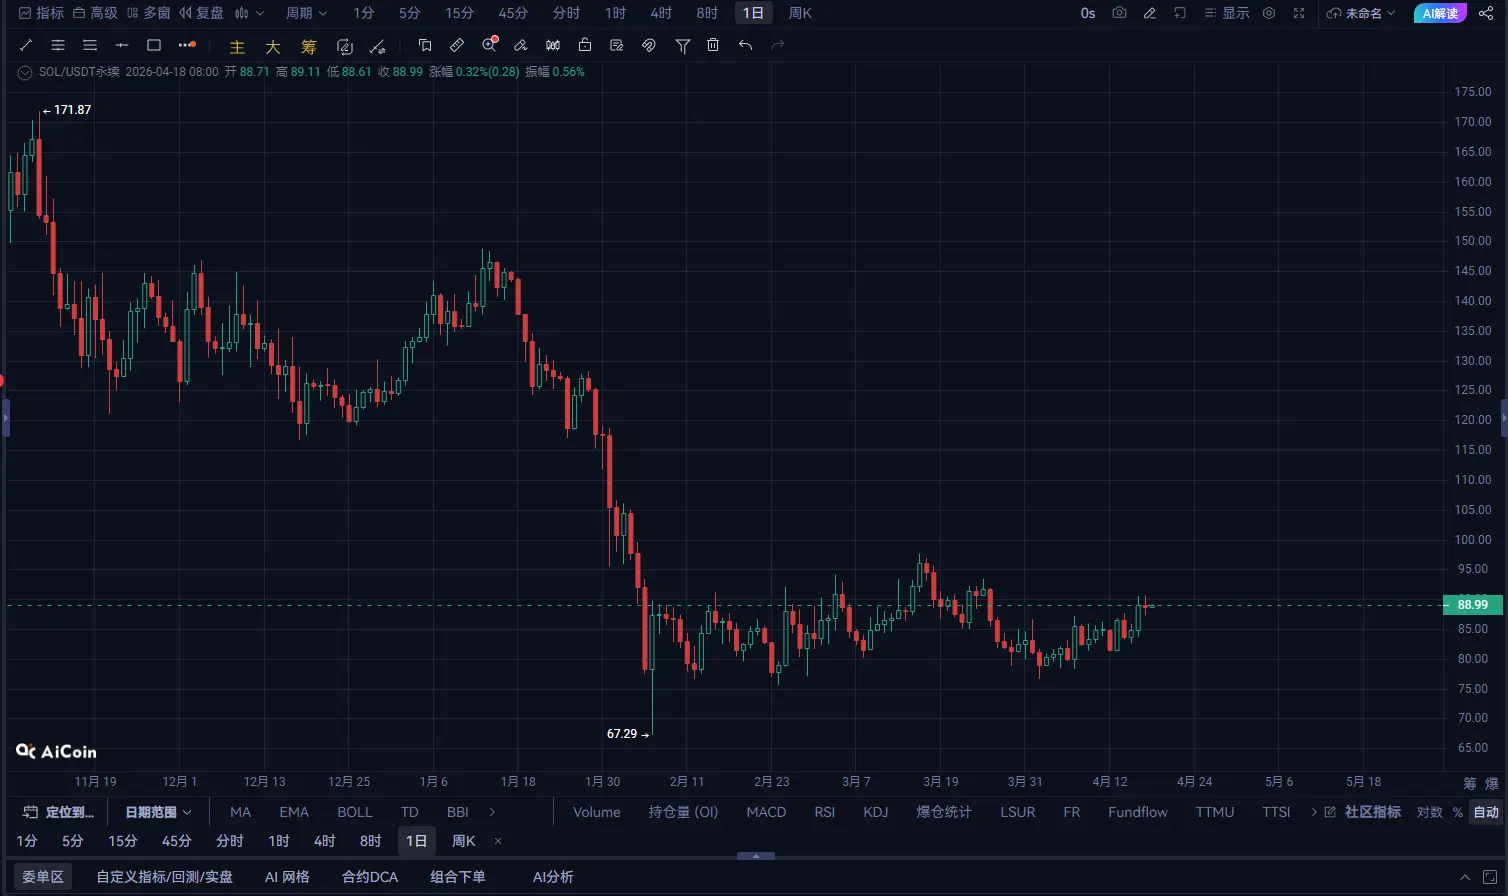
The daily structure shows SOL’s strength:
The low at 81.23 has formed a bottom support Then the price broke through key resistance zones such as 85 and 90, and gradually moved higher The current price is approaching the previous high of 90.71, forming a clear resistance zone
This implies:
👉 The uptrend has not changed, but since the current price is close to the resistance level, the market sentiment needs more confirmation 👉 In the short term, it may enter a consolidation phase; after breaking 90.71, it could bring new upward momentum
Key levels:
Support: 86.50 / 85.00 Resistance: 90.71 / 92.00 Daily conclusion: Trend: The bulls have not been broken; strong upward movement Status: Consolidating and waiting for a breakout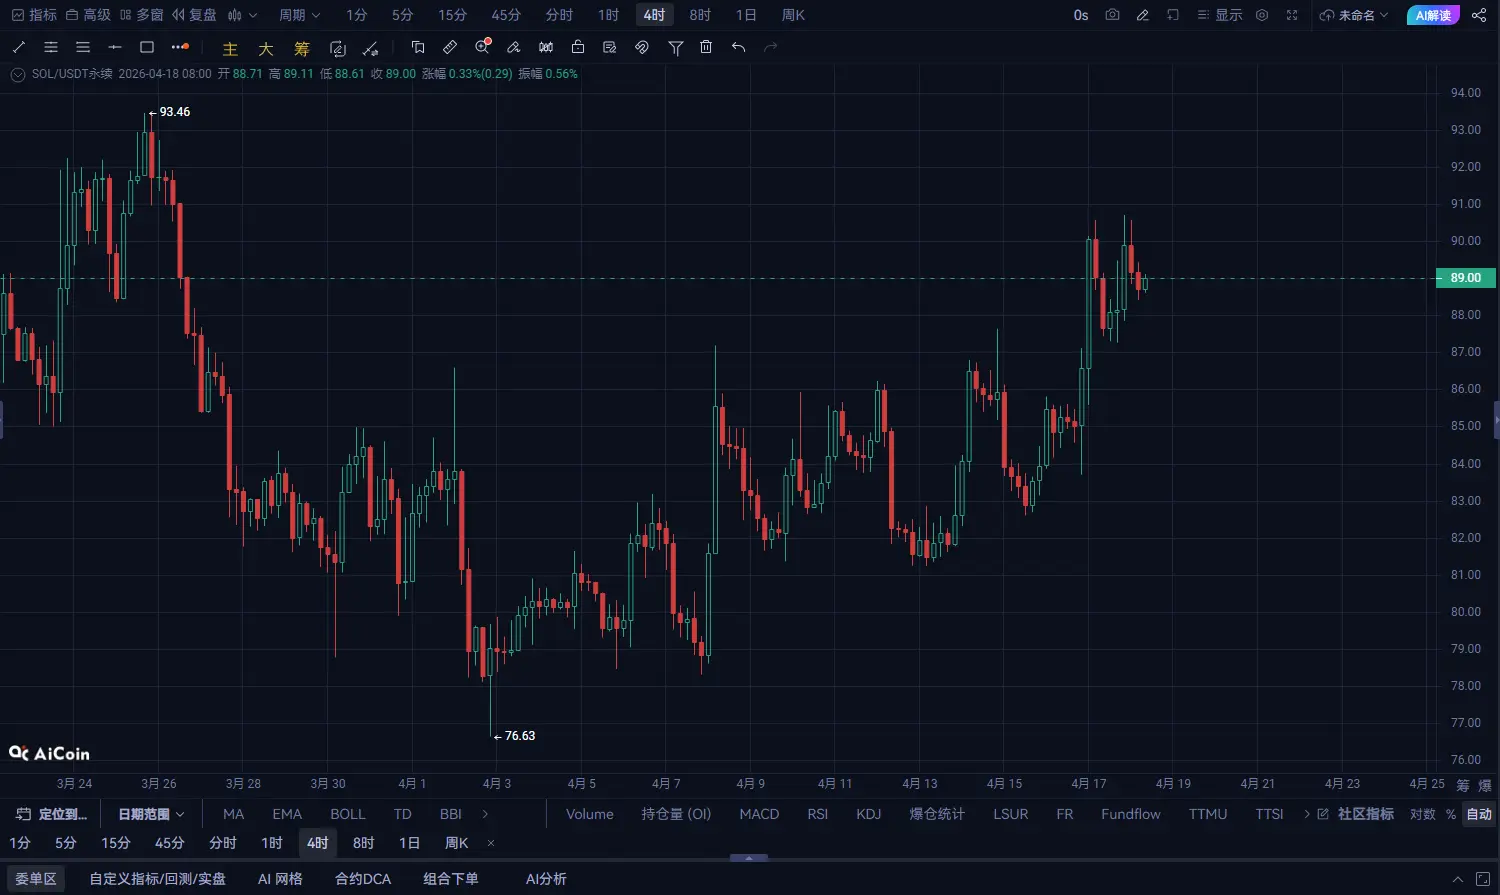 2. Four-hour timeframe: Consolidation and range-bound trading—after a breakout, a new wave of upside may follow
The four-hour chart shows that SOL is currently consolidating around 90, and has not been able to break out effectively in the short term:
After breaking above 90, the price formed a consolidation pattern, with volatility shrinking In the short term, the price has failed to break 90.71, and market sentiment shows some signs of settling into a range At present, support is around 86.50–87.00, and overall price action still remains within the bullish range
This indicates:
👉 In the short term, market sentiment is relatively cautious, but the overall upward trend remains intact 👉 Price may keep oscillating, and after a breakout it could bring new upward targets
Key levels:
Support: 87.00 / 86.50 Resistance: 90.71 / 92.00 Four-hour conclusion: Trend: Consolidation; breakout needs confirmation Status: Waiting for the price to break 90.71 to confirm upward momentum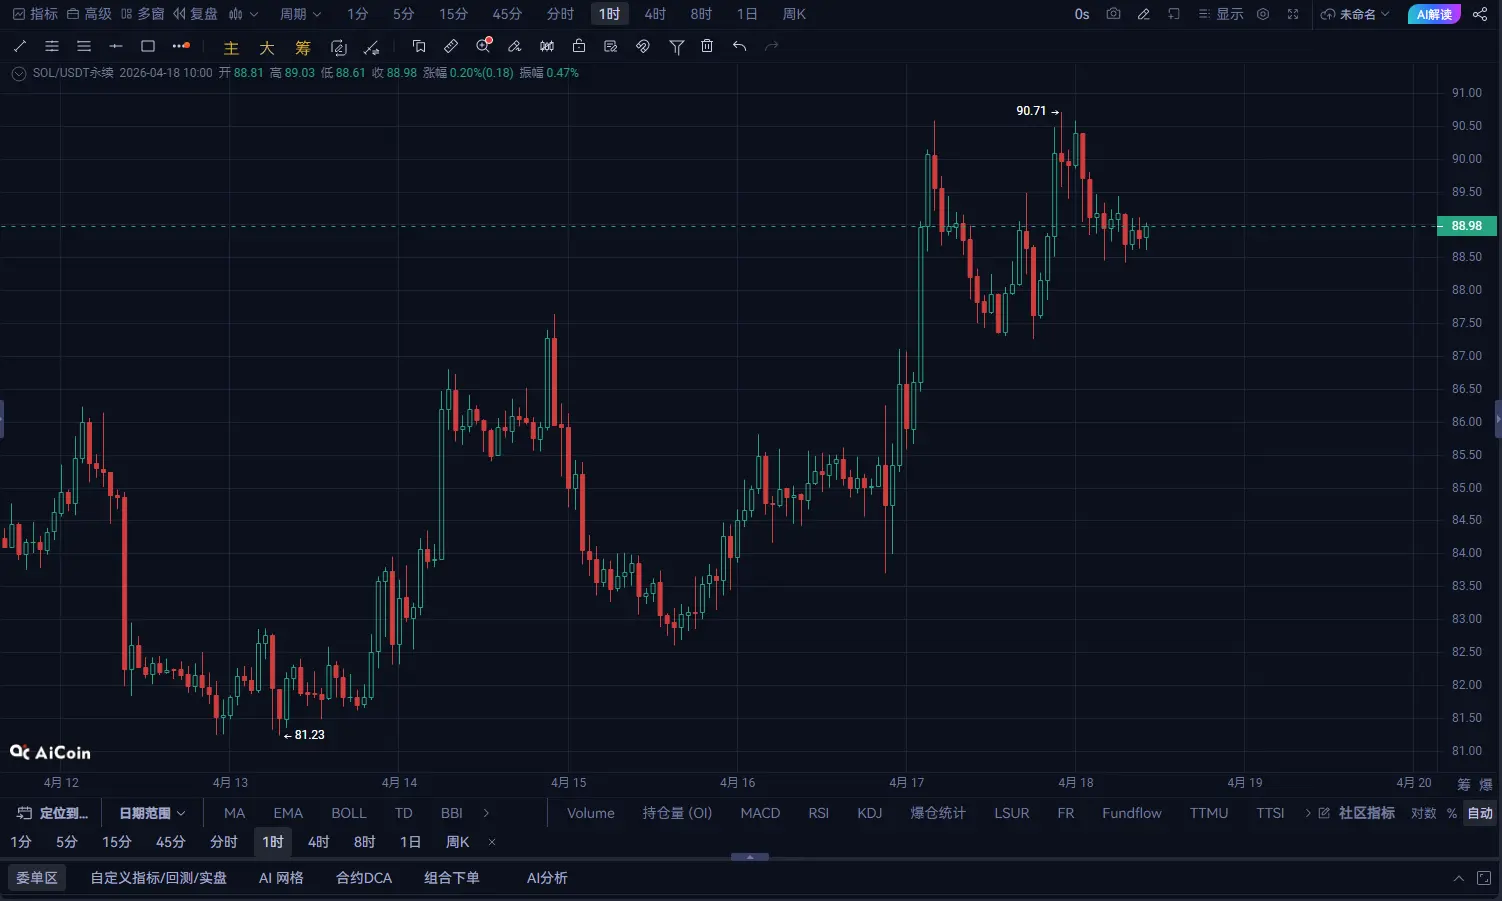 3. One-hour timeframe: Short-term consolidation—this is the critical moment for a breakout
The one-hour chart further refines the short-term outlook:
The current price is consolidating in the 88.50–90 range. Since it has not broken 90.71, short-term volatility is relatively high Multiple attempts to rally followed by pullbacks show that there is significant disagreement in the market around 90 At the moment, market sentiment is steady but lacks a clear direction. More breakout signals are needed to confirm the future direction
This means:
👉 Short-term volatility is high, and market sentiment could change at any time 👉 If the price breaks 90.71, it may continue higher; otherwise, it could pull back to test support
Key levels:
Support: 88.50 / 87.50 Resistance: 90.71 / 92.00 One-hour conclusion: Trend: Consolidation; short-term direction is unclear Status: Waiting for a breakout. After the breakout is confirmed, price could continue higher 4. Overall assessment (core analysis)
SOL’s overall trend remains strong, but it is currently in a consolidation phase. After breaking 90.71, it may bring a new opportunity for an upward move. The targets could be 92 and even higher levels. However, if it cannot break out in the short term, the likelihood of a pullback to test support is high.
Stop-loss:
Stop out if it breaks below 86.50 2️⃣ Short position strategy (short-term consolidation) If the price does not break 90.71, short near 90, with targets around 87.50 and even 85
Stop-loss:
Stop out above 92
Target:
87.50 → 85 3️⃣ Risk control points Do not enter and exit frequently around 90; wait until the breakout is confirmed before trading Control your position size to avoid chasing pumps and selling into dumps 6. Risk reminder
The current market is in a consolidation phase. After breaking 90.71, it may bring a new upward move, but the risk of a short-term pullback still remains. Investors should patiently wait for breakout signals and look for dip entries within the key support range.