Futures
Access hundreds of perpetual contracts
TradFi
Gold
One platform for global traditional assets
Options
Hot
Trade European-style vanilla options
Unified Account
Maximize your capital efficiency
Demo Trading
Introduction to Futures Trading
Learn the basics of futures trading
Futures Events
Join events to earn rewards
Demo Trading
Use virtual funds to practice risk-free trading
Launch
CandyDrop
Collect candies to earn airdrops
Launchpool
Quick staking, earn potential new tokens
HODLer Airdrop
Hold GT and get massive airdrops for free
Pre-IPOs
Unlock full access to global stock IPOs
Alpha Points
Trade on-chain assets and earn airdrops
Futures Points
Earn futures points and claim airdrop rewards
ORDI surges 300% overnight: Is this just the beginning of the main upward wave, or have we already entered the harvest countdown?
Current Price: 8.943 Peak of the Stage: 10.76
This K-line doesn’t require complex indicators; the essence is clear at a glance:
👉 Extreme capital-driven market + full-blown emotional ignition
But the real key isn’t “how much it has risen,” but:
Can it still be done now?
Below, we’ll directly break down the three major cycles to give you the most core judgment.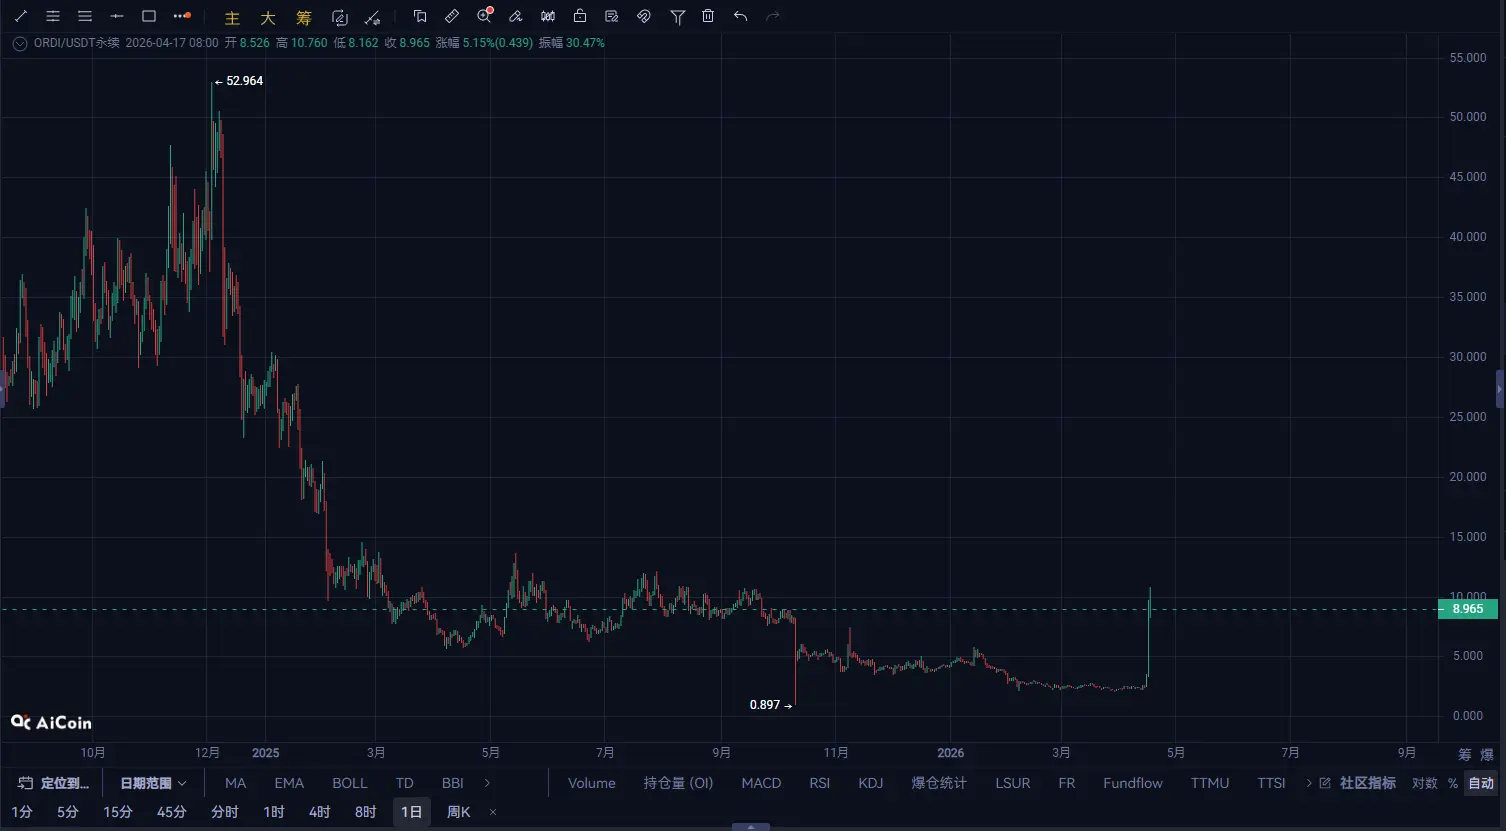
The daily structure is very classic:
Long period of sideways movement (between 2.0 - 2.5) Almost no volatility or attention Sudden start → consecutive large bullish candles rally
This is typical of:
👉 Main force completing accumulation → directly launching the main upward wave
But note:
The current increase has exceeded 3 times Far from the main force’s cost zone First obvious long upper shadow appears (10.76) Daily conclusion: Trend: Extremely strong bullish State: Mid to late main upward wave (risk zone)
Key levels:
Support: 7.5 / 6.0 Resistance: 10.8 / 12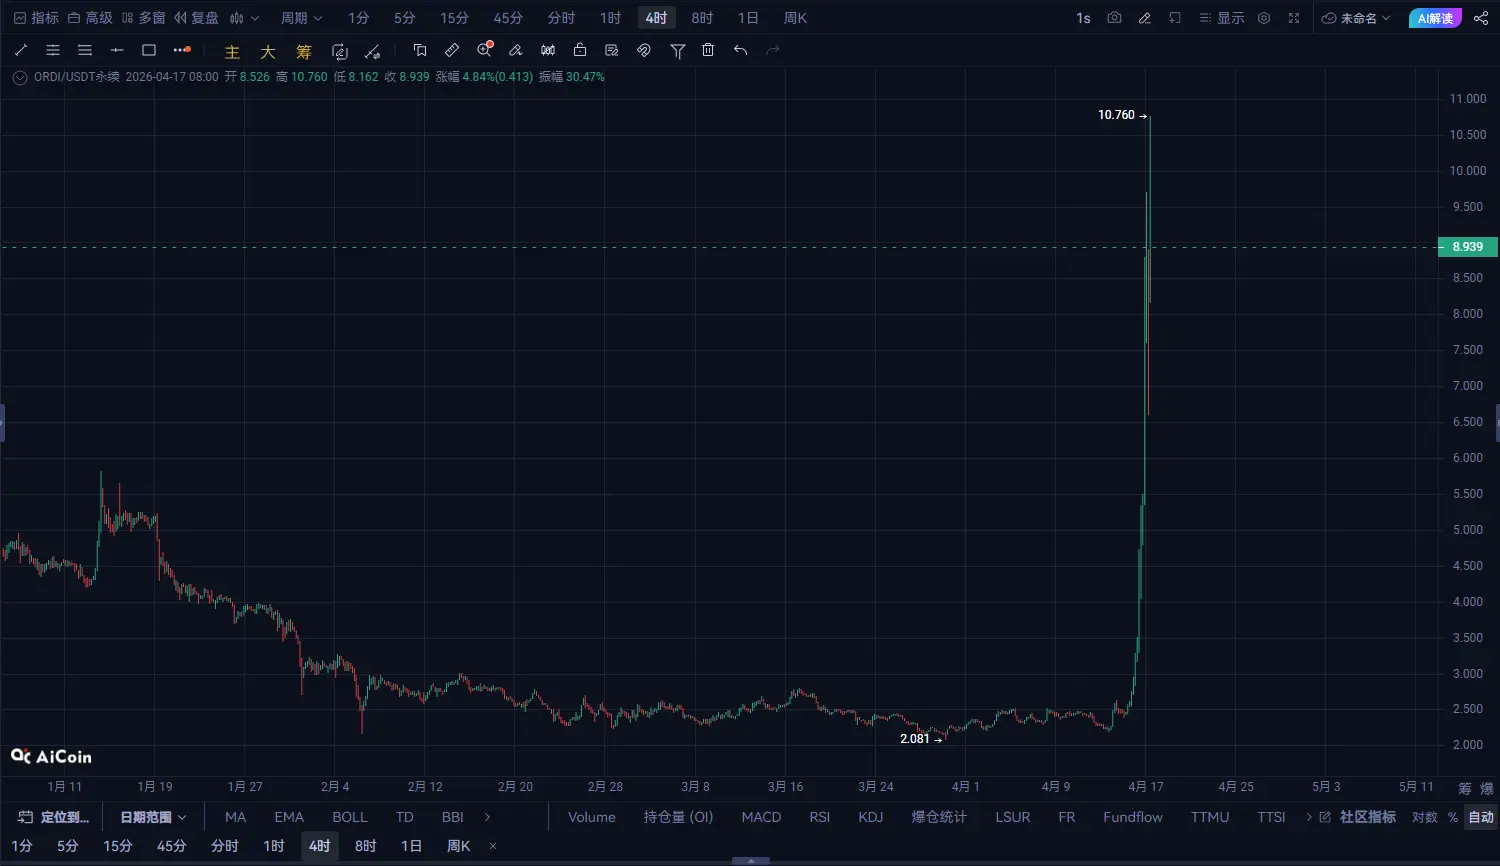 2. Four-hour level: Accelerating to the top, divergence begins to appear
The four-hour chart is critical:
You can see:
Almost vertical rise No proper correction Top shows a large pullback + long upper shadow
These signals combined only mean one thing:
👉 Capital is starting to diverge
In other words:
Main force is no longer just pushing Starting to “push and exit” simultaneously Four-hour conclusion:
👉 Has entered a “battle zone” rather than a one-sided upward zone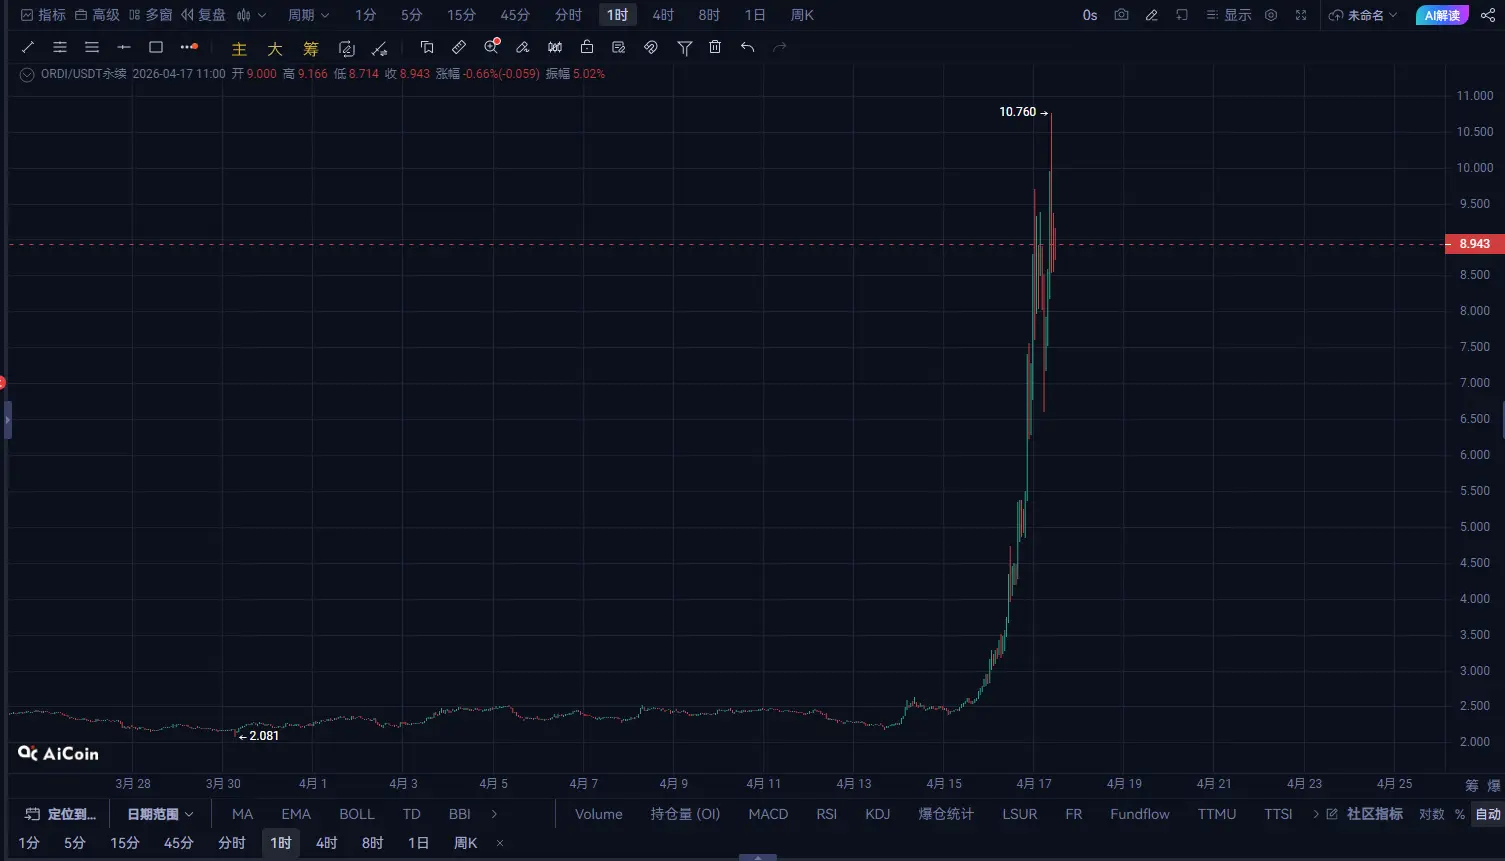
Short-term cycle is very critical:
Frequent switch between large bullish and large bearish candles Extremely long upper and lower shadows Volatility is greatly amplified
What does this indicate?
👉 Chips are rapidly changing hands
It also means:
👉 The market is shifting from a “trend market” to a “gambling market”
Key zone on the one-hour chart: Resistance: 10.5 - 11 Support: 8.0 - 7.5 4. Core logic (the most important point)
ORDI is currently not an ordinary rally, but:
👉 Emotion-driven explosive market
This type of market has three fixed stages:
1️⃣ Dormant (no one cares) 2️⃣ Explosive (rapid rise) 3️⃣ Collapse (relay at high levels)
Your current position:
👉 Near the end of stage 2 → the night before stage 3
✔ The only correct action:
👉 Partial profit-taking
Suggestions:
Start reducing positions around 9 Continue reducing positions around 10
❗ Don’t expect to sell at the highest
Direct conclusion:
❌ Not recommended to chase
If you must trade:
Wait until:
Retest and stabilize at 7.5 or Break through 10.8 with volume
Otherwise:
👉 All risk
Conditions:
Obvious stagnation around 10.5 Continuous long upper shadows
You can:
👉 Light position try shorting
Stop-loss:
Above 11
Target:
8.5 → 7.5 6. Risk warning (very important)
The biggest risk of this structure is:
👉 Waterfall-like retracement
Reason:
Lack of genuine transaction support Rapid rally Once funds retreat, liquidity breaks down 7. Final conclusion
ORDI is not now an “opportunity zone,” but:
👉 A realization zone + high-risk gambling zone