Futures
Access hundreds of perpetual contracts
TradFi
Gold
One platform for global traditional assets
Options
Hot
Trade European-style vanilla options
Unified Account
Maximize your capital efficiency
Demo Trading
Introduction to Futures Trading
Learn the basics of futures trading
Futures Events
Join events to earn rewards
Demo Trading
Use virtual funds to practice risk-free trading
Launch
CandyDrop
Collect candies to earn airdrops
Launchpool
Quick staking, earn potential new tokens
HODLer Airdrop
Hold GT and get massive airdrops for free
Launchpad
Be early to the next big token project
Alpha Points
Trade on-chain assets and earn airdrops
Futures Points
Earn futures points and claim airdrop rewards
More
Bitcoin faces short-term volatility but remains bearish in the medium term. HYPE presents another good opportunity for long positions | Exclusive analysis
Last week, Bitcoin continued its range-bound trading pattern, which closely matched our earlier expectations.
This week, we will focus on two main themes: first, HYPE’s Wave IV correction has nearly met both time and space targets. The daily bottom formation continues to strengthen, and our quantitative model has also triggered a bottom warning. This week, we will focus on capturing long entry opportunities; second, Bitcoin’s medium-term bearish trend remains unchanged. We will maintain our range-bound trading view this week, and will flexibly execute two short-term A/B trading plan setups based on support and resistance levels and model signals.
Weekly Trading Core Viewpoint Summary:
• HYPE multi-timeframe price action structure analysis. (See the first section for details)
• HYPE this week’s market outlook and short-term trading strategy. (See the second section for details)
• BTC multi-timeframe price action structure interpretation. (See the third section for details)
• BTC this week’s market outlook and medium- and short-term trading strategies. (See the fourth and fifth sections for details)
Last Week—Core Viewpoint Market Verification:
• BTC short-term trade performance: Bitcoin completed one short-term short position trade last week (1x leverage), successfully achieving a return of about 2.45%. (See Table 1)
• BTC medium-term trade performance verification: Bitcoin followed the predetermined swing strategy last week. It continued holding the short position opened at 89,000 USD (1x leverage). As of last week’s close (about 69,031 USD), it was up about 22.43%, with the maximum unrealized profit reaching about 32.58%.
• BTC market outlook verification: In last week’s article, we stated: the market will maintain a range-bound trading structure. The current market action validates our prior outlook.
I. HYPE: Price Action Structure Analysis
1. Breakdown of HYPE’s daily timeframe structure: (Based on how the market evolved after January 21)
HYPE_ daily candlestick chart
Figure 1
As shown in (Figure 1):
• Wave I (impulse wave): from the January 21 low of 20.46 USD to the February 3 high of 38.41 USD. It lasted 14 days, with a maximum rise of 87.73% during the period.
• • Wave II (correction wave): from the February 3 high of 38.41 USD to the February 24 low of 25.60 USD. It lasted 20 days, with a maximum decline of 33.35% during the period.
• • Wave III (motive wave): from the February 24 low of 25.60 USD to the March 18 high of 43.78 USD. It lasted 23 days, with a maximum rise of 71.02% during the period.
• Wave IV (correction wave): from the March 18 high of 43.78 USD to now. It has been running for 18 days, with a maximum decline of 21.33% during the period.
2. Deep decomposition of HYPE’s current price action structure (using a 4-hour analysis cycle)
HYPE_ 4-hour candlestick chart
Figure 2
• Based on how the price action evolved after the March 18 high of 43.78 USD, the Wave IV correction can be divided into stages.
• As shown in (Figure 2), Wave IV can be further broken down into a complex correction structure consisting of 9 segments: between endpoint 19 and endpoint 28, there are 19-20, 20-21, 21-22, 22-23, 23-24, 24-25, 25-26, 26-27, and 27-28.
• Central zone A: within the 5-segment structure of 20-21, 21-22, 22-23, 23-24, and 24-25, they overlap each other, forming a declining central zone (i.e., Central zone A).
• Currently, the market is running segment 28-29. The chart shows that the key momentum divergence signal has appeared: compared with the entering segment (19-20) and exiting segment (25-26), and also compared with the 25-26 segment and the 27-28 segment, the downward momentum is attenuating. This suggests that the Wave IV correction has very likely ended around endpoint 28.
• From the price spread trading model we built, bottom warning signals were triggered at endpoint 26 and endpoint 28 respectively (red dots, white dots in the chart).
II. HYPE: This week’s market outlook and short-term trading strategy
1. HYPE’s market outlook for this week:
• From the daily timeframe, the Wave IV correction that started from the March 18 high of 43.78 USD has lasted 19 days. Referring to how the earlier Wave II correction lasted about 20 days, this correction may be near its end.
• From the 4-hour cycle analysis, the probability that the Wave IV correction ends near endpoint 28 is high.
• This week’s market outlook: From a technical analysis perspective, HYPE’s Wave IV correction has basically reached its time and price targets in both dimensions. In addition, the daily “bottom fractal” stop-loss formation built from the April 1 low is continuously strengthening, together with bottom warning signals triggered by the quantitative model. Therefore, this week we will focus on HYPE’s adjustment-end signals and capturing entry opportunities.
2. HYPE’s short-term trading strategy this week:
• Based on our outlook for the overall uptrend, we should follow the strategy of “trade with the trend, buy on pullbacks.”
• Using our self-built quantitative model signals, with 30-minute/60-minute cycles as the trading period, and utilizing a 30% position size, we will capture long entry opportunities.
• Opening strategy: The market is currently moving in an upward range. If this week’s price can break above the 38 USD key resistance and then pull back to confirm support and hold above 34.47 USD (the April 2 low), (the farther the pullback distance is from that low, the better), it may form a right-side buy opportunity with a relatively high degree of certainty.
III. Bitcoin: Price Action Structure Interpretation
1. BTC daily timeframe structure analysis: (Based on how the market evolved after February 6)
• The uptrend that began from around a 60,000 USD low on February 6 can still be defined, in terms of wave structure, as an oversold rebound of Wave C-2 within the correction of a higher-degree Wave C. If the subsequent rebound cannot break above around 76,000 USD on March 17, the probability of a Wave C-3 decline afterward will be relatively high.
• Key observation points for structural evolution:
The current rebound cycle is continuously extending. We need to watch whether the subsequent rebound can break above the high on March 17. If it succeeds, this rebound may upgrade into a more complex Wave D rebound (with a level equivalent to Wave C). After that, it may follow a Wave E correction.
• Core conditions for trend confirmation:
The key signal that ultimately determines the start of a Wave C-3 (or Wave E) correction is when price effectively breaks below the support of the prior low around 60,000 USD from February 6. Before that, the market remains in a contest phase between rebound and trend shift.
2. Deep analysis of BTC’s current price action structure: (using a 4-hour analysis cycle)
Bitcoin _ 4-hour candlestick chart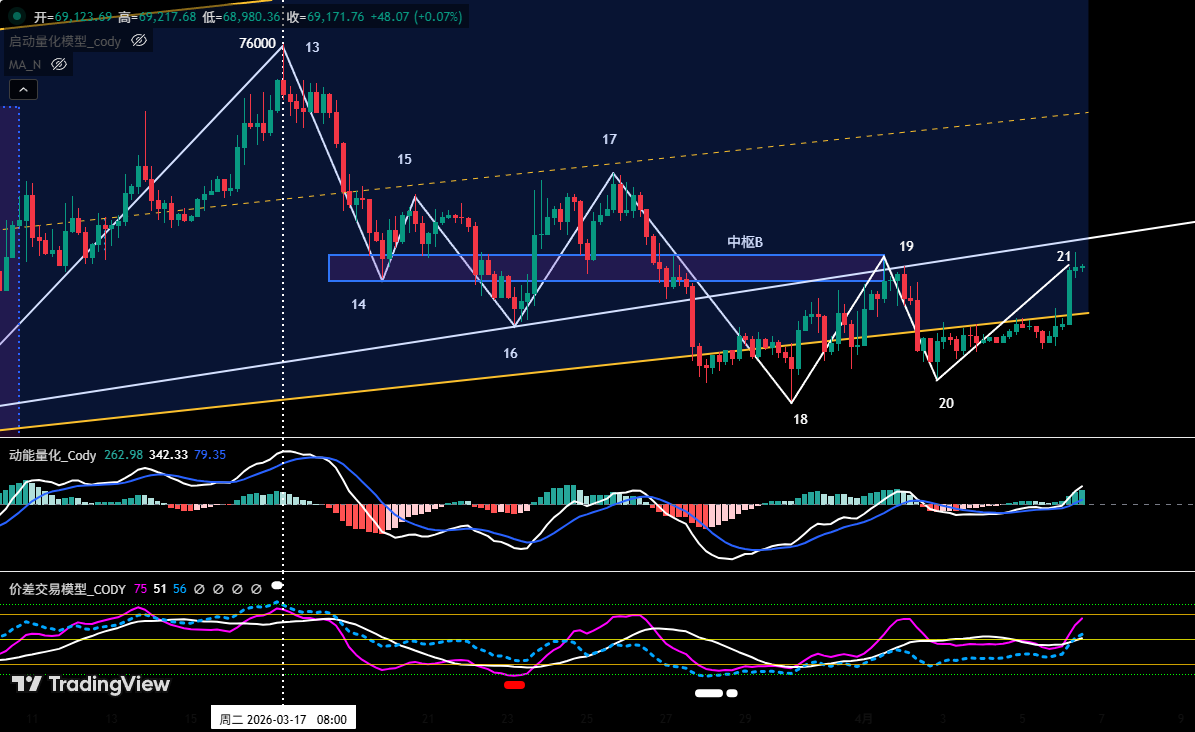
Figure 3
• Based on how the market evolved after the March 17 high (about 76,000 USD).
• As shown in (Figure 3), BTC started a pullback from the March 17 high. From endpoint 13 to endpoint 21, there are 8 segment-based structures.
• Central zone B: the declining central zone consists of 6 segments—14-15, 15-16, 16-17, 17-18, 18-19, 19-20—and it keeps extending leftward.
• Currently, the market is running segment 20-21, and the coin price has touched the vicinity of the upper boundary of the central zone, around 69,300 USD.
IV. Bitcoin: This week’s market outlook and short-term trading strategy
1. BTC’s market outlook for this week:
• This week’s core viewpoint: The coin price remains in a range-bound consolidation between 65,000 and 69,500 USD. If there is a valid upside breakout above the resistance near 69,500 USD, it may enter a wide range-bound consolidation between 65,000 and 72,000 USD. If it breaks below 65,000 USD support, it will likely test support in the 60,000 to 62,500 USD area.
• At the beginning of this week, with the market approaching a news-sensitive window, we recommend mainly staying on the sidelines.
3. Core resistance levels:
• First resistance zone: 69,500 to 72,000 USD area (prior range-bound trading range)
• Second resistance zone: 74,500 to 76,000 USD area (near the November 2025 lows)
4. Core support levels:
• First support: 65,000 to 66,000 USD area (prior important support area)
• Second support: 60,000 to 62,500 USD area (near the February 6 low)
• Third support: around 57,400 USD
5. This week’s trading strategy (excluding the impact of unexpected news): (04.06–04.12)
①. Medium-term strategy:
Bitcoin _ daily candlestick chart: (position monitoring model)
Figure 4
Position monitoring model: As shown in (Figure 4), the current coin price is below the bull-bear wandering belt (yellow). The bearish trend continues. According to the strategy rules, we continue holding the 60% short position established at 89,000 USD (January 28).
• If the coin price rebounds and effectively breaks above the bull-bear wandering belt and holds above it, the entire medium-term position will be cleared to zero.
②. Short-term strategy: Using a 30% position size, set a stop-loss point. Based on support and resistance levels, look for a “price spread” opportunity. (Using a 30-minute/60-minute cycle as the trading period).
③. Based on our outlook for the medium-term bearish trend, we should currently adhere to the principle of “trade shorts with the trend.” To dynamically respond to the market’s complex evolution and to incorporate signals issued by our self-built trading model, we will draft two short-term trading plans A/B:
• Plan A: Rebound meets resistance, short on highs.
• Opening: When the coin price rebounds into the 69,500–72,000 USD area, triggers a resistance/weakness signal, and aligns with the model’s top signal, a 15% short position can be established.
• Add position: When the coin price continues rebounding into the 74,500–76,000 USD area, triggers a resistance/weakness signal, and aligns with the model’s top signal, you can add another 15% to the short position.
• Risk control: The initial stop-loss levels for both short positions are set above 76,500 USD.
• Closing: When the coin price falls to the vicinity of an important support level and aligns with the model signal, gradually close the position to lock in profits.
• Plan B: Break down in line with the trend, short the breakdown.
• Opening: When the coin price effectively breaks below support near 65,000 USD, and aligns with the model’s top signal, you can establish a 30% short position in line with the trend.
• Risk control: The initial stop-loss for the short position is set above 67,000 USD.
• Closing: When the price drops to support and aligns with the model signal, gradually close the position to lock in profits.
V. Bitcoin: Last Week’s Trading Review
1. Review of short-term trading: (see Table 1)
We strictly followed the trading plan. Based on trading signals from our self-built price spread trading model and momentum quantitative model, we completed one short-term (short) trade last week, with trading profits of 2.45%.
①. Summary of Bitcoin short-term trade details: (Leverage*1x)
Table 1
②. Short-term trade review: (see Figure 5)
• Opening: When the coin price rebounded to around 72,000 USD and met resistance, the price spread trading model simultaneously triggered a top warning signal (white dot), and it formed a short-selling resonance with the momentum quantitative model. Therefore, we established a 30% short position at 68,518 USD.
• Closing: When the coin price fell to around 65,000 USD and stabilized, and at the same time the price spread trading model triggered a strong bottom warning signal (red dot + white dot). Therefore, we fully closed the position near 66,842 USD.
• Summary: This trade successfully made about a 2.45% profit.
Bitcoin _ 30-minute candlestick chart: (momentum quantitative model + price spread trading model)
Figure 5 (short-term trade chart display)
2. Medium-term trading review:
Medium-term strategy: continue holding the 60% short position established near 89,000 USD (January 28). As of the close last week (closing price about 69,031 USD), it was up about 22.43%.
VI. Special Notice
At the time of opening a position: immediately set the initial stop-loss level.
When profit reaches 1%: move the stop-loss to the opening cost price (breakeven point) to ensure the principal is safe.
When profit reaches 2%: move the stop-loss to the level where profit is at 1%.
Continue monitoring: After that, for every additional 1% the coin price earns, the stop-loss level will also move up by 1% in sync. This provides dynamic protection and locks in gains.
Financial markets change rapidly, and all market analysis and trading strategies must be adjusted dynamically. All viewpoints, analysis models, and trading strategies discussed in this article come from my personal technical analysis only and are solely for personal trading logs; they do not constitute any investment advice or trading basis. There are risks in the market; invest with caution. Please do not make decisions based on this.