Futures
Access hundreds of perpetual contracts
TradFi
Gold
One platform for global traditional assets
Options
Hot
Trade European-style vanilla options
Unified Account
Maximize your capital efficiency
Demo Trading
Introduction to Futures Trading
Learn the basics of futures trading
Futures Events
Join events to earn rewards
Demo Trading
Use virtual funds to practice risk-free trading
Launch
CandyDrop
Collect candies to earn airdrops
Launchpool
Quick staking, earn potential new tokens
HODLer Airdrop
Hold GT and get massive airdrops for free
Launchpad
Be early to the next big token project
Alpha Points
Trade on-chain assets and earn airdrops
Futures Points
Earn futures points and claim airdrop rewards
More
Zhang Yaoxi: The US-Iran agreement is approaching the final ultimatum, and gold prices are temporarily consolidating sideways in the short term
Zhang Yaoxi: The U.S.-Iran deal is nearing the final deadline; gold prices are consolidating sideways in the short term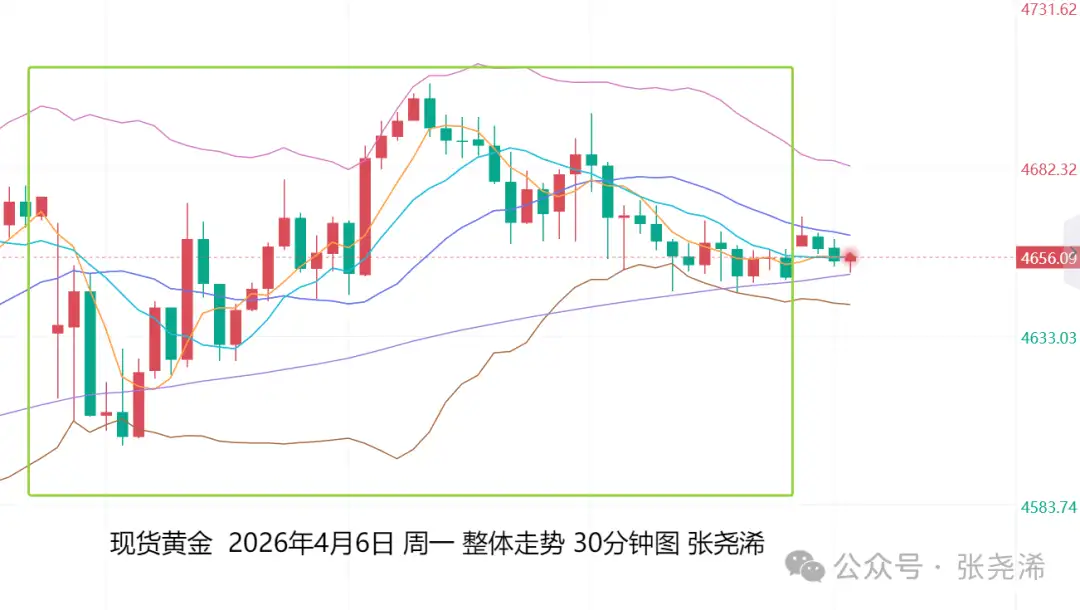
In the previous trading day, Monday (April 6): International gold churned and ended lower with a doji/cross candle, with a lackluster trend. On one hand, it faced downside pressure from Friday’s strong Non-Farm Payrolls data that came in better than expected, and from the escalation in geopolitical conditions that pushed oil prices higher, weighing on gold. On the other hand, the number of ships transiting the Strait of Hormuz rose to the highest level since early March, weakening the upside momentum for oil prices, so gold prices still remain above the 10-day moving average. In addition, the Bollinger Bands are narrowing, and the market doesn’t show much reaction to both intensifying and easing geopolitical factors, suggesting that the short-term trend is mainly sideways range-bound. However, on the flip side, I still favor the upside.
On the specific trend: Gold opened in the Asian session at 4667.68 USD per ounce, first moved lower and printed an intraday low of 4600.66 USD. Then it stabilized and rebounded, continuing into the European session when it recorded an intraday high of 4706.21 USD at around 17:30. After running into resistance, it pulled back and continued to trade with weakening range action. In the latter half of the U.S. session, it fell into a narrow consolidation above 4646 USD, and finally closed at 4650.19 USD. The daily trading range was 105.55 USD, with a decline of 17.49 USD, down 0.37%.
Looking ahead for today, Tuesday (April 7): International gold opened and showed some stabilization from the downside and then ran slightly stronger. The rise in the number of ships transiting the Strait of Hormuz weakens oil’s bullish outlook and inflation expectations. In addition, the U.S. Dollar Index fell yesterday; technically, there is a divergence from expectations, indicating that there is a risk of further pullback and downside later on, which would weigh on gold. Therefore, in the short term, gold is likely to trade in a range with expectations leaning toward strengthening.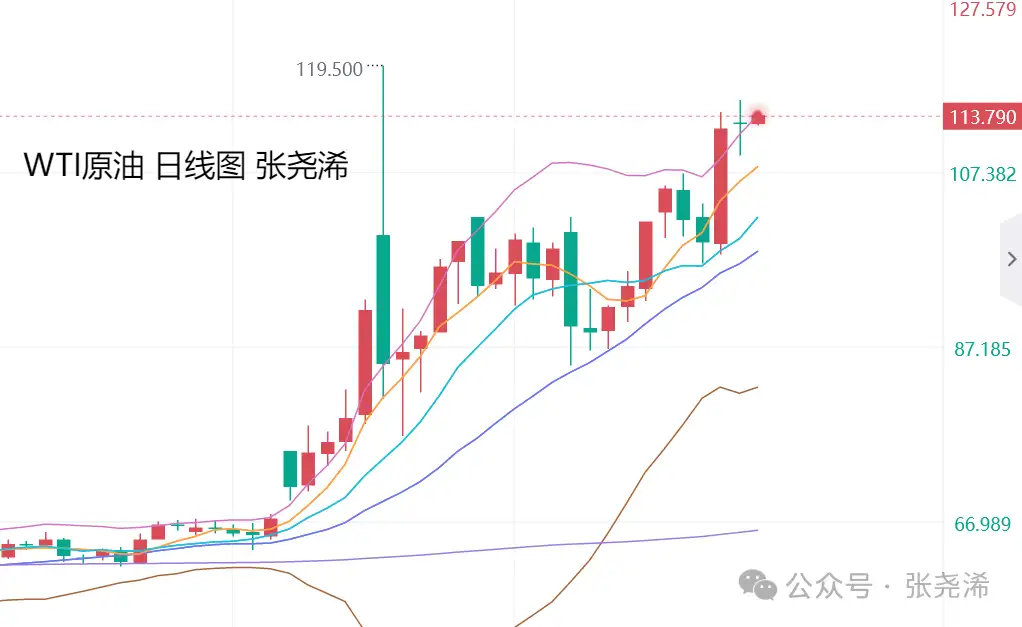
Intraday, focus can be placed on the U.S. February orders for durable goods (month-on-month) and the U.S. March New York Fed 1-year inflation expectations. Market expectations lean toward being supportive for gold; in any case, they are better than expectations or the prior value, so trading is also expected to be mainly range-bound with a choppy, oscillating bias.
In addition, this week’s key focus will be the Federal Reserve meeting minutes at 02:00 on Thursday. At that time, it may reveal officials’ concerns about inflation, as well as the potential economic impact from disruptions in the Iranian conflict and related energy and other commodity flows. Friday at 20:30, U.S. March CPI. The market expects that, affected by the Iranian war pushing up gasoline prices, March CPI is expected to rise by around 1%. This would be the largest single-month increase since 2022. Both developments would weaken the outlook for Fed rate cuts and be bearish for gold. If geopolitical conditions this week continue and the data also meets expectations, but gold fails to recapture last week’s gains and breaks below 30-day moving average support, then bullish buying demand for gold would be strong and bearish expectations would weaken. Going forward, gold would still have an upward climb bias.
On fundamentals: At present, the market is waiting for the arrival of Trump’s “final deadline” before more signals emerge in the U.S.-Iran situation. In Beijing time, the last deadline for reaching an agreement is Wednesday morning at 8:00. Iran said it rejects a temporary ceasefire, emphasizing the need to permanently end the war. Judging from that, along with Iran’s inclusion of ten proposed demands and the like, it is expected that an agreement will be difficult to reach, and the situation may escalate again, which would weigh on gold and pull prices lower. But if the deadline arrives without a large-scale airstrike occurring—even if no agreement is reached—the market would still treat it as good news, and gold would also rebound. The key is to pay attention to the actual market reaction after the deadline.
In addition, the U.S. March services producer price index surged to a new high since October 2022. Two Fed officials warned that the inflation situation is severe, implying that they will tighten rather than ease monetary policy. Wells Fargo and Citigroup also delayed their expectations for Fed rate cuts. The bullish outlook for gold has weakened. In the short term, gold may face sideways consolidation and adjustment.
But in the longer run, the dominant factor and key variable still remains oil prices. The longer the conflict lasts, the more likely energy prices will stay elevated, further pushing up the level of inflation and forcing the Fed to maintain the current interest rate level, making it difficult to kick off a rate-cut cycle. This limits upside for gold bulls; but if the outlook for oil prices weakens, it would push gold to strengthen.
So looking ahead: If the strait situation is resolved, gold would return again to a safe-haven and rate-cut outlook, rising and climbing higher once more. Conversely, it would continue to trade in range-bound consolidation and adjust, due to inflation concerns and a weaker rate-cut outlook. However, the longer-term outlook is still upward, because rising inflation would also increase gold’s commodity attributes, and it also faces the risk of stagflation—thus keeping inflation lower. Therefore, regardless of how the current situation turns out, this wave of gold’s decline and pressure would still only be a mid-course correction within a larger upward cycle. It’s just that the timing may differ in length. Over the next year, it is still expected to have room to climb higher again and refresh highs.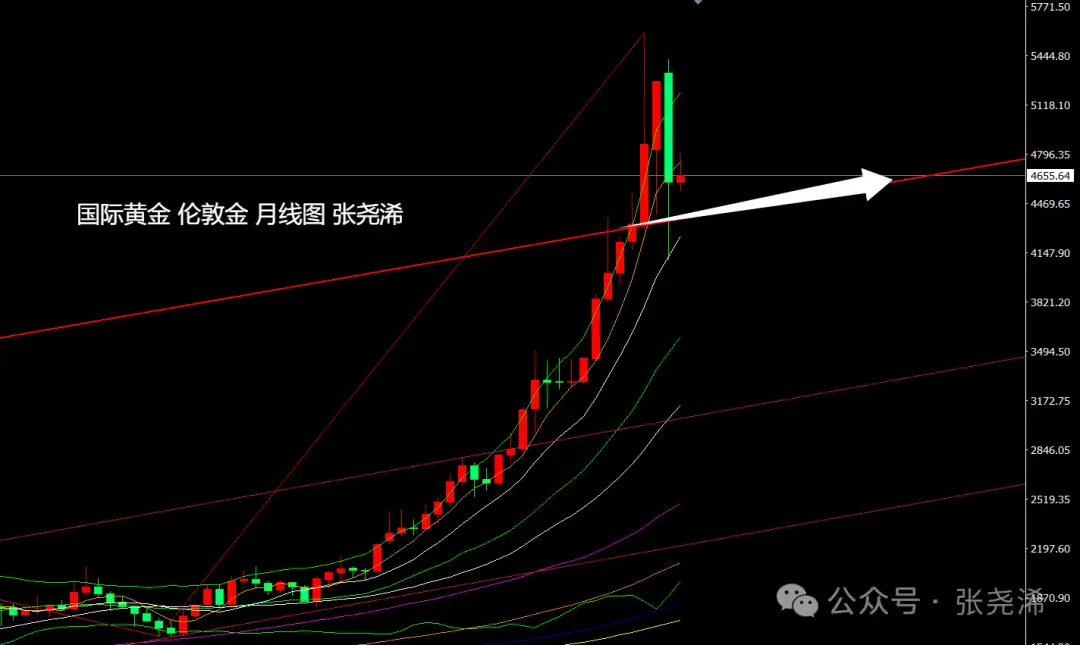
Technically, at the monthly-chart level: gold’s March closing price is above the rising trendline, maintaining a bull-market outlook. This month’s opening also remains above that rising trajectory. As long as gold does not close below this trendline in the future, there will still be expectations for new highs.
At the weekly-chart level: gold last week, as expected, continued the prior week’s rebound pattern from a bottoming-out and stopping the decline with bullish characteristics, along with rebound momentum, and then moved further stronger. But since it did not break above the midline or the 5–10 week moving average resistance and stayed instead turning strong, the bulls’ momentum was not able to be enhanced further, which leaves it with pressure for a pullback and adjustment.
But there is also support from the 30-week moving average below. In terms of strategy: within the week, you can look for a bullish rebound first based on this support. If the rebound breaks through the 5–10 week moving average resistance, you can also follow through to strengthen and look for new highs.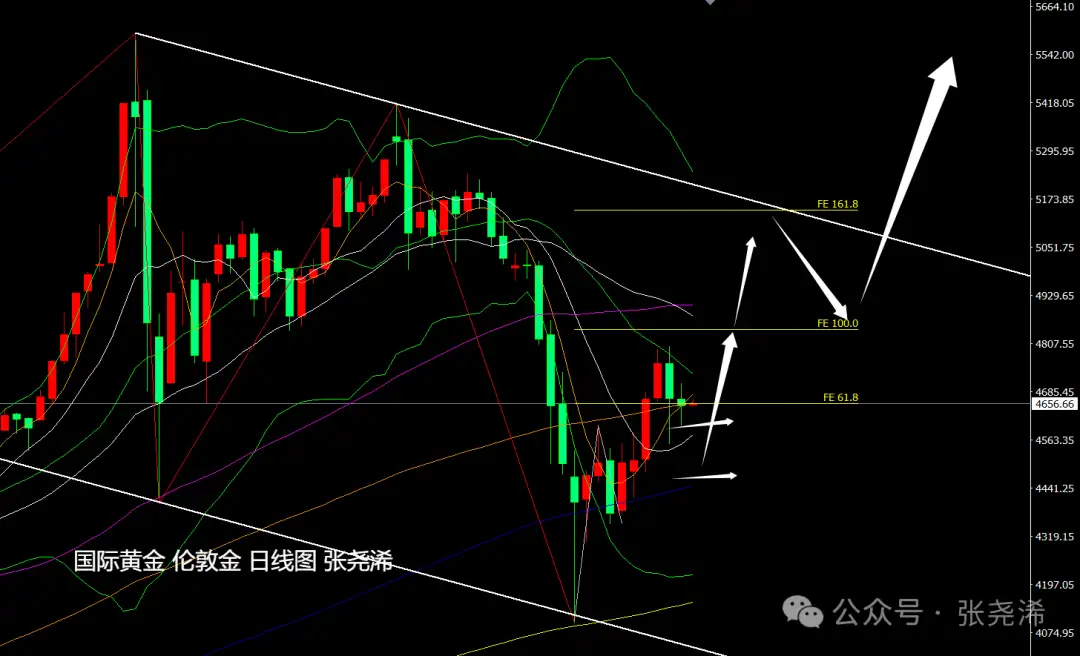
On the daily chart: gold’s price action is below the midline but above the 10-day moving average, trading with choppy oscillation and no clear direction. However, if it cannot regain and hold above the 60-day moving average, then the outlook would face sideways consolidation and a further drift lower, with an expectation of a revisit to the 200-day moving average support (currently around 4200 USD).
So for short-term positioning: focus below on support from the 10-day moving average and the 144-day moving average, and choose to enter long on a bullish setup. Above, the midline of the Bollinger Bands and the 30-day moving average turn into resistance for shorting.
Gold: Watch support around 4580 USD or 4460 USD below; watch resistance around 4680 USD or 4730 USD above;
Silver: Watch support around 71.65 USD or 69.55 USD below; watch resistance around 74.60 USD or 75.70 USD above;
Note:
Gold TD = (International gold price × exchange rate) / 31.1035
International gold moves by 1 USD; Gold TD moves about 0.25 RMB (theoretically).
U.S. gold futures price = London spot price × (1 + gold swap interest rate × number of days to futures expiration / 365)
Follow me—so your gold trading ideas are clearer!
Review history and causality, interpret the current environment, and look ahead to future directions. Adhere to the principles of bold forecasting and cautious trading. – Zhang Yaoxi
The above viewpoints and analysis only represent the author’s personal thinking, for reference only, and are not a basis for trading. If you act on this, you bear the gains and losses yourself.
You decide your own money.