Share crypto content and earn up to 60% commissions through content mining.
placeholder
gatefun
+479.69%, I'm about to slam the table. $BASED This short position has now gone beyond small gains; from 0.06887 down to 0.06201. With this kind of move, I definitely need to say a few words.
I watched closely around 0.06887; resistance above has been persistent, there was no volume on the rebound, and the order book still shows signs of capital outflow. I don't want to hard resist at this level; once a signal appears, I immediately took the short position as a reminder.
Now the price has reached 0.06201; the short space has been exhausted, +479.69% is right here, the rhythm is steady, and the
BASED-7.24%
View Original
post-image
  • Reward
  • Comment
  • Repost
  • Share
Money comes to those that don't give up
Keep doing what you're doing
post-image
  • Reward
  • Comment
  • Repost
  • Share
🔹 BTC falls below $77K, ETH breaks under $2,100! Is market sentiment turning bearish again?
gate liveLIVE
486
live-coin
  • Reward
  • Comment
  • Repost
  • Share
Trump Declares America The “Crypto Capital Of The World”
President Donald Trump said the US must protect its leadership in crypto and prediction markets, calling digital assets a “major industry” that America cannot afford to lose.
Trump emphasized:
• Support for CFTC authority over prediction markets
• The US setting the “gold standard” for financial market rules
• America remaining the global leader in Bitcoin and crypto innovation
• Growing competition from other countries trying to overtake US crypto dominance
Trump also praised CFTC Chairman Mike Selig, saying the agency is helping build
BTC-1.86%
post-image
  • Reward
  • Comment
  • Repost
  • Share
BITMINE adds 5,760 ETH to staking, around $11.9M new stake. Total staked ETH now ~4.72M, ~$9.76B held. This ongoing stake accumulation mirrors steady institutional commitment to ETH staking flow. $ETH
BMNR1.85%
ETH-1.6%
post-image
  • Reward
  • Comment
  • Repost
  • Share
BTC falls below 76,000, and mediocre retail investors are panicking and shouting "The bear market is back." Laughable! 🤡
This is merely the inevitable resonance of macro liquidity tightening and high-leverage liquidations in the derivatives market.
The ignorant cut their losses in extreme panic, while truly top-tier long-term capital has already quietly started building positions on-chain.
The cost of prejudice is watching others achieve asset leaps! This downward slide is an open execution of market mediocrity.
Real wealth has never come from lying back during a bull market, but from
BTC-1.86%
View Original
  • Reward
  • Comment
  • Repost
  • Share
$ES pulling back to 7000 still a htf bullish structure but it ain’t gonna be good for $BTC
ES-0.86%
BTC-1.86%
post-image
  • Reward
  • Comment
  • Repost
  • Share
$APE The short position was decisive, the market directly gave up the space.
Before bed, I reviewed and focused on the 0.14729 level for a while, it was hovering sideways at a high level for a long time, buying volume couldn't keep up, and once selling pressure appeared, it started to push down, so I went short immediately.
The price dropped to 0.1367, +510.16% has already been realized on the account, the rhythm has been established.
Next, don't be greedy, take profit of 80% first, use the remaining 20% to take some profit, and see if it can continue to move later.
Stay disciplined i
APE-0.13%
BTC-1.86%
ETH-1.6%
View Original
post-image
  • Reward
  • Comment
  • Repost
  • Share
Tom Lee signals a supercycle thesis as Bitmine buys 111,942 ETH last week, its biggest 2026 purchase after ETH dipped below $2,200. $ETH
ETH-1.6%
post-image
  • Reward
  • Comment
  • Repost
  • Share
#TradFi交易分享挑战
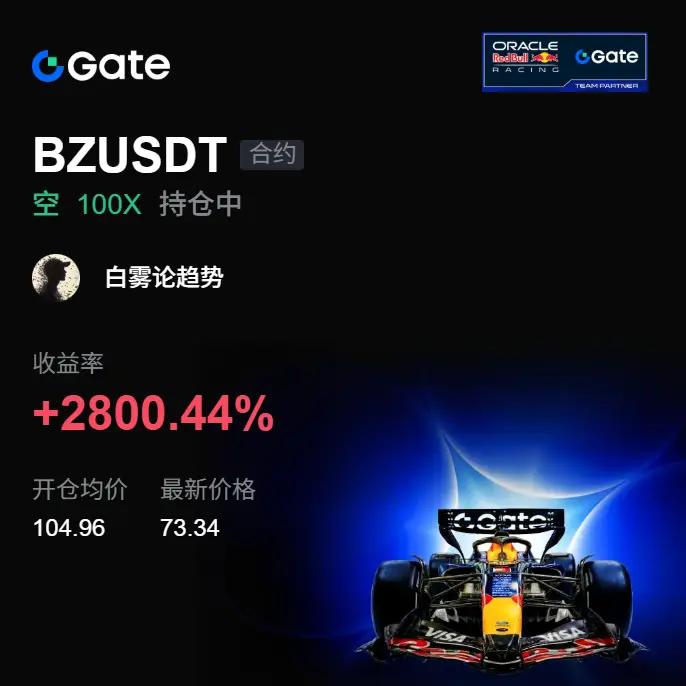
Deep Analysis of Today's International Oil Prices
On May 27, international crude oil (WTI) closed at $93.89 per barrel, Brent crude oil closed at $96.67 per barrel, with intraday fluctuations and a moderate increase in volume. Technical indicators show a consolidation and recovery pattern, with a tug-of-war between bulls and bears. In the short term, the market is influenced by a sharp drop in EIA inventories and ongoing U.S.-Iran negotiations, while in the medium to long term, geopolitical risk premiums and rising global refinery demand support prices. However, a strong dollar
BZ-0.17%
View Original
post-image
LittleGodOfWealthPlutus
#TradFi交易分享挑战
Today’s In-Depth Analysis of International Oil Prices
On May 27th, international crude oil (WTI) closed at $93.89 per barrel, Brent crude oil closed at $96.67 per barrel, with intra-day fluctuations and a moderate increase in volume. Technical indicators show a consolidation and recovery pattern, with a tug-of-war between bulls and bears. In the short term, the market is influenced by a sharp drop in EIA inventories and ongoing U.S.-Iran negotiations, while in the medium to long term, geopolitical risk premiums and rising global refinery demand support prices. However, a strong dollar and market sentiment volatility limit upward potential.
Market Trends
Today, WTI opened at $93.39, briefly dipped to $91.68 in the early session, touching the previous day’s low support, then found buying interest around $92.50. In the afternoon, it gradually strengthened, reaching a high of $95.50, and closed at $93.89, with a daily range of 2.27%, a typical “bottoming out and rebound, range-bound oscillation” pattern. Brent crude oil moved in tandem, opening at $96.37, reaching a high of $97.20 during the session, and closing at $96.67, slightly stronger than WTI. The spread remained around $2.8. Volume increased by about 9% compared to the previous day, indicating renewed market participation without panic selling. From the weekly chart, oil prices have retraced about 10% from the high of $105 on May 18, but have not fallen below the key psychological level of $90, forming a gentle recovery channel characterized by “higher lows and oscillating higher highs,” with the trend intact and direction to be determined.
Technical Indicators
On the daily chart, the RSI (14) is at 48.35, in a neutral to slightly weak zone, not entering oversold or overbought territory, indicating market sentiment is not extreme, with bulls and bears approaching equilibrium; the MACD shows DIF at -0.01, DEA at 0.12, and the MACD histogram at -0.13, with green momentum bars gradually narrowing, indicating a clear weakening of bearish momentum. Although a golden cross has not formed, the MACD is approaching a “momentum inflection point,” signaling a shift from downward correction to oscillation. The Bollinger Bands show WTI trading above the middle band (93.50), with the upper band at 96.20 and the lower at 90.80. Bandwidth continues to narrow, volatility has fallen to near two-week lows, suggesting the market is entering a low-volatility consolidation phase. A volume breakout above the upper band could trigger a trend-following buy signal. Candlestick patterns show two consecutive “hammer” and “bullish engulfing” formations, hinting at a bottom reversal pattern and suggesting short-term bearish forces are exhausted.
Key Support and Resistance Levels
The current technical structure is clear, with support and resistance defined by price action, psychological levels, and Fibonacci retracements:
On the downside, the zone of $92.50–$93.00 is a dense trading area and coincides with the 5-day moving average, forming the first strong support. If broken, the price could fall toward $91.68, the recent low on May 26, which is also the lower boundary of the recent five-day volume cluster and the last line of defense for bulls. A further breach would see $90.00 as a critical psychological and 200-day moving average support zone since 2026, marking a long-term bull-bear dividing line.
On the upside, the resistance zone of $95.50–$96.00 is the recent high area, tested multiple times since May 20 without breaking through. A breakout above this zone could open space toward $97.50 (previous high resistance) and $98.50 (Fibonacci 61.8% retracement). If unable to break through, $95.00 may serve as a short-term high, potentially triggering technical corrections.
Based on the $91.68–$97.20 range:
- 38.2% retracement: $95.10 (current price just below this level)
- 50% retracement: $94.44 (current price slightly above)
- 61.8% retracement: $93.78 (current price nearly at this level)
The current price of $93.89 is above the 50% retracement, indicating bulls are gradually regaining control.
Market Outlook
In the short term, oil prices face technical resistance in the $95.50–$96.00 range. Without major positive catalysts (such as a renewed escalation in Middle East tensions, unexpected OPEC+ production cuts, or a significant decline in the dollar index), prices may continue to oscillate between $91 and $97, awaiting a directional move. However, technical signals show bearish momentum weakening and bulls gradually recovering, so a break above $96 could trigger trend-following buying, with potential targets of $98–$100.
In the medium to long term, geopolitical risk premiums remain the core driver: despite expectations that progress in U.S.-Iran negotiations might suppress prices, risks such as the Strait of Hormuz shipping disruptions and Iran’s high alert status could rapidly push prices higher if conflicts erupt. Additionally, the latest EIA data shows U.S. crude inventories decreased by 5.07M barrels, far exceeding the market expectation of 1.35 million barrels, providing solid fundamental support. The “short-term bullish, long-term bearish” strategy remains valid: in the short term, consider long positions above $90, and monitor the negotiations’ progress by month-end; in the long term, consider short positions above $100 with profit targets around $80.
repost-content-media
  • Reward
  • 4
  • Repost
  • Share
ybaser:
2026 GOGOGO 👊
View More
Don’t go long in a bear market. Are these 5 reasons enough?
1. **Market trend:** The daily trend has officially confirmed a bear market; the rebound has ended, gaps have been filled, and the outlook is for a move toward and a drop below 60,000. In the short term, constrained by the May 29 options settlement, prices will most likely trade in a volatile range of 75,000–80,000, making it difficult to break through effectively.
2. **Macro bearish factors:** Statements from newly appointed officials about shrinking the balance sheet and refusing to provide a backstop have marked the end of the chea
BTC-1.86%
NAS1000.22%
COINON-4.42%
BTC5S9.29%
View Original
post-image
  • Reward
  • Comment
  • Repost
  • Share
$BTC Signal: Bearish continuation | Deep imbalance + 4H lower band resistance
$BTC Order depth 0.01, buy orders almost disappeared. 1H RSI 37.37% on the verge of oversold, 4H MACD bars still expanding. Price tightly hugging the 4H Bollinger lower band at 75812.
🎯Direction: short
⚡Entry/Order: 75594.135 - 75821.600
🛑Stop loss: 76964.150
🚀Target 1: 74107.775
🚀Target 2: 73250.863
🛡️Trade management:
- Execute strategy: After reaching Target 1, reduce position by 50%, and move stop loss to break-even. If the price falls back into the entry zone, automatically exit to protect c
BTC-1.86%
View Original
post-image
  • Reward
  • Comment
  • Repost
  • Share
#MicronMarketCapBreaks1Trillion Global tech market mein ek aur historic milestone dekhne ko mila jab Micron Technology ki market capitalization ne officially $1 trillion ka level cross kar liya. Yeh achievement sirf ek company ki success story nahi, balke poore semiconductor aur AI industry ke rapidly evolving future ki nishani hai. Investors, institutions, aur tech analysts sab is development ko next-generation technology revolution ka strong signal samajh rahe hain.
Micron ka rise achanak nahi hua. Pichlay kuch saalon mein Artificial Intelligence, cloud computing, autonomous vehicles, data c
MU1.47%
NVDA-0.21%
AMD7.79%
DRAM13.34%
post-image
post-image
  • Reward
  • 5
  • Repost
  • Share
BlackBullion_Alpha:
Ape In 🚀
View More
Honestly, that drop back to $HANA really felt relieving, the rhythm was on point.
When I was reviewing before bed, it was still hovering around 0.04462, I saw it consolidating sideways at a high level for a long time, buying volume couldn't keep up, and as selling pressure appeared, it started pushing down, so I initially abandoned the short idea.
The price moved to 0.03337, +618.26% has already been realized on the books, and the rhythm has been established.
Protect the profits already in hand first, take 80% off the table, and keep 20% to see if there’s another move later.
Stay disc
HANA-8.1%
View Original
post-image
  • Reward
  • Comment
  • Repost
  • Share
Everyone, who understands! A few days ago, the short position notification $LTC was sent out, directly to the brothers in the main camp! The key position orders placed a few days ago, now reviewing on the phone, all are good news! The brothers in the main camp are all eating meat, from a few thousand to over ten thousand, no one missed this wave of volatile market. 10x leverage, +553.84% profit, friends who followed reported $12,500. This round of commuting expenses was reimbursed by the exchange. If you haven't jumped in yet, don't miss out next time!
$BTC $ETH
LTC-1.32%
BTC-1.86%
ETH-1.58%
View Original
post-image
  • Reward
  • Comment
  • Repost
  • Share
Wishing everyone a blessed Eid al-Adha! 🐑🌿
We’re happy to experience the old, warm sincerity of exchanging holiday greetings together with our loved ones. I wish all my friends from Turkey and from all over the world a peaceful, happy, and bountiful Eid with their loved ones. Happy Eid! 🗺️✨
Wishing a very blessed Eid al-Adha to everyone! 🐑🌿
Celebrating this beautiful tradition with warm embraces and unity. May this special day bring peace, happiness, and prosperity to you and your loved ones all around the world! 🗺️✨
#EidMubarak #EidAlAdha #Bayramlaşma #May your Eid be blessed
View Original
post-image
  • Reward
  • Comment
  • Repost
  • Share
#StockTradingChallengeUpTo17000U
Hyperliquid Dominates DeFi Holder Income Worldwide Worth $53.5 Million
Recent data shows that the top 10 DeFi protocols account for about 87% of all revenue flowing to token holders over the past month, demonstrating increasing income concentration in the decentralized finance industry.
Based on data from DefiLlama, Hyperliquid becomes the absolute leader by generating around $53.5 million or 38.4% of the total monthly DeFi holder revenue.
Hyperliquid's dominance far exceeds other protocols in the industry and strengthens its position as one of the fastest-gro
HYPE0.26%
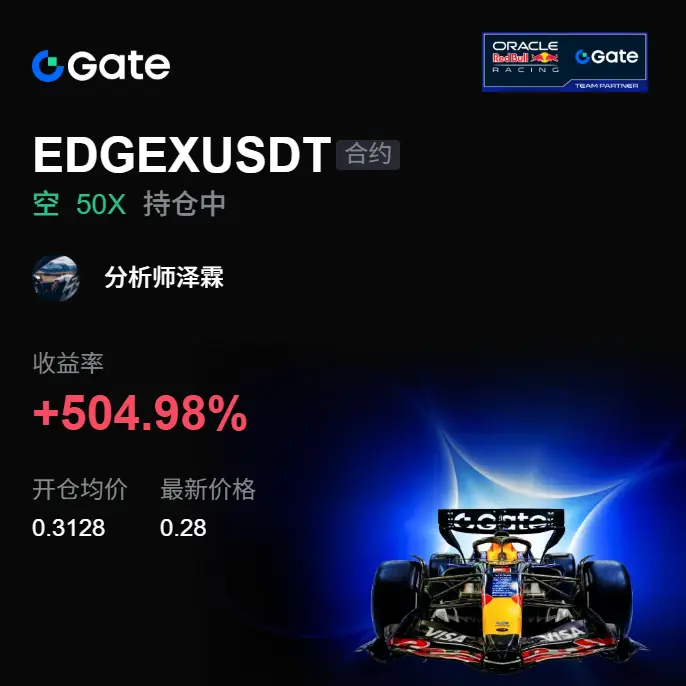
EDGEX-3.33%
View Original
post-image
  • Reward
  • Comment
  • Repost
  • Share
This whole operation has everyone in stitches.
Just before overseas stocks took off, May 22:
China banned capital outflows.
Mainland capital isn’t allowed to buy overseas stocks.
Then Myanmar A promptly tanked, and South Korea hit the circuit breaker.
The world’s largest market-cap company, Nvidia, shot up—straight up.
Intel shot up—straight up. Micron shot up—straight up.
US stocks shot up—straight up. Myanmar A was fragile like potato chips.
And they’re still shouting: “Beware of foreign candy-coated cannonballs!”
If Myanmar A can make money, opening an account is even hard
NVDAX-1.46%
View Original
post-image
  • Reward
  • Comment
  • Repost
  • Share
🚨NEW: BLACKROCK’S IBIT JUST PULLED OFF ONE OF THE LARGEST BLOCK TRADES IN ETF HISTORY
A historic 29 million-share dark pool transaction worth roughly $1.3 BILLION hit BlackRock’s iShares Bitcoin Trust on May 26.
The market absorbed the entire trade with barely any disruption, highlighting how Bitcoin has evolved into a truly deep, institutional-grade asset class with increasingly mature market infrastructure.
#StockTradingChallengeUpTo17000U
IBIT0.11%
BTC-1.86%
post-image
  • Reward
  • Comment
  • Repost
  • Share
BTC & ETH Correlation With Overall Market
gate liveLIVE
575
live-coin
  • Reward
  • Comment
  • Repost
  • Share
Load More