Share crypto content and earn up to 60% commissions through content mining.
placeholder
gatefun
The highest ROI in crypto is larping as a woman 🚶🏾‍♂️🚶🏾‍♂️🚶🏾‍♂️🚶🏾‍♂️
post-image
  • Reward
  • Comment
  • Repost
  • Share
people still think trading means staring at charts all day.
i have higher EV things to do. my stack watches the market, waits for confirmation and calls me when the trade is real.
post-image
  • Reward
  • Comment
  • Repost
  • Share
$ENA Continue going long; this trend is too strong—just follow the trend and keep up. For the entry, you can watch the 0.08895 to 0.09123 range. The upside targets are 0.09349 and 0.09621. If it breaks below 0.08628, then don’t look at it anymore. Also, $BANK and $RE can consider the upward possibility.
But watch the risk: currently the 1-hour RSI is elevated. If the breakout fails, there could be a sharp drop and pullback. Never go all-in; control your position size to what suits you.
ENA7.26%
View Original
post-image
  • Reward
  • Comment
  • Repost
  • Share
The Clarity Act is about more than regulation. It's about creating a clearer foundation for the crypto industry.
While markets often react to headlines, long-term growth depends on trust, innovation, and clear rules that support both users and builders.
If regulatory clarity continues to improve, institutional adoption could become a stronger driver than short-term speculation.
Do you think clear regulations will have a bigger impact on crypto than the next market rally?
#Crypto #Bitcoin #Regulation $BTC
BTC-0.77%
post-image
  • Reward
  • Comment
  • Repost
  • Share
$ETH On the daily chart, everyone take a look—whether an 8 o’clock close could form a doji. The current doji is indicating a shift in this market; it doesn’t necessarily mean a drop—it could also mean sideways consolidation. On the 4-hour chart, the bottom here is slowly rising, and the top is also slowly getting higher. On the 1-hour chart, it looks like price went down to 1958 and then popped up with a quick spike. This wave of decline hasn’t been accompanied by a very large volume. As long as it hasn’t broken 1910, we’re still looking bullish. If you want to open a long, you can open a lon
ETH0.26%
View Original
post-image
post-image
post-image
  • Reward
  • Comment
  • Repost
  • Share
#夏日创作营 Black Strategy: 7.22 FX, gold, and crude oil analysis strategy
【US Dollar Index (DXY)】  DXY yesterday first held high-range consolidation, then during the European-US session the price action rebounded again and recovered. It regained and traded above the 20-day moving average line at around 101. The daily chart ultimately closed as a single bullish candle; the bullish candle has returned above the moving-average band and the trend line. Judging from the daily structure: after DXY had consecutive bullish closes, yesterday it was again able to close bullish and above the moving-average
post-image
  • Reward
  • Comment
  • Repost
  • Share
1,950 short contracts, 66,100 short contracts—profits can also be taken by reducing positions. You’re geniuses at trading! Congratulations to all the friends who followed along and made money!
View Original
post-image
post-image
post-image
post-image
  • Reward
  • Comment
  • Repost
  • Share
That’s the charm of technology! 🎯
Just now, when I was reviewing things in the main camp with my brothers, I said that at $HYPE the sell pressure above is extremely heavy—indicators are severely divergent—making it an ideal short-entry spot.
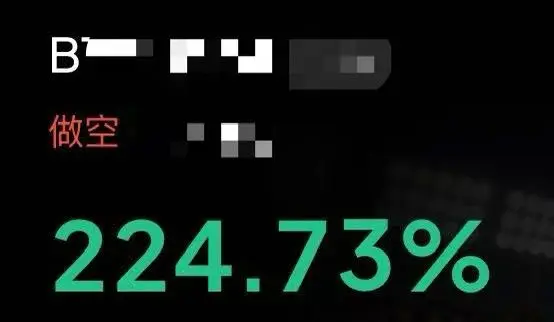
Back then, I told everyone to enter around 66.801. Now the price obediently drops to 59.725, and with 75x leverage I netted the win—an +751% return! 📉
This trade can be said to be textbook-level “topping” (timing the top). Friends who followed—you’re comfortable. Those who didn’t, don’t rush; this kind of high-win-rate model is what I run every day. As
HYPE-1.21%
BTC-0.75%
ETH0.26%
View Original
post-image
  • Reward
  • Comment
  • Repost
  • Share
🚨 BREAKING: Coinbase CEO Brian Armstrong says the CLARITY Act is "ready for a full Senate floor vote," warning that Coinbase could move parts of its business offshore if Congress fails to act.
"The status quo is not going to work."
COIN-5.57%
post-image
post-image
  • Reward
  • Comment
  • Repost
  • Share
Most retail investors doing monthly puts think they are going to win...
Here is the math that ends that argument.
Market gets cheap.
I sell one 2 year put.
Collect $20,000 ish.
You sell monthly puts on the same company.
$1,000 per month average.
You make money in the up months.
You lose in the volatile months.
You have to sell at the top when it is not compelling.
After 8 months you made $8,000.
I made $20,000 in one trade when the market was cheap.
Took the premium.
Bought shares.
Bought calls.
Sat back.
4 months later the market rebounded.
I closed the 2 year puts at 75% profit.
I held them
post-image
  • Reward
  • Comment
  • Repost
  • Share
I just wanted to take a quick look at the chart, but that one glance completely wiped out my sleepiness. After $TRUMP softened from the highs, the shorts’ rhythm was even more decisive than I’d imagined.
A few days ago, in the afternoon, I was watching TRUMP. I found that every bounce felt like it was testing the waters, but the volume never kept up. When the price pushed higher, it got slammed back down—clear signs of weak follow-through. At that time, I wasn’t thrown off by any fake moves. After it confirmed the pullback, I executed a long around 2.056.
Now the current price is already down
TRUMP0.63%
BTC-0.75%
ETH0.26%
View Original
post-image
  • Reward
  • Comment
  • Repost
  • Share
New script is live: Chart Patterns [FEELS]
It auto-detects four classical reversal patterns – Double Top, Double Bottom, Head & Shoulders, Inverse H&S.
But only draws them after the neckline actually breaks. No shapes forming in real time, no redrawing. Once a pattern is on the chart, it stays put.
Each pattern also plots its measured target, and there's a table that keeps score: how often each pattern type has reached its target on the exact symbol and timeframe you're looking at. So you see the shape and its track record.
Open-source, works on any market and timeframe. Best on liquid symbols
post-image
  • Reward
  • Comment
  • Repost
  • Share
When the price suddenly dropped during the session, they were still debating whether it was a fake dip, but $SHIB directly left everyone hesitating behind. This time, the bears moved quite decisively.

When I thought this move was completely out of options, I rechecked SHIB’s price action: the rebound never managed to hold, pushing it up was met by sell pressure that knocked it back down. The follow-through was strong at times and weak at others—so the “pump-and-dump / bull trap” vibe kept getting more obvious. My approach is simple: first wait for the key level to confirm, then open a long p
SHIB-0.73%
BTC-0.75%
ETH0.26%
View Original
post-image
  • Reward
  • Comment
  • Repost
  • Share
Another High-Impact Trading Day Begins! Can BTC & ETH Stay Strong
gate liveLIVE
1,245
live-coin
  • Reward
  • Comment
  • Repost
  • Share
i colonized even urAnus.
i built domes.
i grew food in dead soil.
my wi-fe still
does not tHrust me
to buy the right
kind of bread.
and honestly?
she is right.
i always & in all ways
get the wrong 1
some frontiers
were nEver mine
to conquer. 🚀
post-image
  • Reward
  • Comment
  • Repost
  • Share
$SNDK Follow the bearish direction. Everyone is currently waiting for a dip-buying rebound, which may actually be an opportunity to take the opposite view.
The overhead rejection zone is still effective. The 4-hour bearish structure remains, and the daily chart overall continues to range-trade. Price has shown a clear reaction in the 1609 to 1617 area. Check the 15-minute level: the RSI is around 60, momentum is neutral, and there may still be room for further downside. Also, the 15-minute trading volume has surged by nearly 4x; the real sell orders have already confirmed that they entered.
Y
SNDK0.80%
View Original
post-image
  • Reward
  • Comment
  • Repost
  • Share
Wall Street Builds Fresh Momentum! Can Crypto Benefit?
gate liveLIVE
1,336
live-coin
  • Reward
  • Comment
  • Repost
  • Share
$DEXE Watch the long opportunities.
The current funding rate looks like it’s going to squeeze shorts—shorts are getting trapped. There may be a violent bounce to test the 4.65 area. Entry can look around 4.226 to 4.334, with the first target at 4.657, then 4.959. Place support/defense at 3.972.
But be mindful of the risk—the larger timeframe is still a downtrend. If the 4.15 support can’t hold, the short-squeeze logic is gone. Never go all-in; control your position size.
DEXE-44.36%
View Original
post-image
  • Reward
  • Comment
  • Repost
  • Share
Another really cool building.
post-image
  • Reward
  • Comment
  • Repost
  • Share
$12k a day keeps the 9-5 away $SPY
post-image
  • Reward
  • Comment
  • Repost
  • Share
Load More

Join 40 M users in our growing community

⚡️ Join 40 M users in the crypto craze discussion
💬 Engage with your favorite top creators
👍 See what interests you
  • Pinned