Square
Following
Hot
News
Notifications
Profile
Share your thoughts
placeholder
Article
[NEW STREAMER]market update💕
live-cover
LIVE2,803
In BTC trading, why is patience more important than prediction?

In BTC trading, many people study the market every day, trying to predict whether the next candlestick will rise or fall. Some constantly switch technical indicators, some watch every price fluctuation, and others worry about missing any trading opportunity.

But one easily overlooked point is that even if you can correctly judge the market’s general direction, that doesn’t mean every entry will make a profit.

Why is patience so important?

First, the market doesn’t offer trading opportunities at every moment. BTC often sees sid
post-image
BTC-0.67%
Trenches
ZIG
Z
bade
b
ZIG
0x8c...1145
Market Cap
$.
Change
.
24h Vol
$.
Holders
.
STONK
S
bade
b
STONK
6GmA...UNgx
Market Cap
$.
Change
.
24h Vol
$.
Holders
.
IDOL
I
bade
b
IDOL
0x3b...ab07
Market Cap
$.
Change
.
24h Vol
$.
Holders
.
CLAUDIA
C
bade
b
CLAUDIA
2j5S...W2ZM
Market Cap
$.
Change
.
24h Vol
$.
Holders
.
MAGGIE
M
bade
b
MAGGIE
8rHo...PmZV
Market Cap
$.
Change
.
24h Vol
$.
Holders
.
$XRP , not $BTC or $ETH , had the most leveraged longs forced out on Nov 7, $6.5M worth. The recorded total of $53.0M across our tracked venues was far below the $339.6M seven day average.
XRP-1.12%
BTC-0.65%
ETH-1.23%
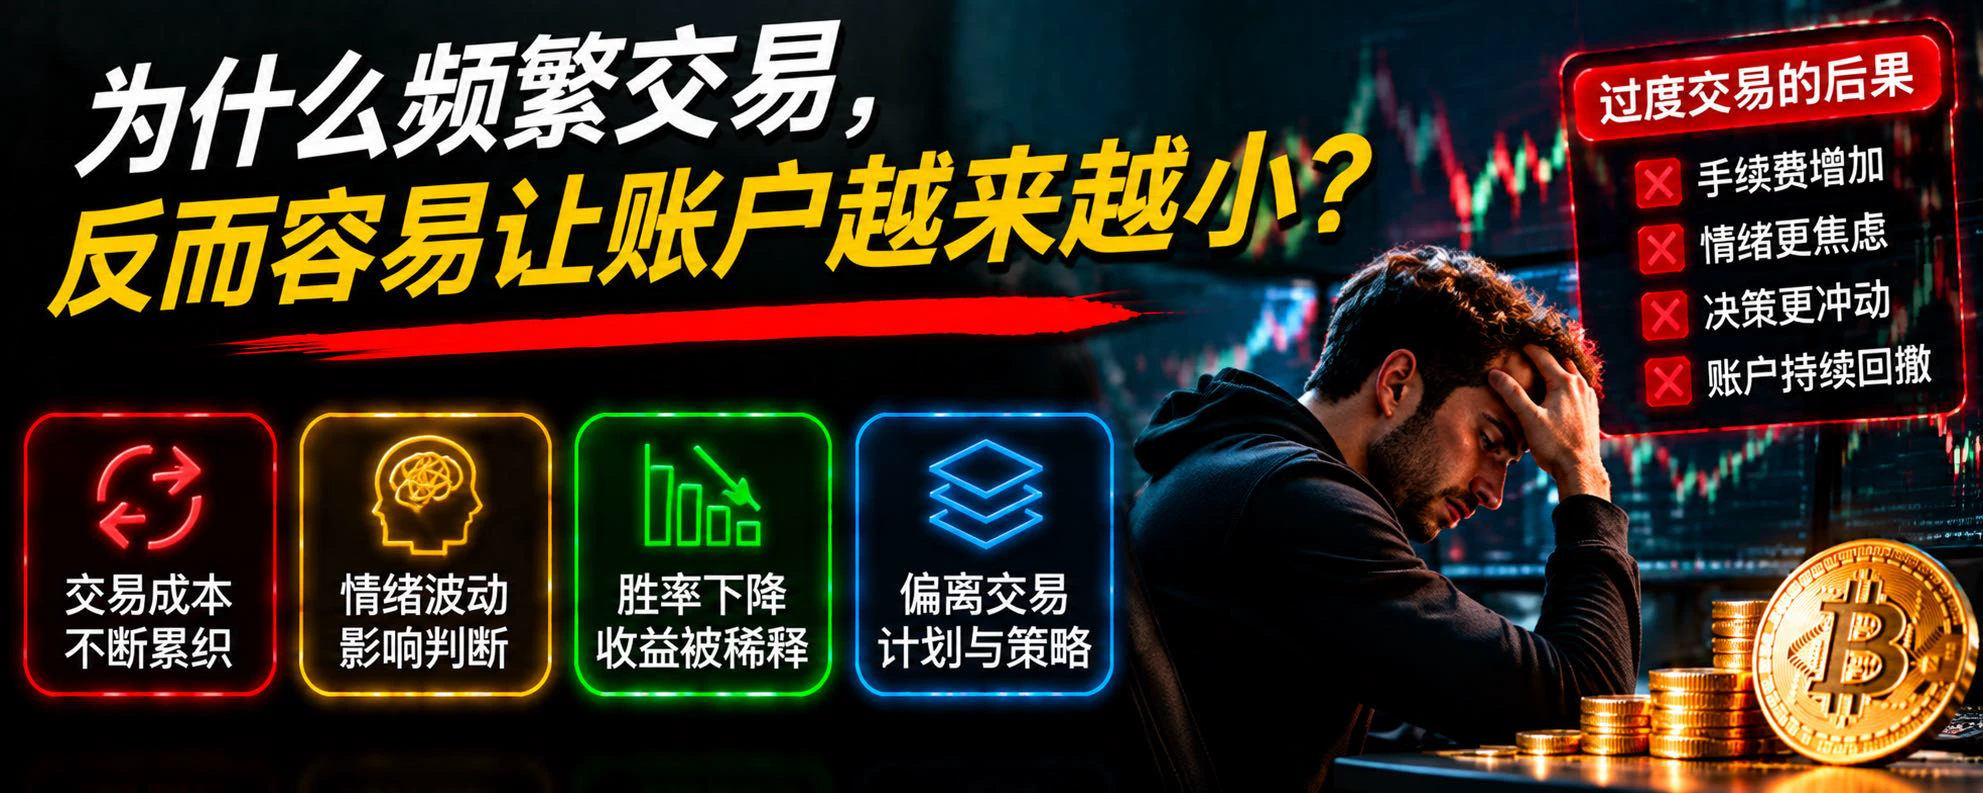
Why Can Frequent Trading Make Your Account Smaller?

In BTC trading, many people watch the market every day, afraid of missing any rise or fall. When the price goes up, they want to go long; when it goes down, they want to go short. When they see an indicator signal, they can’t resist opening a position. They trade over ten times a day, seemingly working very hard, but when they look back at the end of the month, their account balance may have shrunk.

Where exactly does the problem lie?

First, trading costs keep adding up. Every time you open or close a position, you may incur a fee. If you
post-image
BTC-0.65%
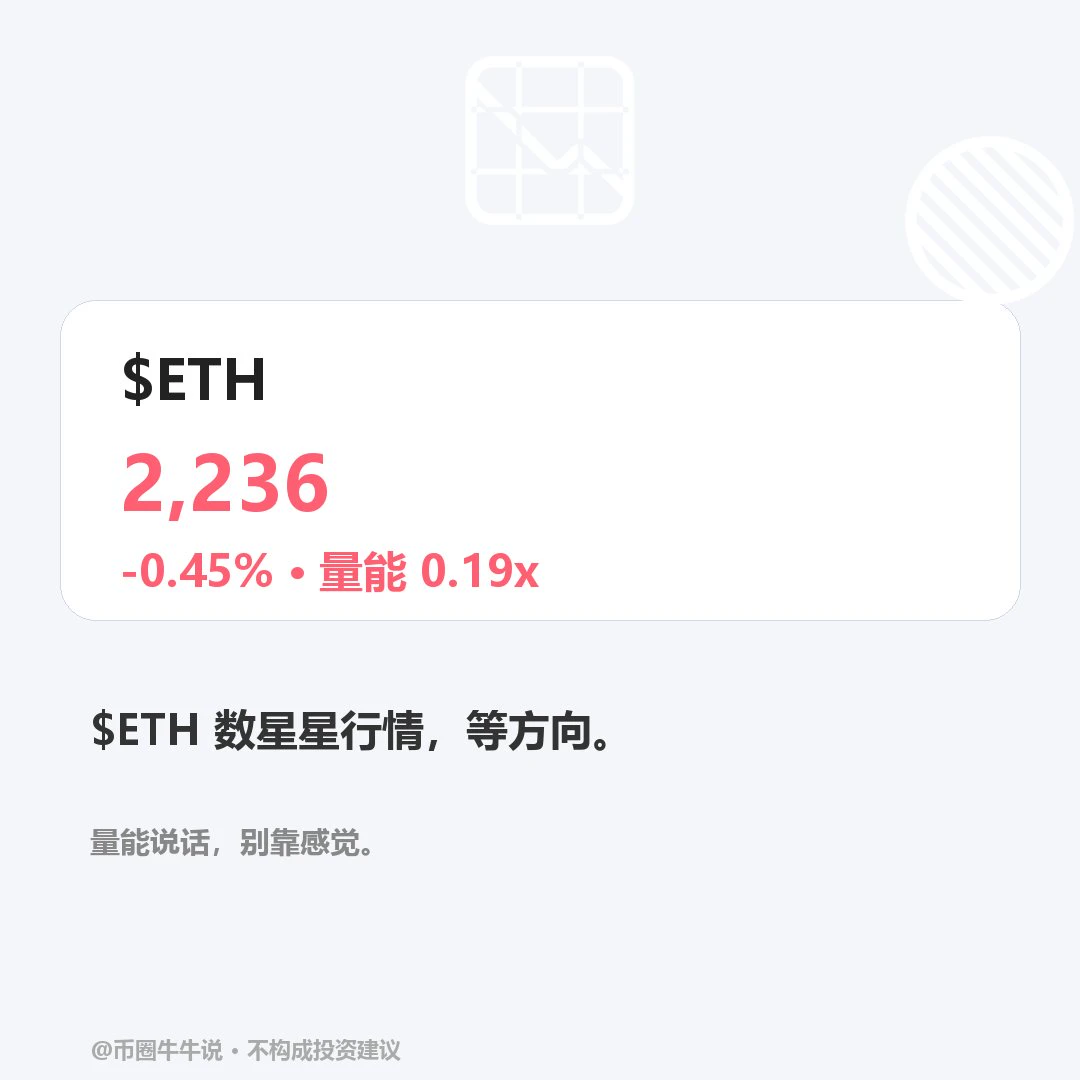
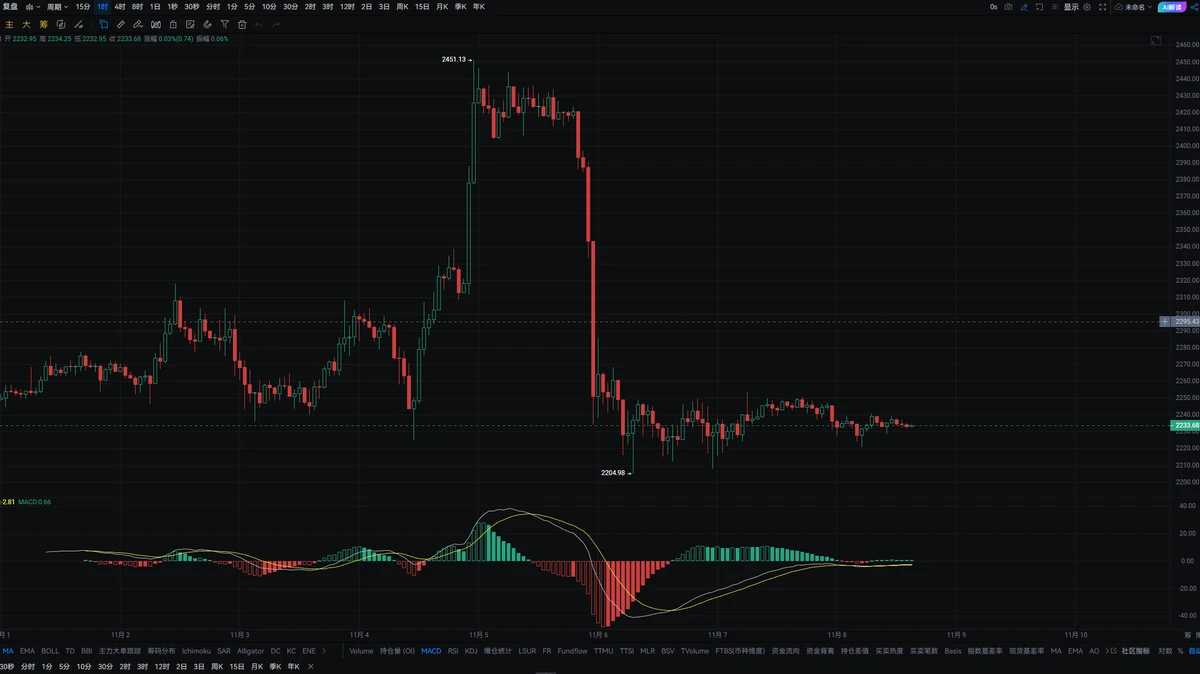
$ETH Current price: 2236.13, 24H -0.45% (2222.58–2251.52). 1H is weak: RSI 53.12 / EMA20 2237.37, support at 2222.58 / resistance at 2251.52; 4H is weak: RSI 48.72 / EMA20 2258.38, support at 2206.00 / resistance at 2450.79. A sustained move above resistance at 2251.52 is meaningful; a break below support at 2222.58 would signal further weakness. Review whether price holds above 2251.52 and reclaims 2222.58 after breaking below it; the volume ratio is 0.19x. Without confirmation from trading activity, or if price fails to reclaim the level, the setup is invalidated. High market volatility; for
post-image
ETH-1.26%
I'm trading on Gate, a top-tier exchange with a 13-year track record. Come join me and dive into the hottest events right now! https://www.gate.com/campaigns/6905?ref=VLARBF1YAG&ref_type=132
post-image
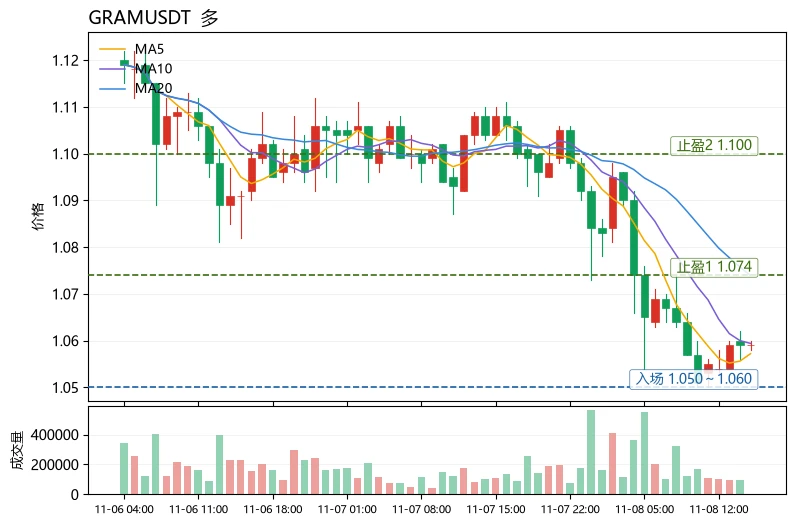
The most unusual detail in today's market is that the Fear and Greed Index has fallen to 28, in the fear zone, yet $GRAM has not seen panic-driven, high-volume selling. The 24-hour trading volume is only 5.2M USDT, with a 5.76% range, indicating a slow decline on shrinking volume rather than a collapse. This combination of “extreme fear + shrinking volume” suggests selling pressure is weakening, rather than marking the start of another downward move.
Technically, the price at 1.059 remains above the lower Bollinger Band at 1.03977. MA5=1.0572 has started to flatten and converge upward, narrow
post-image
GRAM-0.97%
BMT+5.93%
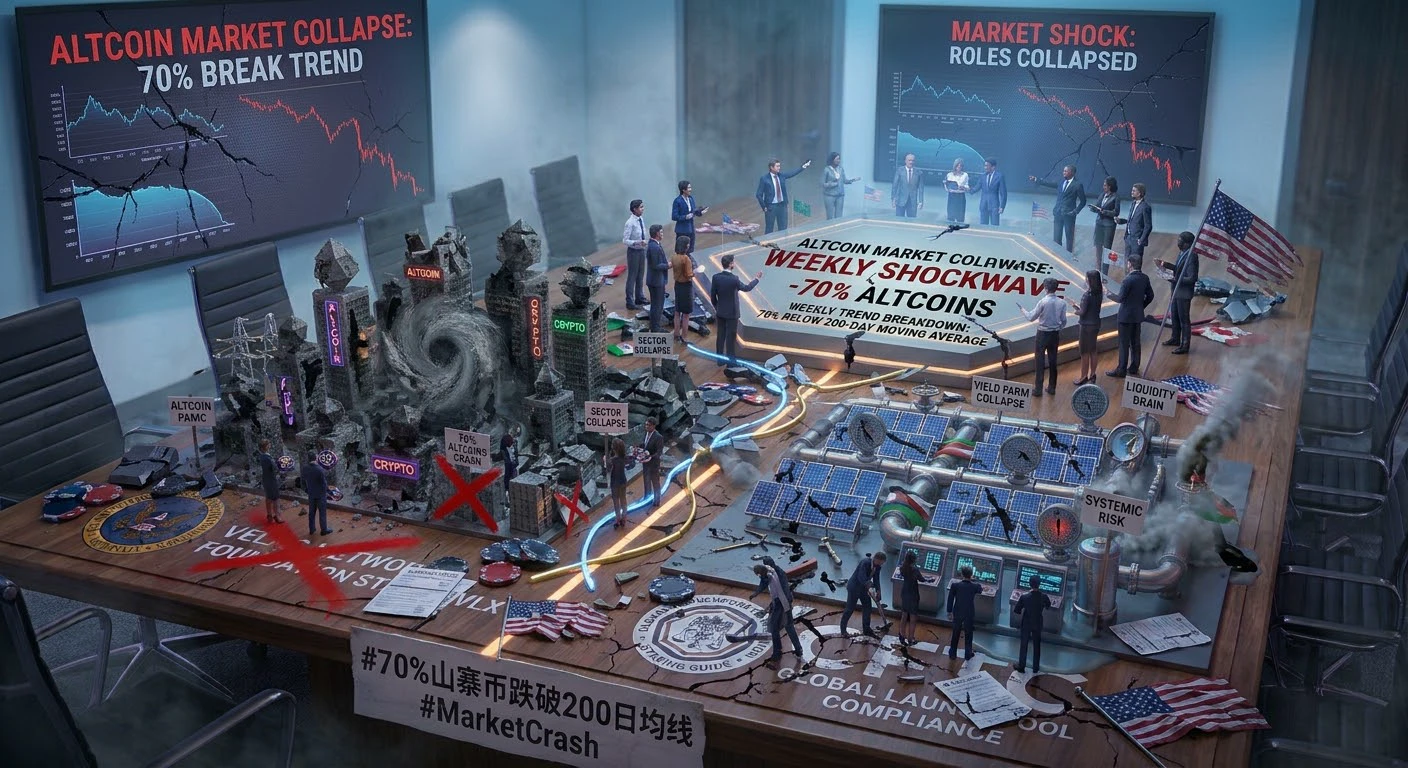
#70%山寨币跌破200日均线Writing
70% of Altcoins Fall Below the 200-Day Moving Average: Is the Crypto Market Entering a Deeper Correction?
The cryptocurrency market is facing another important technical development as reports indicate that approximately 70% of altcoins have fallen below their 200-day moving average. This situation has raised concerns among investors and market analysts about the overall strength of the altcoin market.
The 200-day moving average is widely used to evaluate long-term market trends. When a large percentage of cryptocurrencies trade below this level, it can indicate weakenin
post-image
BTC-0.67%
TOKEN-0.16%
Wishing everyone a little more light, a lot more laughter and countless reasons to smile
Spend time with your loved ones, share happiness, and make this Diwali memorable.
Happy Diwali 🪔
post-image
The S&P 500 fell 4.36% in a day, AI trades completely unraveled, and the VIX surged 70% in a day—this isn’t a pullback; it’s a crowded trade looking for an exit. With Democrats sweeping the midterms, the market cut the most expensive trade first. The day it doubled, people most wanted to pile in; it’s the same now, just in the opposite direction. More in the comments. #SP500
market
post-image
SPX+0.33%
$HUMA Only 9 hours left to determine whether 0.0116 is rock bottom or just halfway down. It’s at 0.0117 now, down 9.3% in 24 hours, with the low of 0.0116 right beneath us. Trading volume of 17.3M shows panic selling on rising volume—this kind of high-volume plunge is either the final drop or the prelude to a sell-off, with no middle ground.
Let’s run through the scenarios. First, if the 4-hour candle at 0.0116 closes with a lower wick and shrinking volume, that’s a spot to try for a short-term bounce: enter near 0.0117, set a stop-loss at 0.0112 (exit if it breaks the previous low), and targe
HUMA-1.99%
#ETH At the current price of 2235, the market is still weakening in lockstep with BTC, with virtually no independent buying. The first short-term resistance is around 2270, followed by the 2320 area, where supply was concentrated previously and which is also a key level for reversing the short-term weakness. A meaningful rebound will require BTC to stabilize and rally on increased volume.

The short-term support below is at 2210, with the key defense zone at 2180–2200. If this support zone is decisively broken, bears could open up more downside and test buying interest around 2150. In terms of
post-image
ETH-1.26%
BTC-0.67%
#70%山寨币跌破200日均线 70% is a high proportion, but still far from extreme oversold territory. For now, it looks more like the market is continuing to weaken; there is no clear sign that a reversal is near.
The proportion has rebounded quickly: At the beginning of October, only about 10% of altcoins were below this line, but it has since risen to 70%, showing that the decline came quickly.
Still far from extreme oversold territory: At the end of June, this proportion once reached about 84%. Some analysts believe that only a reading above 90% counts as an extreme oversold signal.
The drivers are macr
BTC-0.67%
ETH-1.26%
SOL-0.77%
USDC+0.01%
BlackRock IBIT Sees $403 Million Exit as Bitcoin ETF Pressure Intensifies
live-cover
LIVE1,045
Go from this⬇️ to This ⬇️
#ShareWeekly #SEC #CFTC #WCTCS9
SEC and CFTC: Shaping the Future of Crypto Regulation
The cryptocurrency market is entering an important phase as regulatory discussions continue to shape the future of digital assets. Two major U.S. regulatory institutions, the Securities and Exchange Commission (SEC) and the Commodity Futures Trading Commission (CFTC), play a significant role in determining how crypto markets operate, develop, and attract institutional participation.
SEC and CFTC: Why They Matter
The SEC primarily focuses on securities markets, investor protection, and financial disclosure re
post-image
You know everything written in textbooks; what really makes you lose money are the things where doing the opposite is right. ① The more you want to break even, the less likely you are to. After losing 5%, your goal shifts from “making money” to “breaking even.” Every trade you make then is a bet, not a trade. Remember: the market doesn’t know how much you’ve lost. It won’t compensate you. ② You should cut losing trades, not winning ones. Most people do the opposite: they take profits at 5% and stubbornly hold on at a 20% loss. The result is an 80% win rate and a still-negative account. Cut you
post-image
BTC-0.65%
I don’t open a trade because I “see an opportunity”; I open one because it “passes the checks.” Five gates—fail any one, and I don’t trade.
Gate 1: Location
Is this entry near one of the lines I’ve drawn?
At a key support/resistance/trend line → pass.
In the middle of a range, just because I “feel like it’s going up” → fail; delete it immediately.
Gate 2: Direction
Does the direction on the higher timeframes (4H/daily) match this trade?
Yes → pass.
Countertrend bounce trades → may pass, but only with a small position and a nearby target.
Gate 3: Signal
Is there a “confirmation candle”?
What co
BTC-0.65%
#美股史诗级抛售 #Gate股票畅聊季 #每周来晒 The “Deleveraging” Moment in U.S. AI Stocks: A 1998 Replay Without Fed Rate Cuts to the Rescue!

This article analyzes the plunge in U.S. AI stocks and the wave of programmatic selling: at the market-structure level, leveraged ETFs and dealers’ negative Gamma triggered a mechanical selloff; at the valuation level, uncertainty over capex and returns created a rift; and at the macro level, the Fed was absent as a backstop through rate cuts. It examines whether the AI trade is replaying the 1998 LTCM crisis or heading toward a 2000-style bubble.

As buyers of AI computin
NVDA+2.80%
NDAQ+0.28%
CSCO-2.05%
CRWV+6.18%
SPX500+0.19%
Trade Futures for Prizes and Claim XAUT & SLVON Rewards https://www.gate.com/campaigns/6808?ref=VLARBF1YAG&ref_type=132
post-image
XAUT+0.30%
SLVON+0.22%
Load More

Join 40 M users in our growing community

⚡️ Join 40 M users in the crypto craze discussion

💬 Engage with your favorite top creators

👍 See what interests you

Trending Topics

USCPIDataIncoming

4.16k Views1.53k Discussing

The U.S. October CPI report will be released on November 10 at 8:30 a.m. ET. September CPI came in at 3.7% year over year, and markets will be watching closely for signs that inflation is cooling, especially in core CPI. A softer-than-expected reading could strengthen rate-cut expectations, while hotter inflation may pressure risk assets through higher Treasury yields and a stronger dollar. How do you think this CPI print will move $BTC, U.S. stocks and gold?

USAIStocksHitHard

24.99k Views3.71k Discussing

USNonfarmPayrolls

44.93k Views4.44k Discussing

View More