Futures
Hundreds of contracts settled in USDT or BTC
TradFi
Gold
One platform for global traditional assets
Options
Hot
Trade European-style vanilla options
Unified Account
Maximize your capital efficiency
Demo Trading
Futures Kickoff
Get prepared for your futures trading
Futures Events
Join events to earn rewards
Demo Trading
Use virtual funds to experience risk-free trading
Launch
CandyDrop
Collect candies to earn airdrops
Launchpool
Quick staking, earn potential new tokens
HODLer Airdrop
Hold GT and get massive airdrops for free
Launchpad
Be early to the next big token project
Alpha Points
Trade on-chain assets and earn airdrops
Futures Points
Earn futures points and claim airdrop rewards
Clearing Map: Revealing the Liquidity Secrets of the Crypto Assets Derivation Market
Introduction
In the highly volatile cryptocurrency market, traders face significant risks, especially the liquidation risk in leveraged trading. The Liquidation Map is an advanced tool that visually displays the locations of potential liquidation events, helping traders better understand market liquidity and price movements. As the market continues to evolve, the Liquidation Map has become an essential tool for many professional traders.
View the liquidation map now:
What is a liquidation map?
The liquidation map is a charting tool that displays the price levels at which potential liquidation events may occur in the cryptocurrency futures market. Liquidation events happen when a trader’s margin is insufficient to maintain their leveraged position, leading the exchange to forcibly close the position. This situation is especially common during rapid price fluctuations.
On the liquidation map, the X-axis represents the mark price, while the Y-axis represents the relative strength of the liquidation. The liquidation chart does not show the exact number of contracts to be liquidated or the exact value of the liquidated contracts. The bars on the liquidation chart actually represent the importance, or strength, of each liquidation cluster relative to nearby liquidation clusters.
The liquidation map predicts potential liquidation price points by analyzing market data and different leverage multiples, and presents this information graphically. These graphics typically show liquidation clusters, which are areas where a large number of potential liquidation orders are concentrated within a specific price range. The density and height of the liquidation clusters indicate that the impact on market prices can be quite significant when prices reach these levels.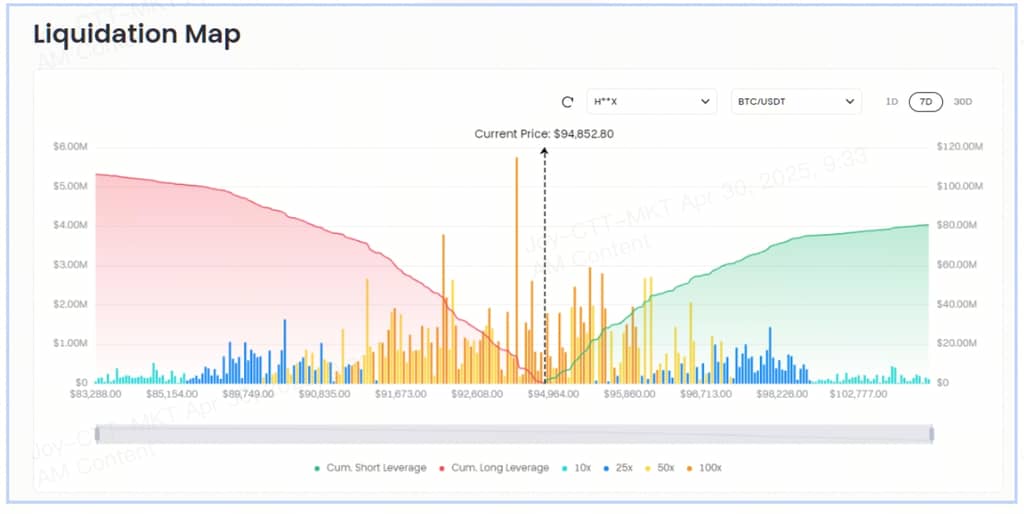
For example, the Coinglass liquidation map not only shows the current market liquidation distribution but also provides historical data and a heatmap feature to help traders identify high liquidity areas. Of course, Gate also provides access to the relevant liquidation map.
The Principle of Generating the Liquidation Map
The generation of the liquidation map is based on the following key factors:
Specifically, the liquidation map calculates the potential liquidation quantities at each price level and displays them using variations in color or density. For example, the Coinglass liquidation heatmap uses a color gradient (from purple to yellow) to indicate the intensity of liquidation levels, with yellow areas representing a large number of predicted liquidation levels and higher liquidity.
How to Use the Liquidation Map
Traders can use the liquidation map for the following strategies:
In addition, the liquidation map can help traders identify “magnetic zones,” which are areas where prices may be attracted due to a large number of liquidation orders. Once the price reaches these areas, it may trigger a chain reaction, resulting in rapid price fluctuations.
The Role of the Liquidation Heatmap
The liquidation heatmap is a specific form of the liquidation map, which displays the intensity of liquidation levels through a color gradient. The deeper the color, the more potential liquidation events at that price level, indicating higher liquidity.
For example, in the Coinglass liquidation heatmap, the yellow areas represent a large number of predicted liquidation levels, allowing traders to gauge the potential direction and intensity of price movement. By analyzing the heatmap, traders can identify support and resistance levels, optimizing their trading strategies.
It is worth noting that the liquidation heat map predicts where the liquidation levels will open, but it does not predict where they will close. Therefore, the actual number of liquidations may be less than the predicted value. Traders should use it in conjunction with other technical indicators and market dynamics for comprehensive analysis.
Case Study: Liquidation Map Data on Gate.io
From the observation point of the writing date, as shown in the figure below, according to Gate.io’s liquidation map, the current price of the BTC perpetual contract is $94,660. The figure shows that if the coin price rises to $95,428, several high-leverage short positions totaling $128 million will be liquidated.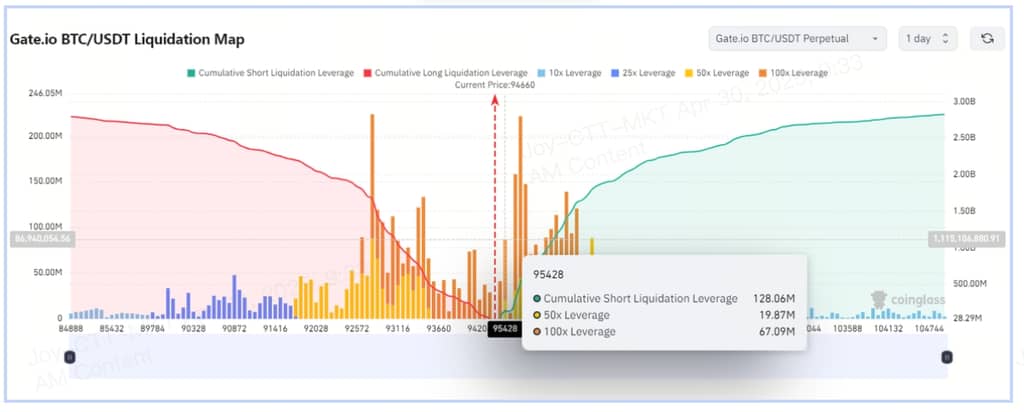
Although there is currently little overall volatility in the market, localized events are likely to trigger brief and intense price fluctuations. If the aforementioned short positions are liquidated, it could lead to a further increase in prices.
Of course, liquidation maps are essentially data-based forecasting tools, and the actual number of liquidations may be less than predicted, but market behavior is ultimately driven by human nature. Factors such as emotional trading, herd effect, etc., can cause the prediction of the liquidation map to be skewed. Therefore, when using the liquidation map, traders should make decisions based on their own psychological state and risk appetite.
Conclusion
The liquidation map, as a powerful analytical tool, provides cryptocurrency derivatives traders with a unique perspective, helping them better understand market liquidity and risk distribution. By utilizing the liquidation map, traders can develop more effective trading strategies and improve their success rates.
However, it is worth noting that the clearing map is just one of many analytical tools, and exchanges may provide more refined clearing map data in the future, even integrating AI algorithms to help traders predict market behavior more accurately.
Risk Warning: The content of this article is for reference only and does not constitute any investment advice. Investing in cryptocurrency derivatives involves high risks and may result in financial losses. Investors should bear the risks themselves.
Author: Charle A., Gate.io researcher *This article only represents the author’s views and does not constitute any trading advice. Investment involves risks, and decisions should be made cautiously. *The content of this article is original and copyrighted by Gate.io. If you need to reprint it, please indicate the author and source, otherwise legal responsibility will be pursued.