Share crypto content and earn up to 60% commissions through content mining.
placeholder
gatefun
ETF Headlines Keep Dominating Market Attention!
gate liveLIVE
1,176
  • Reward
  • Comment
  • Repost
  • Share
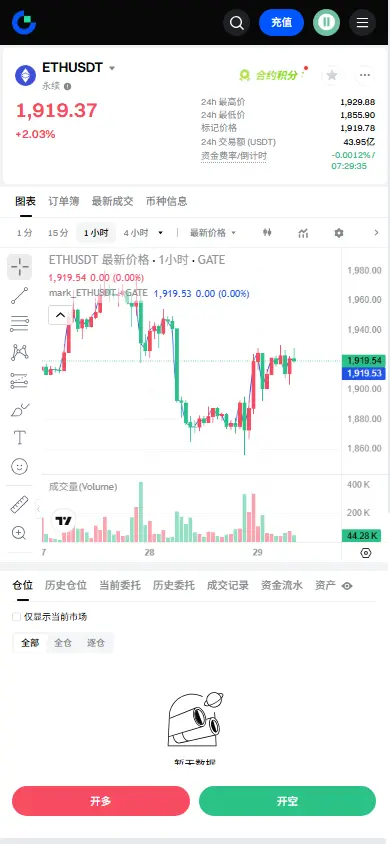
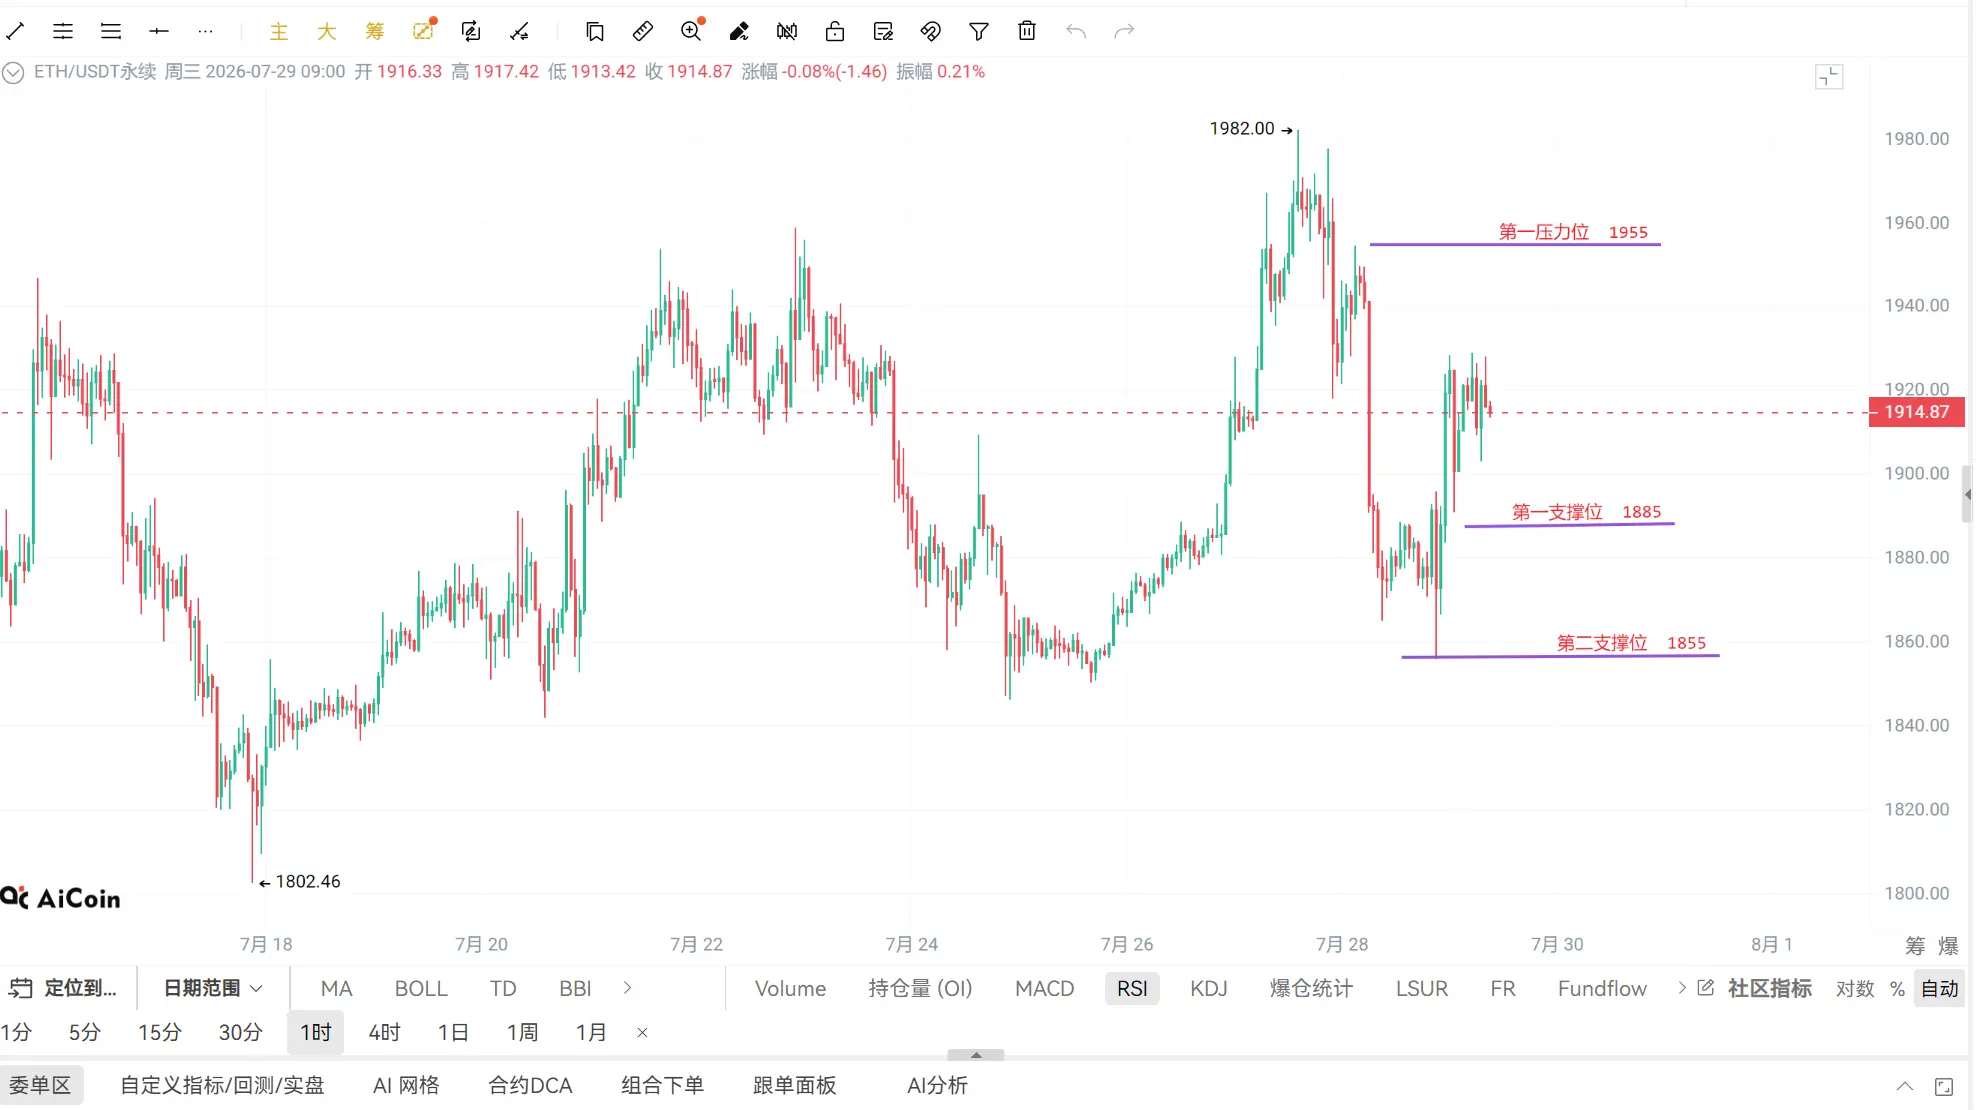
$ETH Signal】Go long + 1H MACD golden cross with increased volume; confirmed support at the Bollinger middle band
$ETH 1H MACD histogram flips positive to 4.07, and the golden-cross gap between the fast and slow lines widens. RSI 54. The Bollinger middle band around 1900 becomes a near-term defense line. 4H MACD negative histogram continues to narrow for three consecutive candles. Funding rate 0.005% is neutral to slightly low, and short-sellers still have some incentive for covering.
🎯 Direction: Go long
⚡ Entry / order placement: 1915.0575 - 1920.8200
🛑 Stop loss: 1869.0464
🚀 Target 1:
ETH2.00%
USD10.00%
View Original
post-image
  • Reward
  • Comment
  • Repost
  • Share
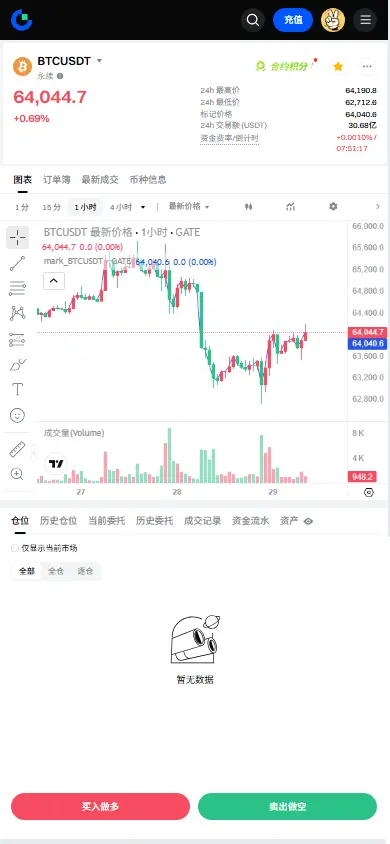
$BTC Signal】Bears are suppressing; 1H rebounds to the resistance zone
$BTC RSI 1H is 52.38, buy-side depth is imbalanced at -58%, with sell orders overwhelming the market. The 4H MACD has bearish volume contraction but has not formed a bullish golden cross. The lower Bollinger Band near 63152 is providing downside pull. The 1H rebound touched the EMA50 and the intersection area of the mid band; the funding rate at 0.01% is neutral but slightly low, lacking the momentum for a short squeeze. There are dense limit orders in the 63800-64000 range, but the take-up strength is weak.
🎯 Direction:
BTC0.99%
USD10.00%
ETH1.99%
SOL0.60%
View Original
post-image
  • Reward
  • Comment
  • Repost
  • Share
The Final Chapter of the Bitcoin Bear Market: A Data-Driven Breakdown
【Plain-Language Intro】On-chain data indicates that Bitcoin has entered the late stage of the bear market. The historical high concentration of holdings among long-term holders reached 84%, and the near end of short-term capitulation shows the market is shifting from “pain” to “accumulation.”
Although a bottoming framework is starting to take shape, key momentum and institutional capital flows have not yet broken through resistance; in the short term, downside risk still needs to be watched closely, and a full recovery will t
BTC0.98%
View Original
post-image
  • Reward
  • Comment
  • Repost
  • Share
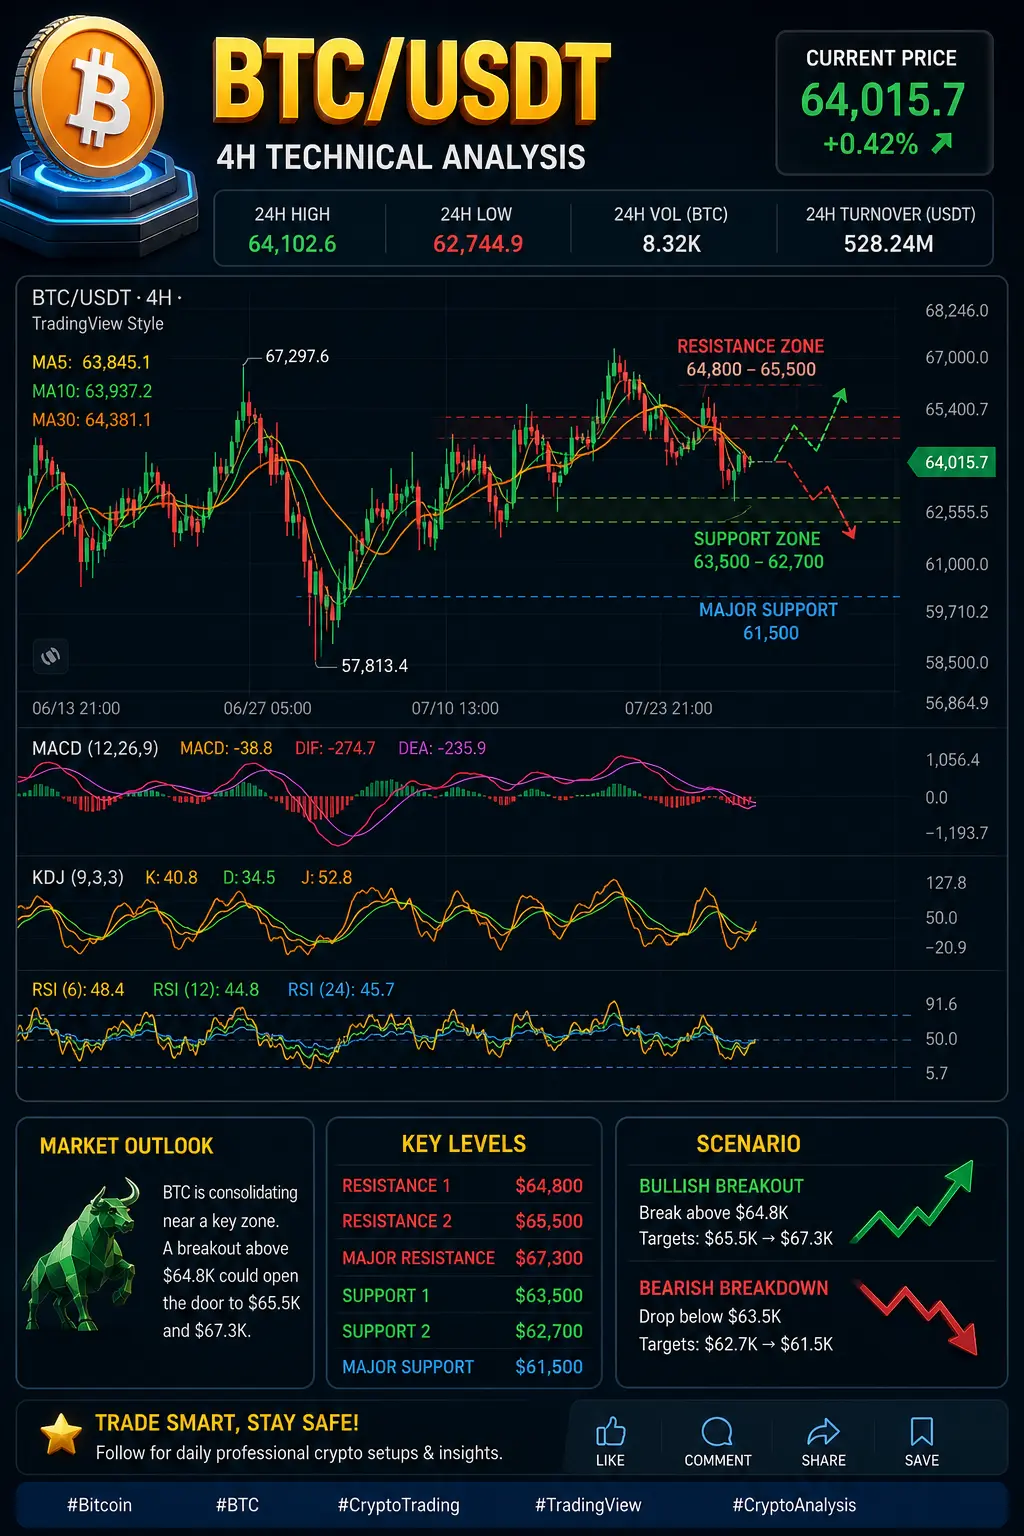
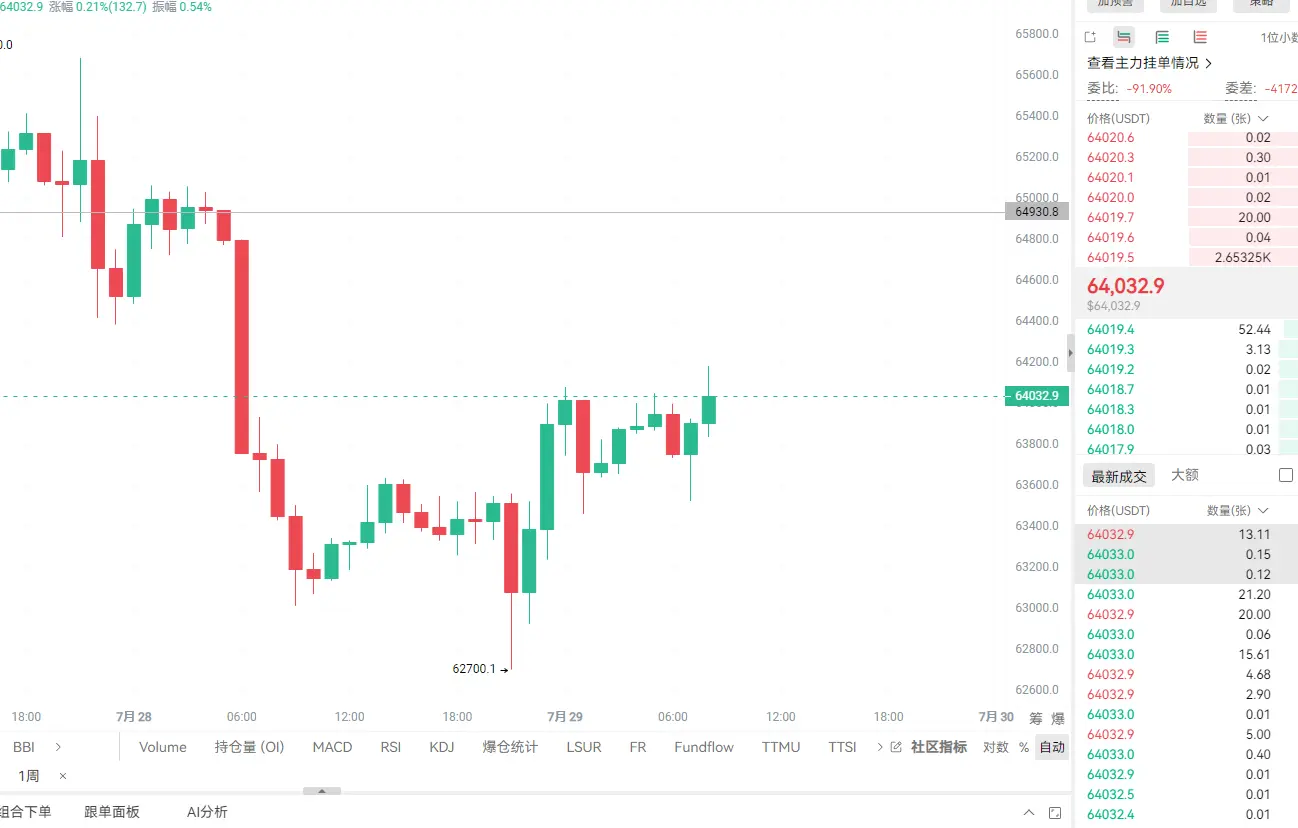
🚨 BTC at a Critical Decision Zone – Don't Miss This Move! 🚨
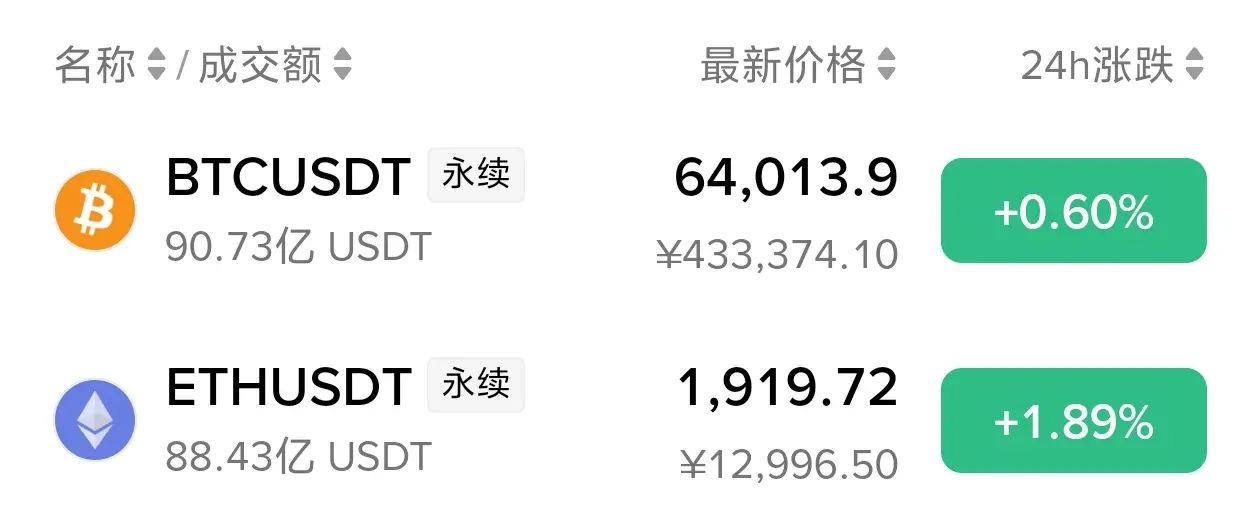
Bitcoin is trading around $64,015 on the 4H timeframe and is showing signs of consolidation after failing to hold above recent highs. A strong breakout or breakdown could decide the next major trend.
📊 Technical Analysis (4H):
Current Price: $64,015
Resistance: $64,800 – $65,500
Major Resistance: $67,300
Support: $63,500 – $62,700
Major Support: $61,500
📈 Indicators:
MA5 & MA10: Price is hovering around the short-term moving averages, showing indecision.
MA30: Still acting as dynamic resistance.
MACD: Bearish momentum is weakening
BTC0.98%
post-image
  • Reward
  • Comment
  • Repost
  • Share
BTC Key Technical Levels
Short-term 1–3 days (4H + daily)
Resistance (from near to far)
1. First resistance 64,800–65,200: the first strong resistance in the short term; this is the position the market has repeatedly tested and failed at earlier. Only if trading volume increases and price holds firmly in this range, will the short-term downward rhythm ease and upside rebound space open up.
2. Medium-term strong resistance 66,400–66,800: the daily moving-average resistance band. Once price holds here, it will be able to repair the short-term weak structure.
Support (from near to far)
1. First s
BTC0.99%
View Original
post-image
post-image
GT/USDT
Sell
Market
Order Amount
3
Avg. Fill Price
6.65
Turnover
19.95
  • Reward
  • Comment
  • Repost
  • Share
The data looks off. $SOON , with a trading volume of $100 million, pushed the price up 17% in the past 24h, but the high only reached 0.2950 and failed to break the previous high. The current price is 0.2765 and is about to become a sell-pressure zone. What’s abnormal is that the trading volume is 5x normal, but the turnover speed is too fast—the pump looks like urgent order sweeping, not a slow accumulation by institutions.
Three possible meanings: one, someone is unloading at the high point, selling while lifting, treating retail as the bagholder; two, a strong player is cleansing derivative
SOON17.38%
View Original
post-image
post-image
post-image
  • Reward
  • Comment
  • Repost
  • Share
You call this a stage play?
Damn it! A real Ultraman has slipped into a bunch of fake ones!
Guys, do you still believe in the light? 🤔
View Original
  • Reward
  • Comment
  • Repost
  • Share
Hahahahaha the best meme of today $AAPL
“Apple used AI so badly in the AI race that it won this match”
AAPL0.97%
View Original
post-image
  • Reward
  • Comment
  • Repost
  • Share
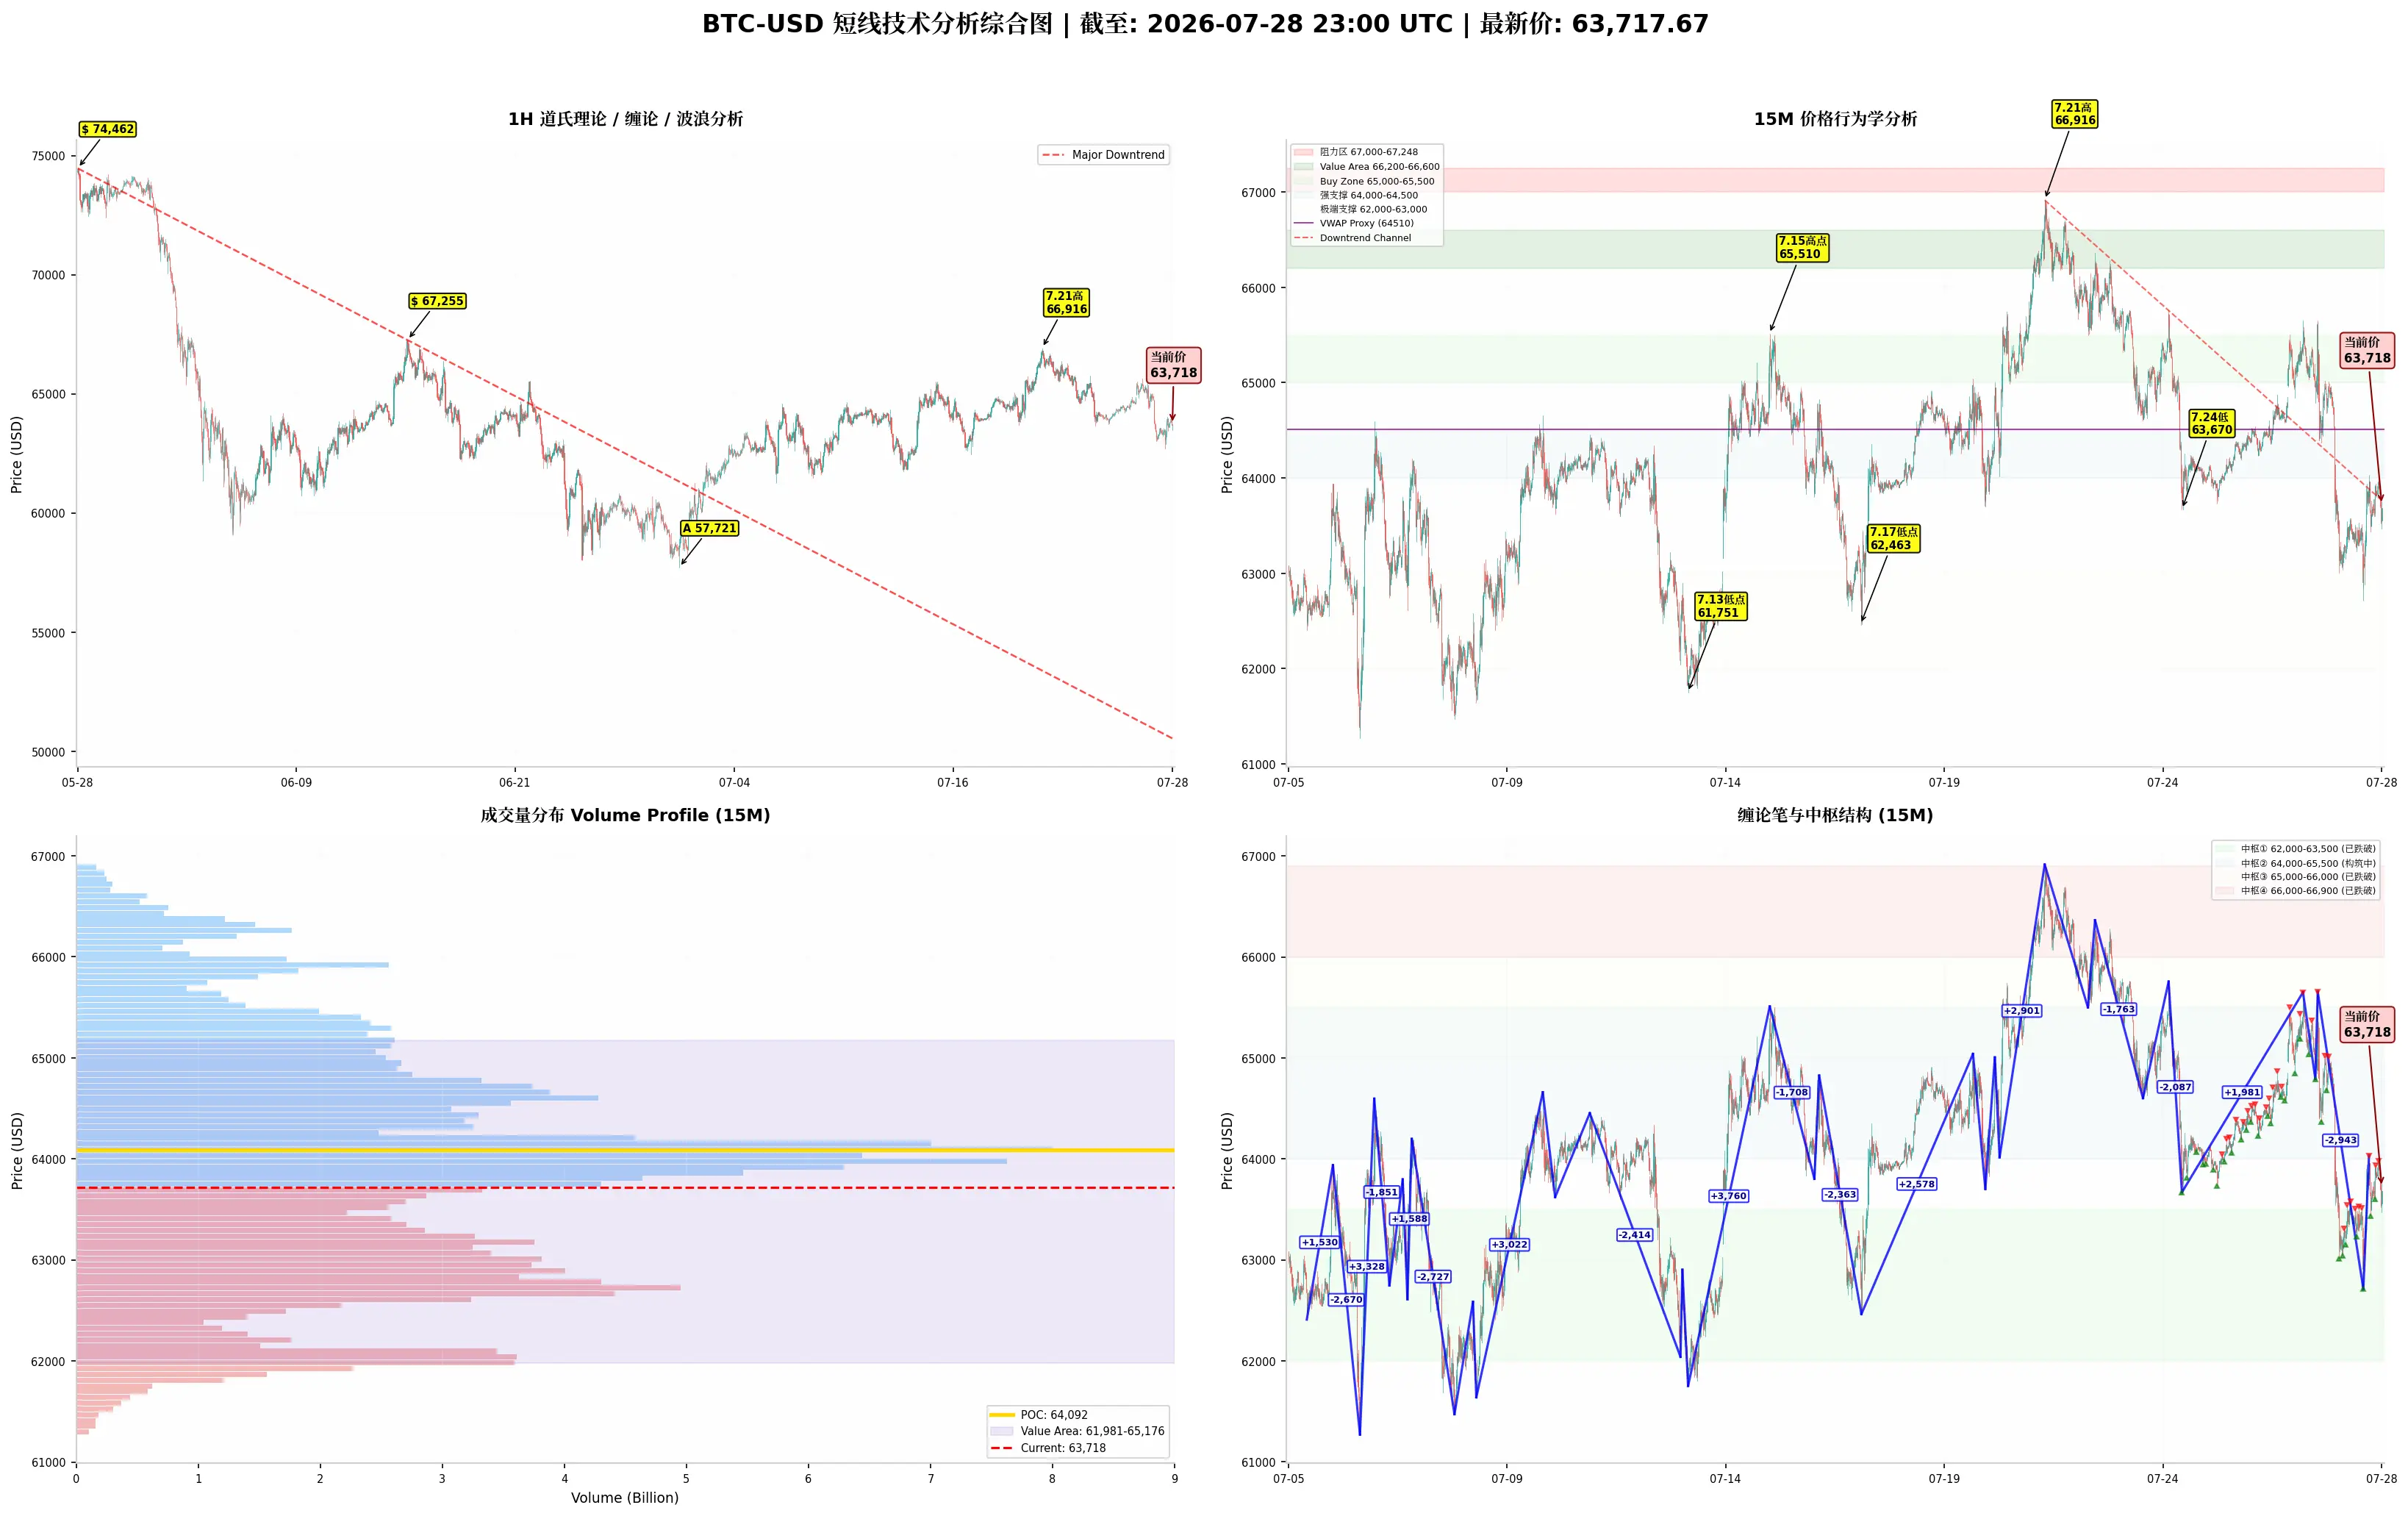
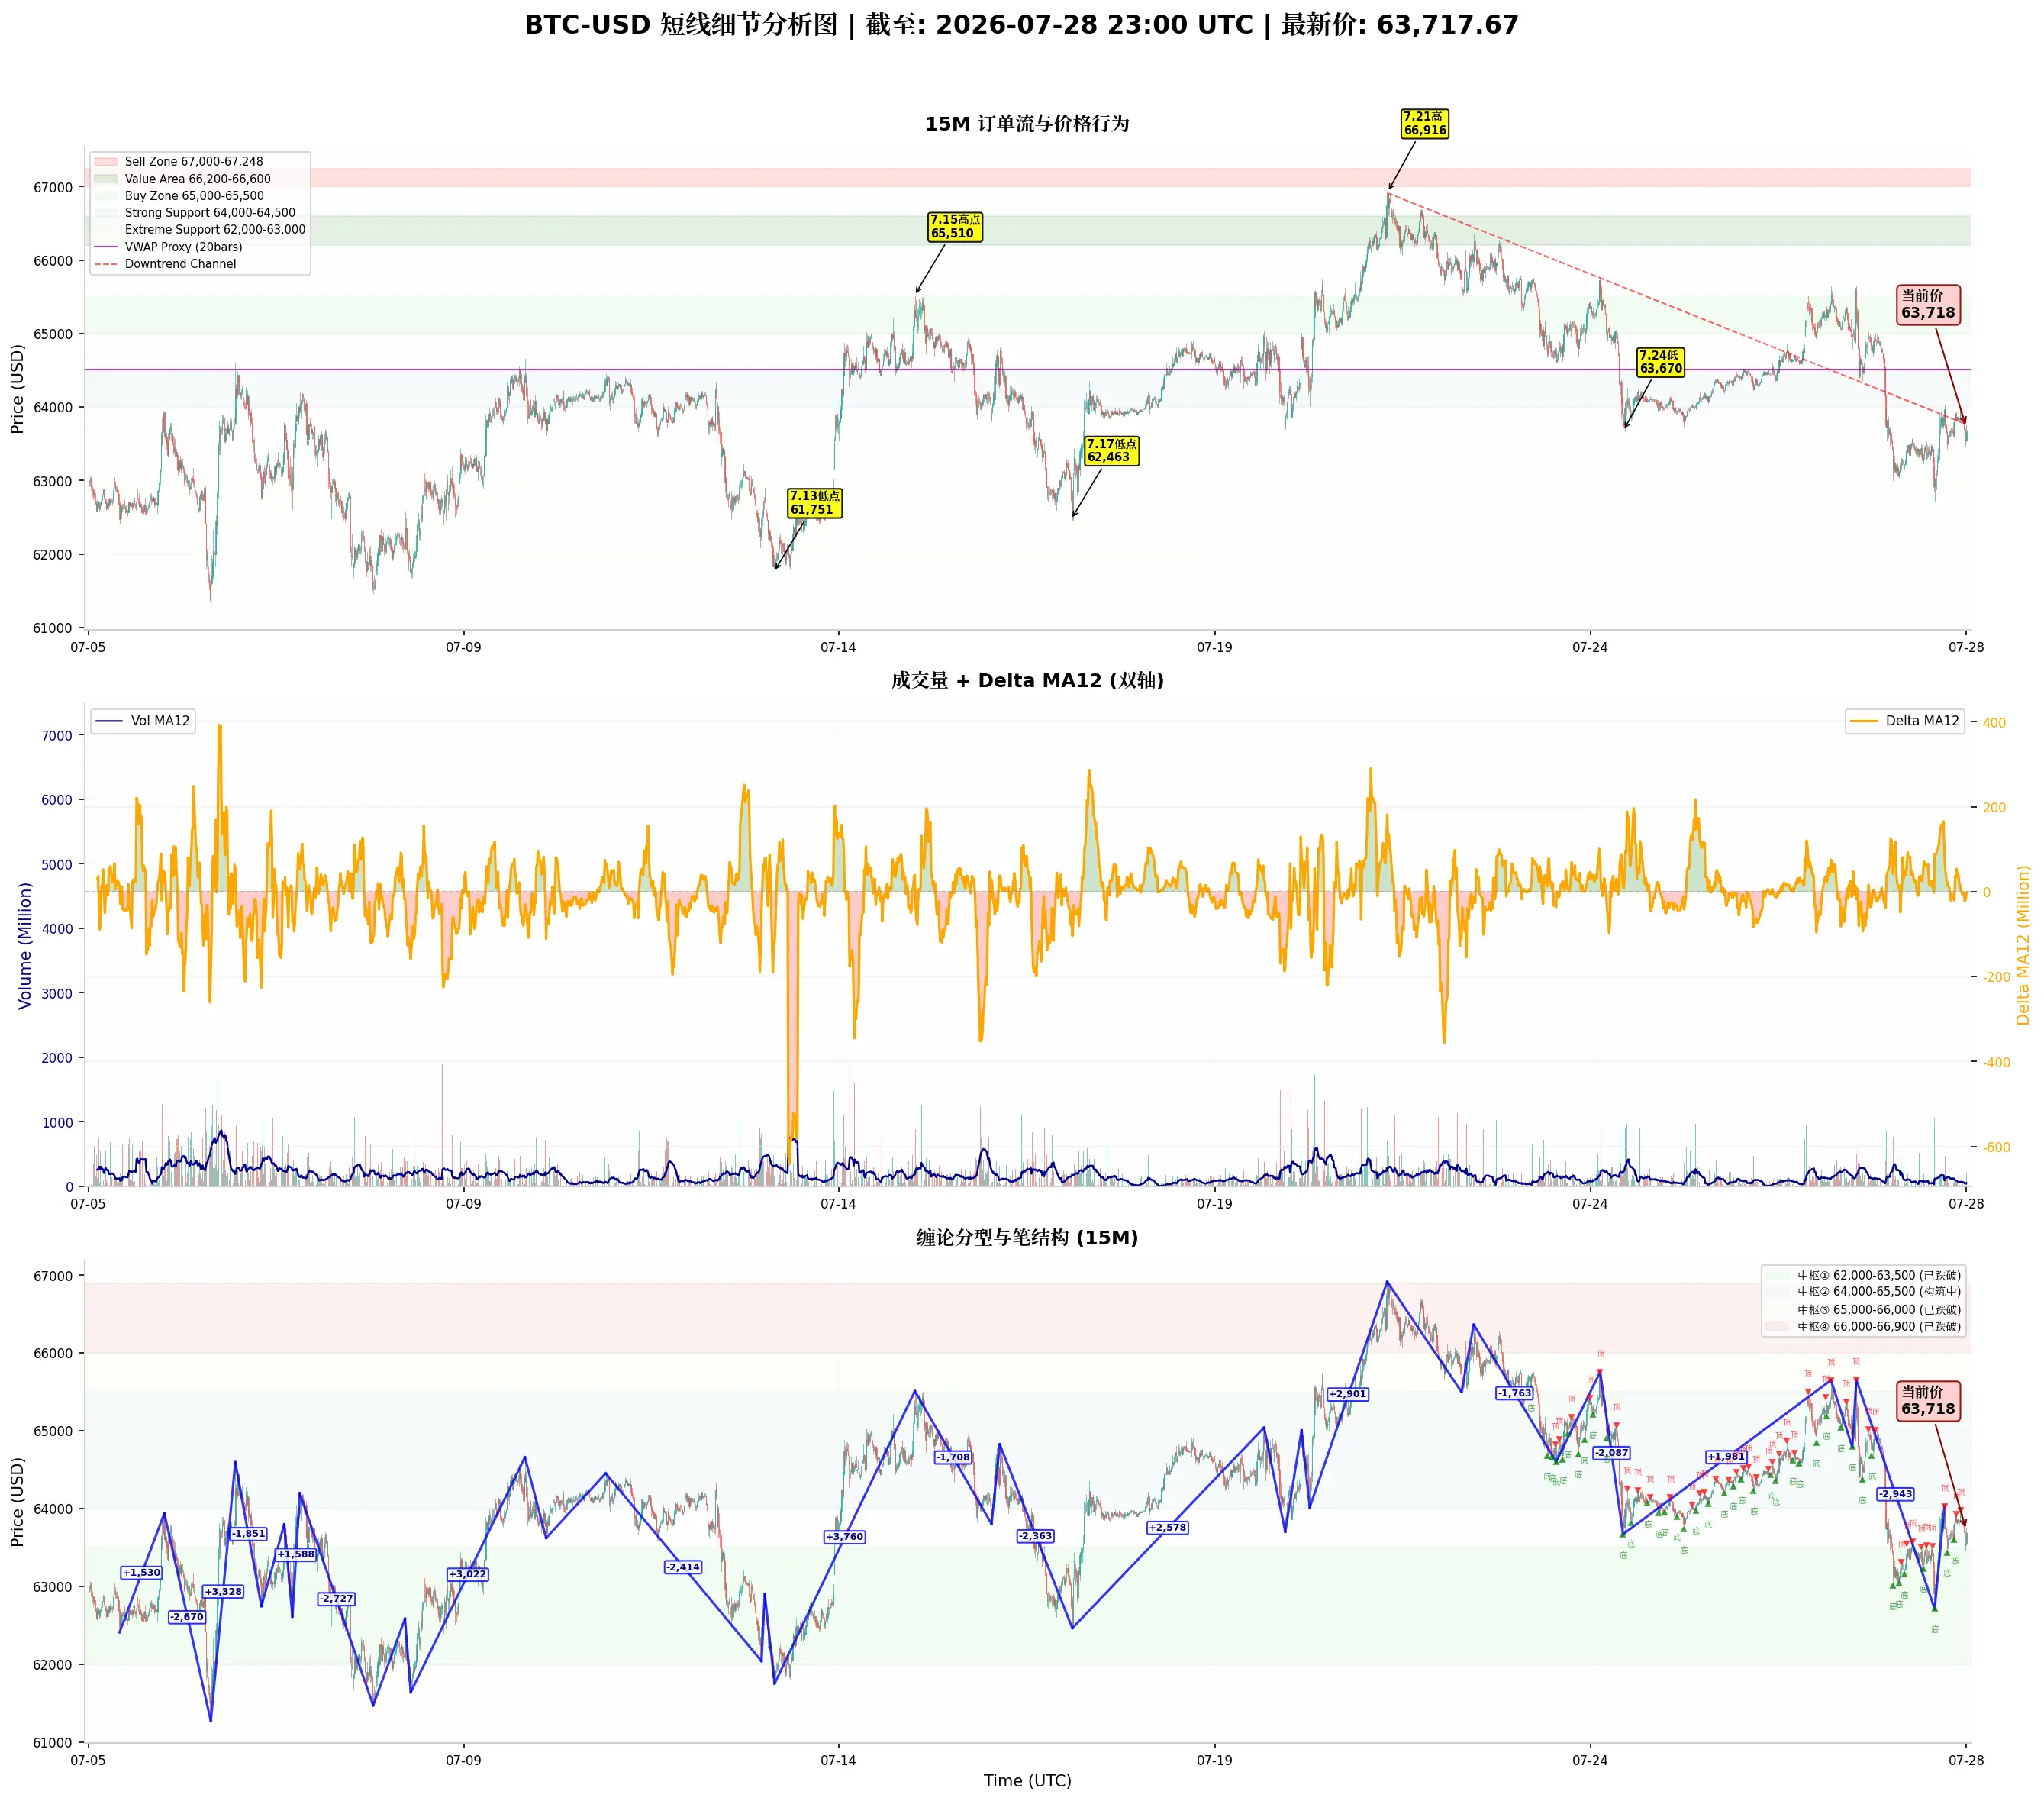
An Introductory Analysis of BTC Short-Term Trends from Dow Theory, Chan Theory, Elliott Wave Theory, Volume-Price Relationship, Order Flow, and Price Action
$BTC #BTC 1. Dow Theory
Major trend (1-hour timeframe): The main downtrend that began from the historical high of 74,462 on May 28 is still ongoing. After the price fell from 74,462 through the June 15 secondary high of 67,255, it dropped all the way to the July 1 low of 57,721, for a cumulative decline of 16,741. After bottoming on July 1, the bulls launched an ABC rebound (Wave A 64,597 → Wave B 61,471 → Wave C 64,660). After the end
BTC0.99%
View Original
post-image
post-image
  • Reward
  • Comment
  • Repost
  • Share
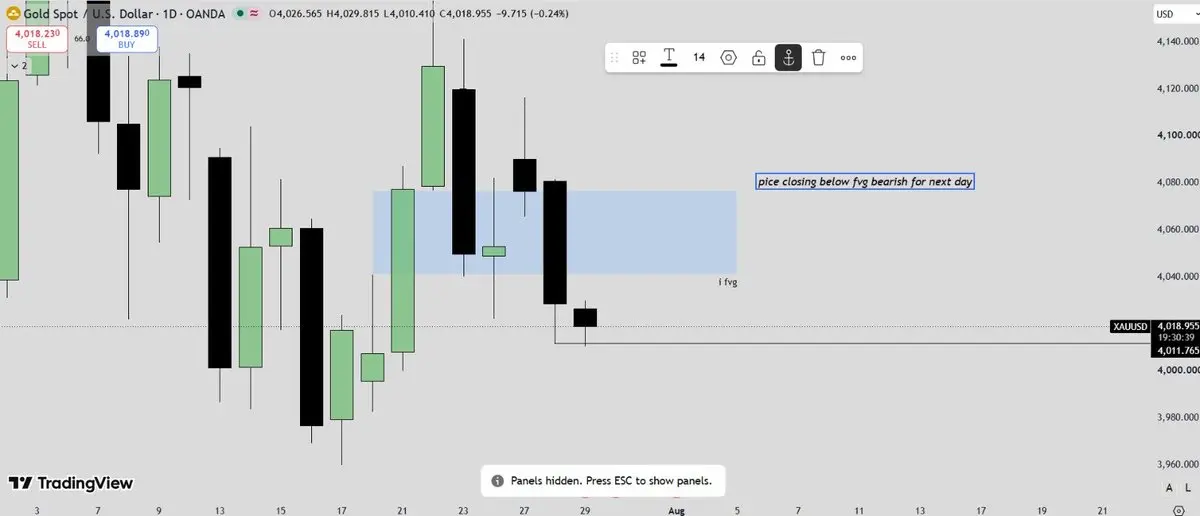
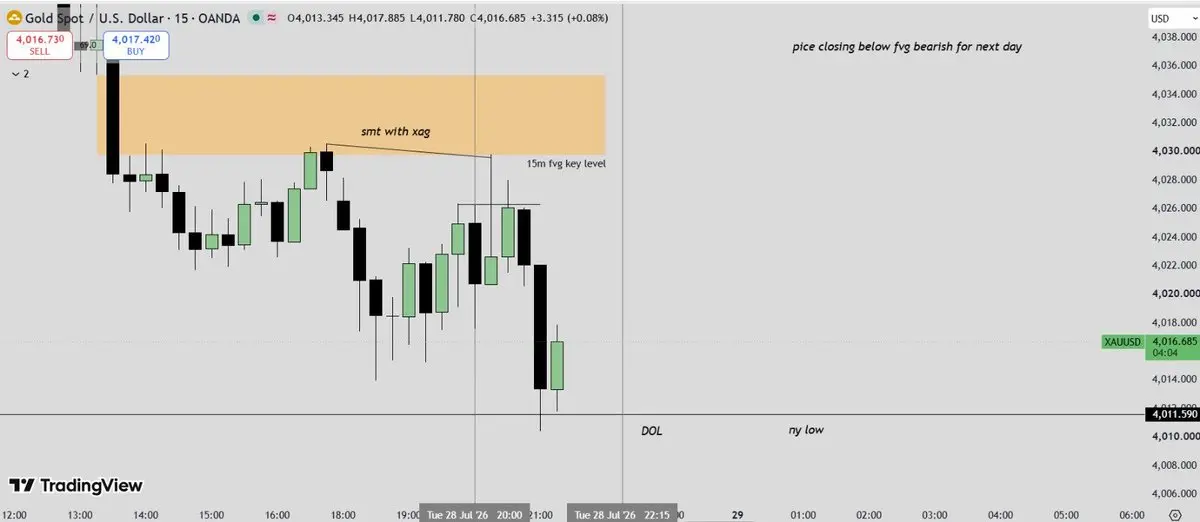
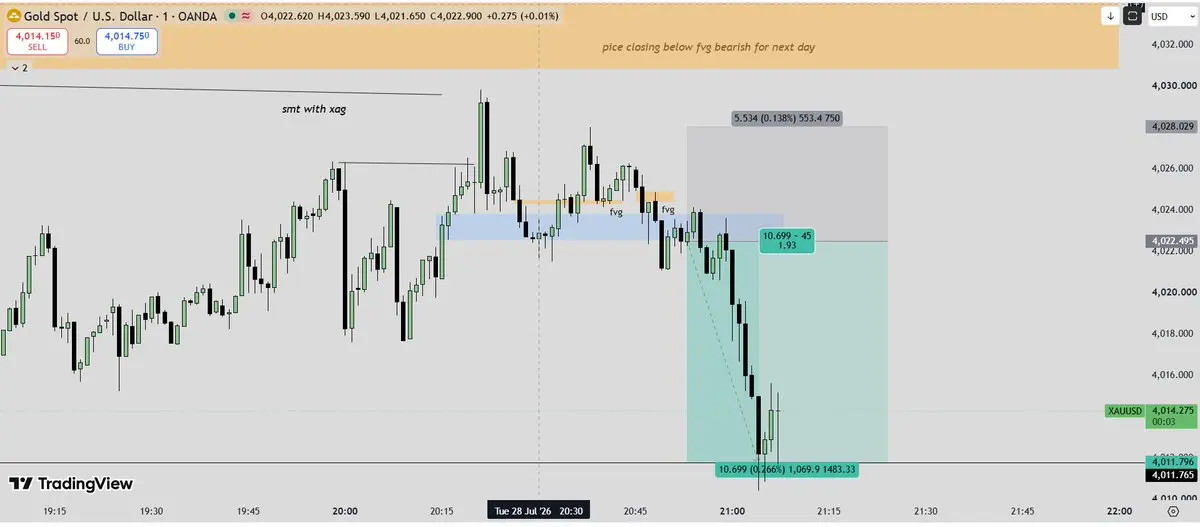
Daily iFVG gave the bias.
NY Low was the DOL.
15m liq sweep + SMT with XAG.
1m Asia entry off iFVG & FVG.
Price closed into the move.
Top down. No guesswork. 📉
XAG-0.49%
post-image
post-image
post-image
  • Reward
  • Comment
  • Repost
  • Share
At the daily level, wedge momentum/energy still dominates. The price closes with a lower shadow, forming a doji-like star and a small bullish candle. Below, short-term follow-through from buy orders caused the pullback, but it didn’t sustain; however, the bullish candle body is weak—only a slight stabilization after the decline, without reversing the larger wedge structure.
On the four-hour cycle, the wedge sell pressure is contracting; price is oscillating upward. This is a technical rebound and repair, not a bullish reversal, and it faces resistance above. On the hourly level, wedge power ma
BTC0.98%
ETH1.99%
View Original
post-image
  • Reward
  • Comment
  • Repost
  • Share
Unbox Therapy 👻
post-image
  • Reward
  • Comment
  • Repost
  • Share
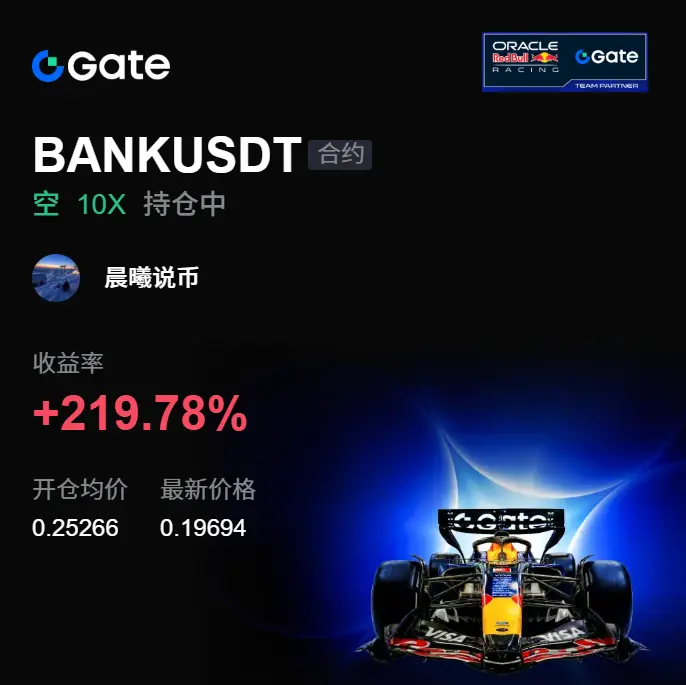
Many opportunities don’t appear out of nowhere—they build up slowly when nobody is paying attention. This time, $BANK ’s rebound has been getting weaker and weaker; signs of pressure at the high end are gradually becoming clear. Once it’s confirmed, the logic for going long will also be in place.

I opened a long around 0.25266. During the process, I wasn’t just expecting the price to drop quickly—instead, I observed whether each rebound had real support. Then the price reached 0.19651, and +220.45% started to be realized.

In trading, judgment is only the starting point; holding the rhythm
BANK-40.96%
BTC0.99%
ETH2.00%
View Original
post-image
  • Reward
  • Comment
  • Repost
  • Share
JUST IN: Robinhood CEO Vlad Tenev says his X account was hacked last week via social engineering, with posts about a so-called Vladhood token. Security teams moved fast and added protections. $VLAD?
HOOD-3.01%
post-image
  • Reward
  • Comment
  • Repost
  • Share
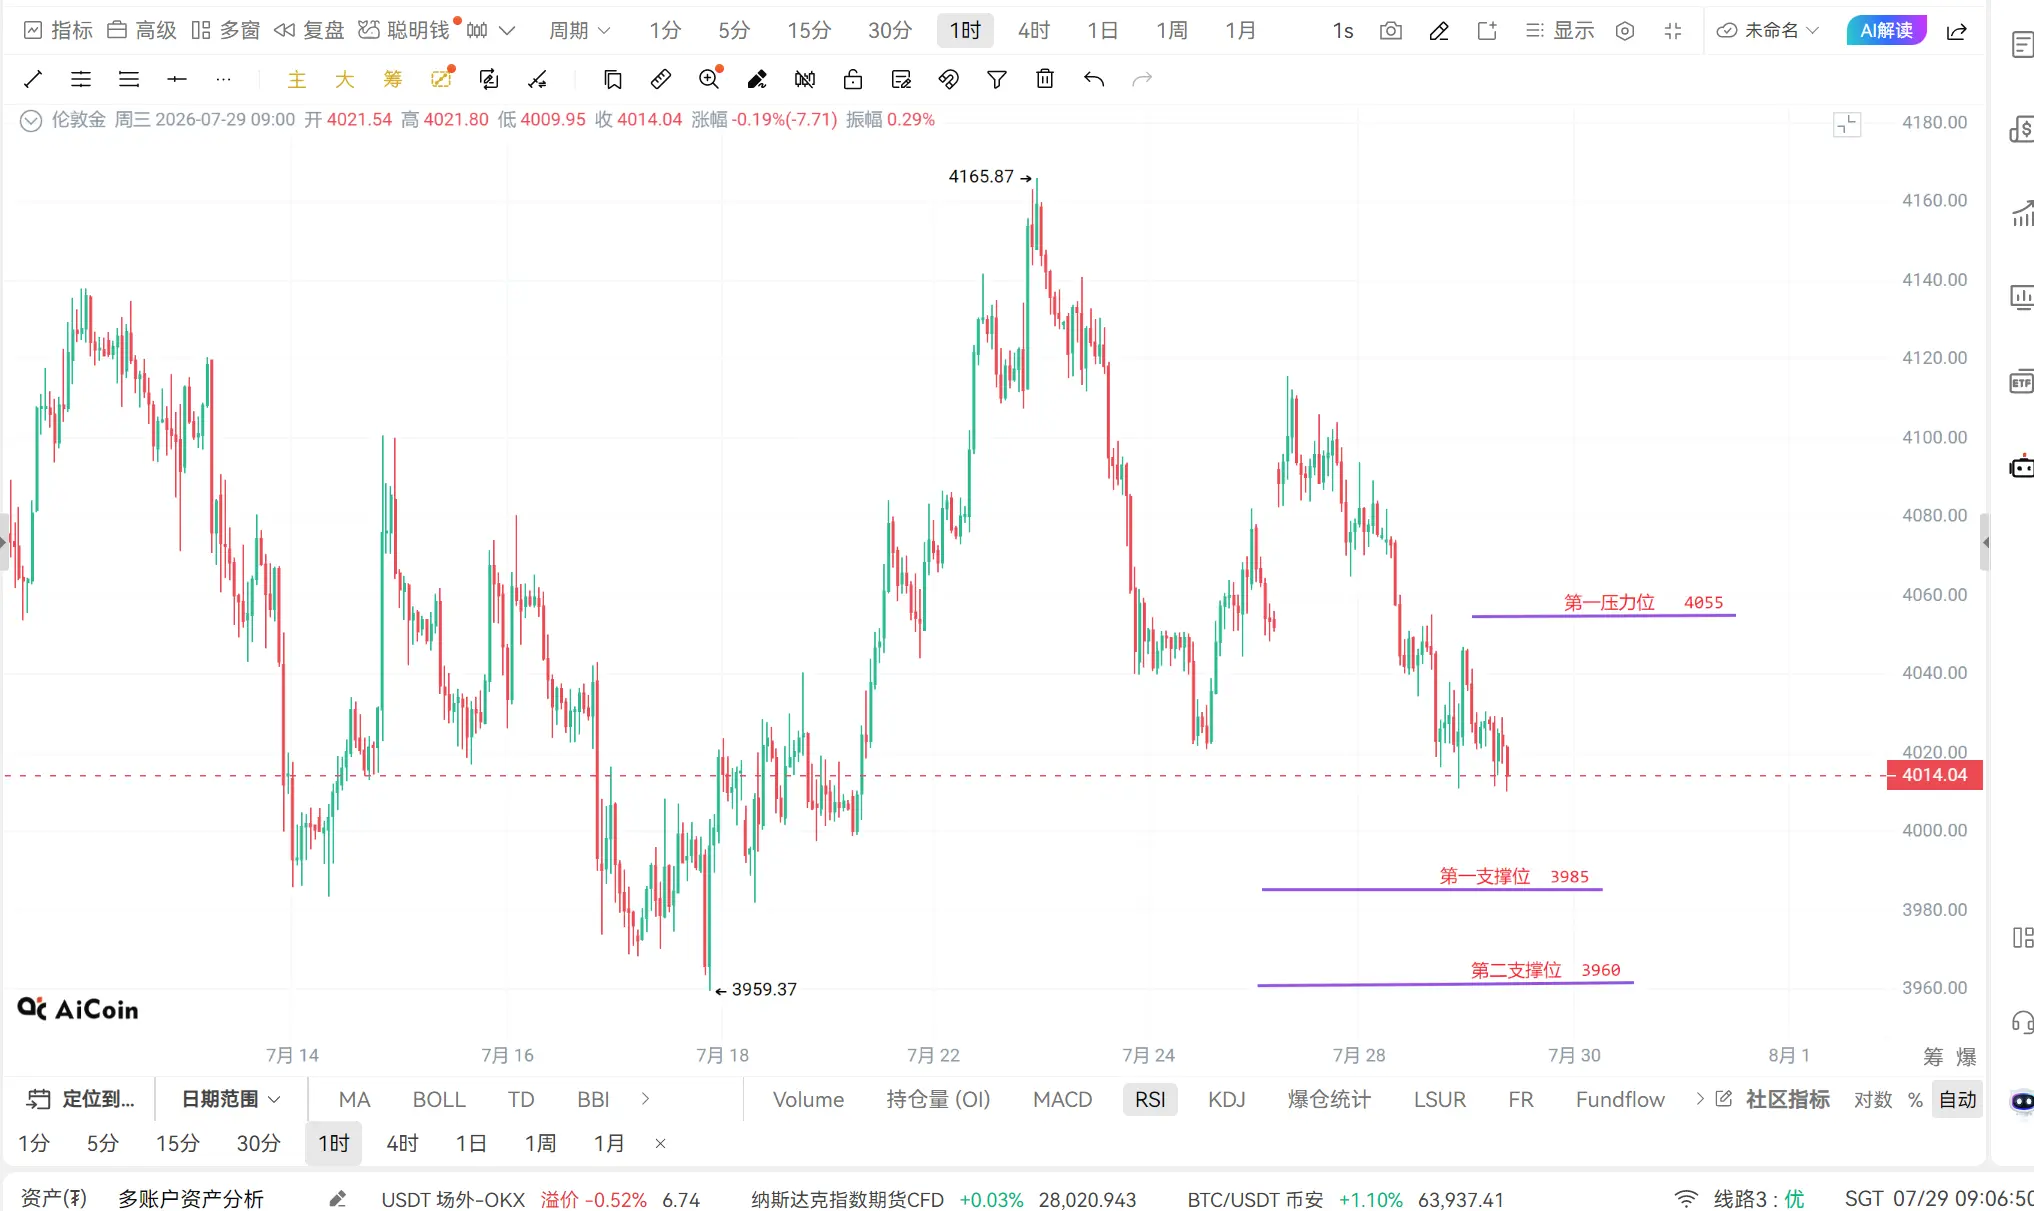
July 29, 2026 Market Analysis:
XAU: Yesterday, the “yellow fish” longs entered at 4040 and 4020 respectively. They only ate a small move of 10 points each, totaling 20 points. As in yesterday morning’s analysis, with this kind of market, you basically can only trade short-term scalps on the 5-minute timeframe. Today’s market is similar: both longs and shorts are not easy to play, so the main focus is still scalping around key levels on the 5-minute timeframe. For longs, you can try at 3985 and 3960. For shorts, it’s more prudent to look around 4055.
ETH: Yesterday the community calls were long
ETH2.00%
XAUUSD-0.06%
View Original
post-image
post-image
  • Reward
  • Comment
  • Repost
  • Share
BTC is now around 63.8 thousand, up slightly by 0.3% today. After the past two days smashed down to that key support at 63.5 thousand, this time it seems to have held and not continued to break down.
Over the week, it’s still down, down 4%, but looking back over a month the upside has actually expanded: it’s up to 8.2%. This suggests that the monthly chart’s base is firmer than previously thought. The 24-hour high is 64 thousand, the low is 62.8 thousand. Today it first dipped down and then rebounded, a typical bottoming reversal.
That support area I’ve been watching—between 63.5 thousand and
BTC0.98%
View Original
post-image
  • Reward
  • Comment
  • Repost
  • Share
eSports Industry Attracts New Investment! Can Crypto Join the Trend?
gate liveLIVE
1,563
  • Reward
  • Comment
  • Repost
  • Share
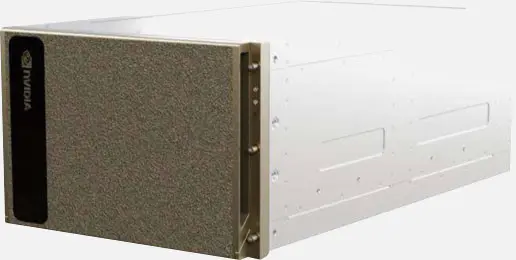
costed out hw to run kimi-k2 locally today
actually feasible from a residence
SOVEREIGN INFERENCE
post-image
post-image
  • Reward
  • Comment
  • Repost
  • Share
Xiaomei, are you trying to go to the sky by playing like this?
View Original
post-image
  • Reward
  • Comment
  • Repost
  • Share
Load More

Join 40 M users in our growing community

⚡️ Join 40 M users in the crypto craze discussion
💬 Engage with your favorite top creators
👍 See what interests you
  • Pinned