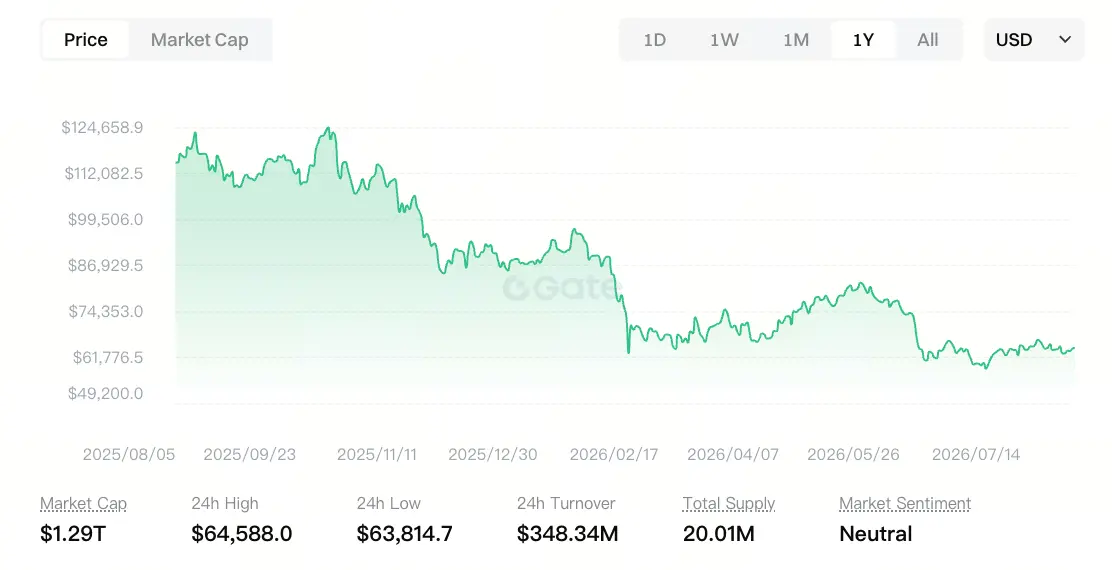
Source: Gate 行情数据
Macro level: Subtle changes in the dollar and interest rates
After the Strait of Hormuz negotiations released signals of easing, the plunge in oil prices reduced inflation concerns and curbed expectations that the Fed would raise rates more than once this year. The DXY moved sideways near the 100 level and closed down 0.09% at 99.87. A weaker dollar and cooling rate expectations theoretically provide valuation support for Bitcoin, which is denominated in dollars. However, this transmission has not materialized immediately in Bitcoin—BTC is currently more constrained by structural factors within the crypto market.
Capital flows: ETF inflows recover, but strength remains uncertain
Spot Bitcoin ETF flows are a key indicator of institutional demand. At the beginning of August, the Bitcoin ETF market got off to a relatively strong start. On August 3, Bitcoin ETFs attracted approximately $170.1 million in net inflows in a single day, reversing the weekly outflow trend seen at the end of July. BlackRock’s IBIT led the group with approximately $111.4 million in inflows, accounting for nearly two-thirds of total inflows.
More recent data shows that Bitcoin ETF flows remained positive for two consecutive trading days. On August 4, total net inflows were approximately +$211.5 million, equivalent to roughly 2.65K BTC, while BlackRock’s IBIT contributed approximately +$170.3 million, or roughly 2.65K BTC. Other major buyers included Fidelity’s FBTC, ARK 21Shares’ ARKB, and Bitwise’s BITB.
The signal from this data is that institutional demand is returning, but its strength is still insufficient to be called “active institutional accumulation.” BlackRock’s participation in the inflows on the latest trading day has not been confirmed. If its absence is confirmed later, it would mean that incremental capital may be more concentrated among small and midsize funds.
On-chain data: Bitcoin’s true health
On-chain data provides an important perspective for observing the internal structure of the Bitcoin market. MVRV (Market Value to Realized Value) is a key indicator for measuring the market’s overall profit level. Near the lows in the first half of 2026, MVRV had compressed to approximately 1.1–1.2, with some sources showing a level close to 1.135, meaning that the average holder’s paper profit was less than $8,000. By May, MVRV had recovered to 1.445. The MVRV level corresponding to the current price of $64,432 remains in the neutral range.
An SOPR (Spent Output Profit Ratio) reading above 1.0 means that sellers are profitable overall. The current SOPR is hovering near 1.0, indicating that the market has not experienced panic selling but has also not entered a state of broad profitability. LTH-SOPR (Long-Term Holder SOPR) is a signal worth watching—long-term holders were still selling at a loss in late April but had quickly shifted to selling at a 33% profit by early May. This rapid shift “from capitulation to rebound” often occurs during the early stages of a change in market sentiment.
Regarding exchange balances, approximately $220 million worth of BTC flowed into major exchanges over the past 24 hours, representing a moderate increase in exchange supply. The specific one-day figure varies slightly depending on the statistical window, but net inflows on the scale of several thousand BTC have indeed occurred recently. In the crypto market, on-chain asset inflows into exchanges are typically interpreted as a potential precursor to selling. This volume does not constitute a signal of large-scale dumping but falls into the “moderate loosening” category—indicating that around $64,000, some holders have an incentive to take profits or reduce their positions. It is worth noting that ETH recorded net outflows during the same period, indicating tightening supply. Overall, BTC and ETH showed divergent characteristics, reversing the previous pattern of large-scale inflows and presenting a supply-tightening signal that demonstrates divergence in on-chain behavior among different assets.
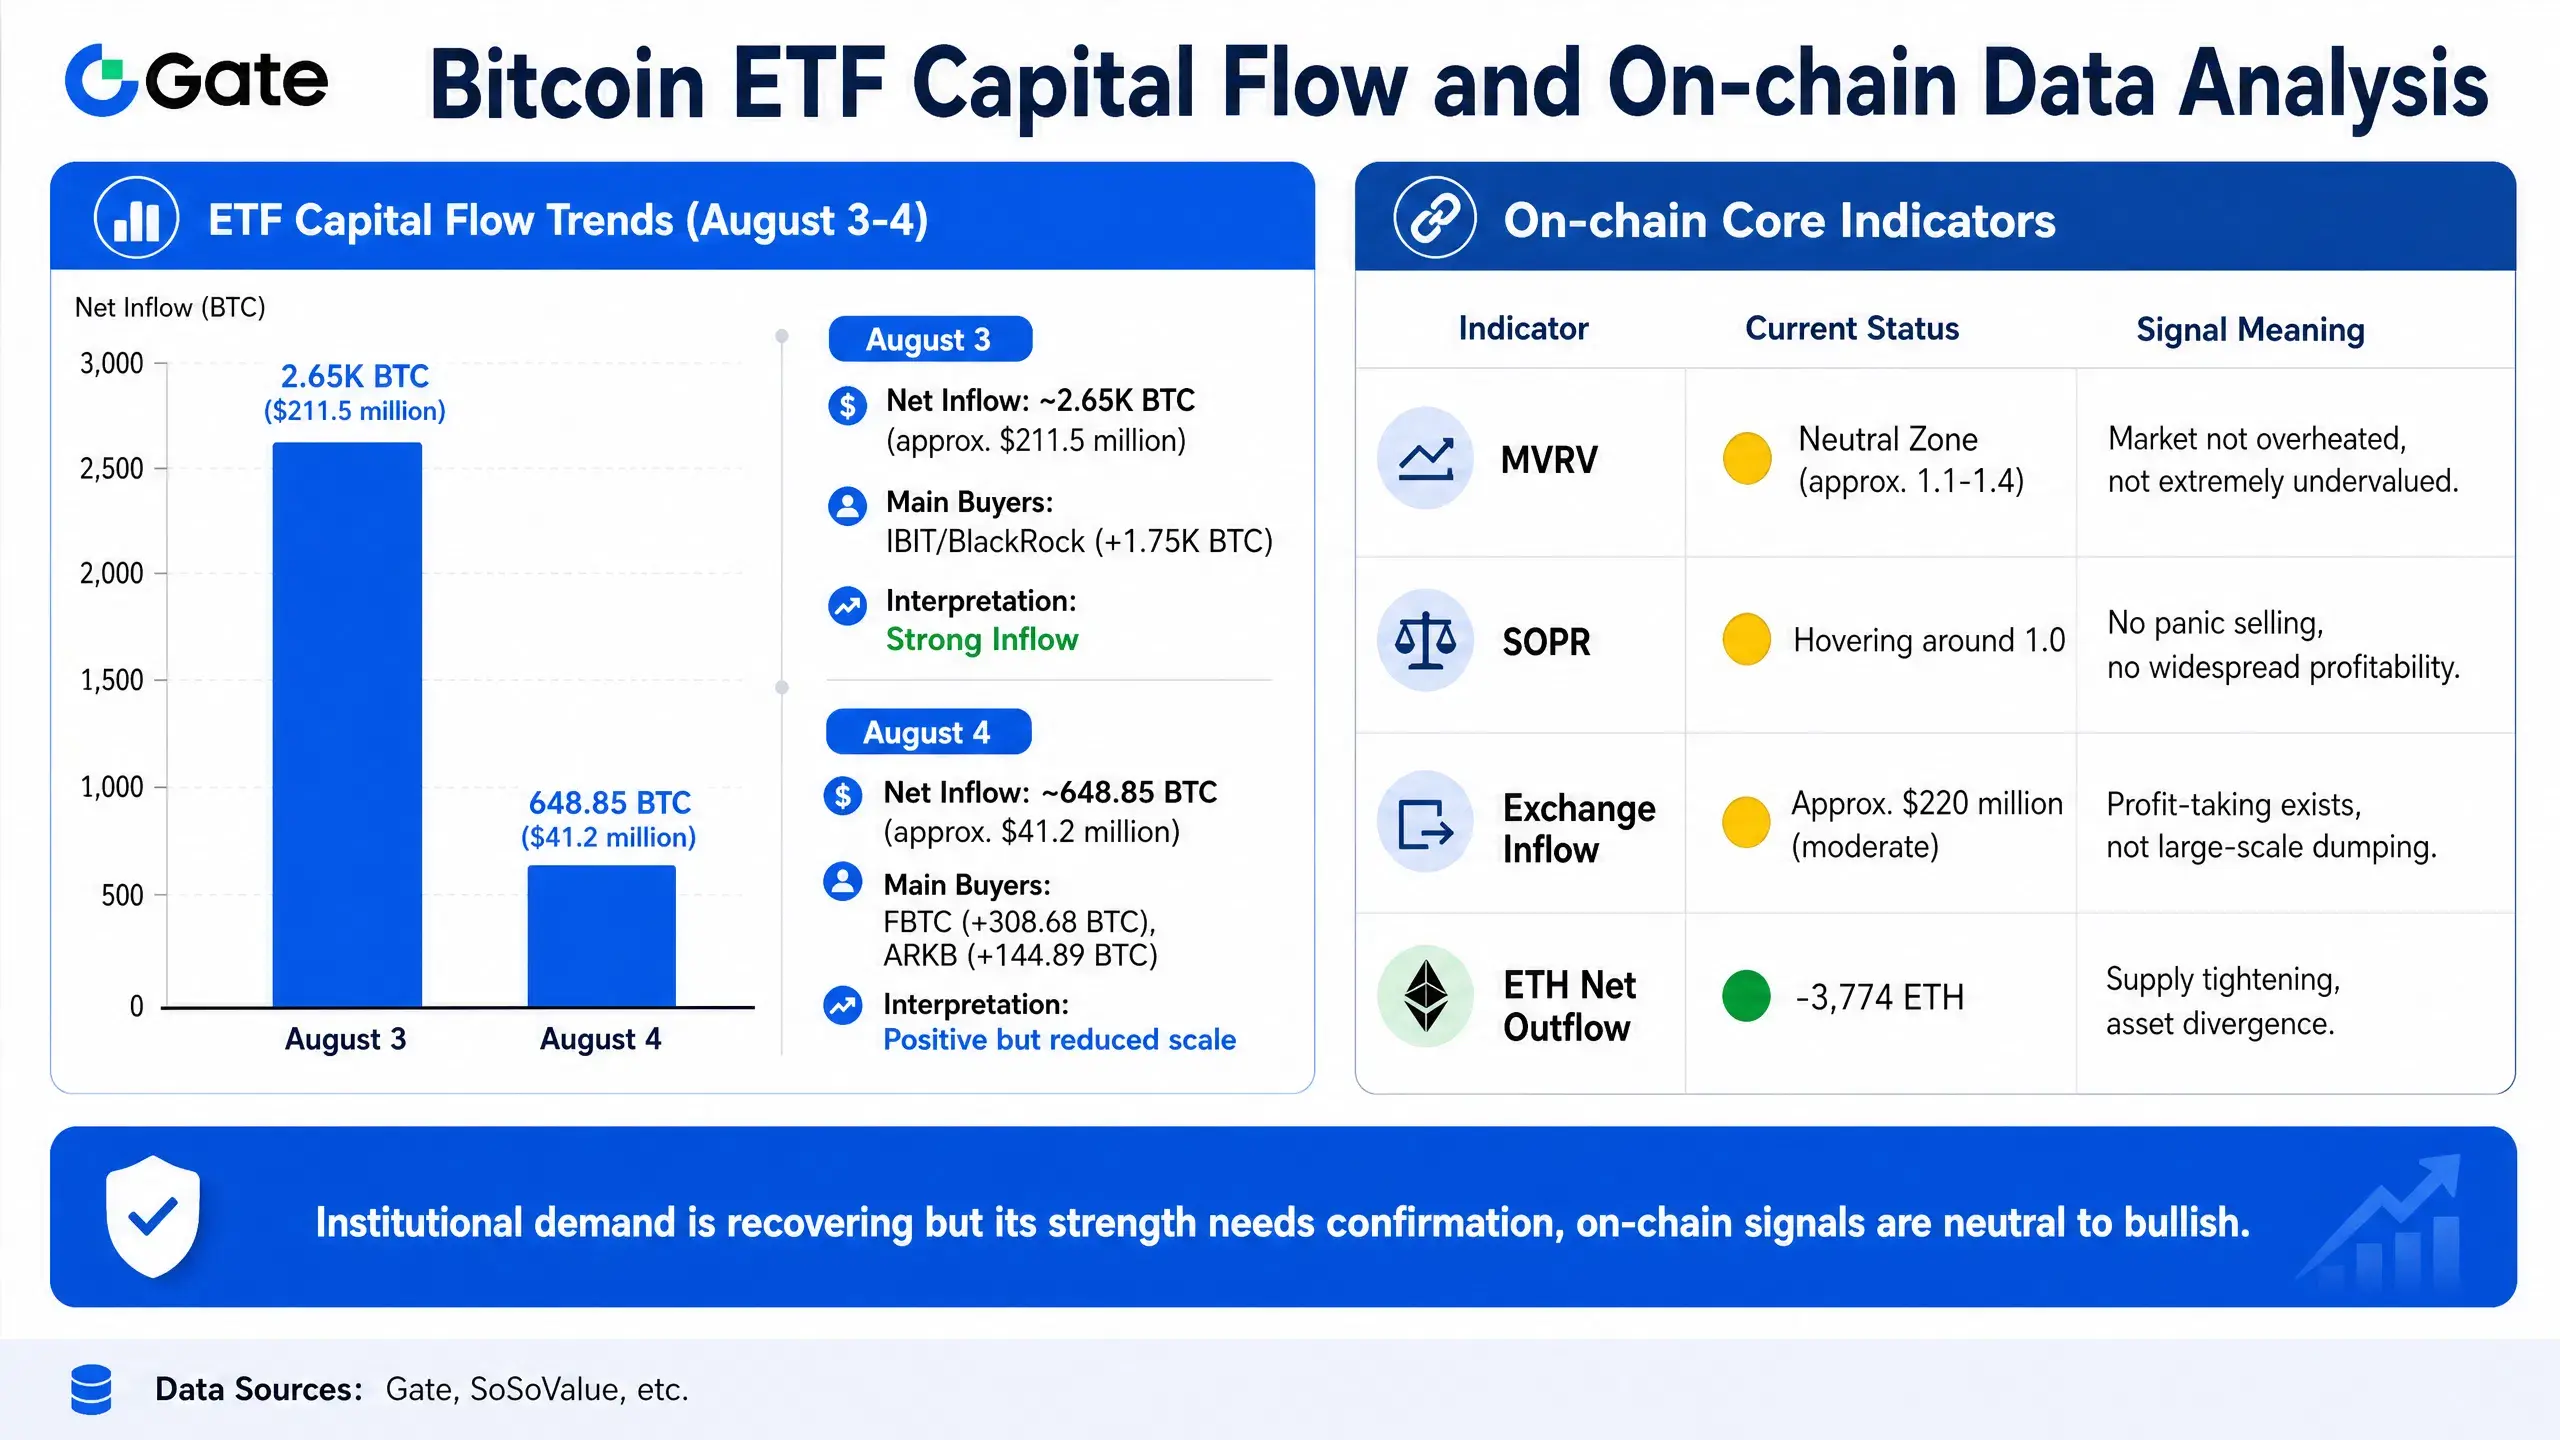
Two-column chart of Bitcoin ETF flows and on-chain data
Overall assessment: Bitcoin is caught in a battle between bulls and bears
When the three layers are considered together, Bitcoin is currently in a relatively conflicted position:
At the macro level, a weaker dollar and falling real interest rates provide medium-term support, but this transmission takes time. In terms of capital flows, ETF net inflows have remained positive for consecutive days, but their strength has not reached historical levels sufficient to drive a breakout. On-chain, MVRV and SOPR are both in neutral ranges. Although exchange inflows have increased moderately, no extreme selling signal has appeared.
One possible scenario is that if the strait agreement is ultimately implemented, falling oil prices cool inflation expectations, the Fed sends a more dovish signal, and improved liquidity is transmitted to the crypto market, Bitcoin could receive upward support. However, if implementation of the agreement encounters setbacks and geopolitical risks rise again, Bitcoin could simultaneously face the dual pressure of “safe-haven funds flowing into gold” and “declining risk appetite.”
Conclusion
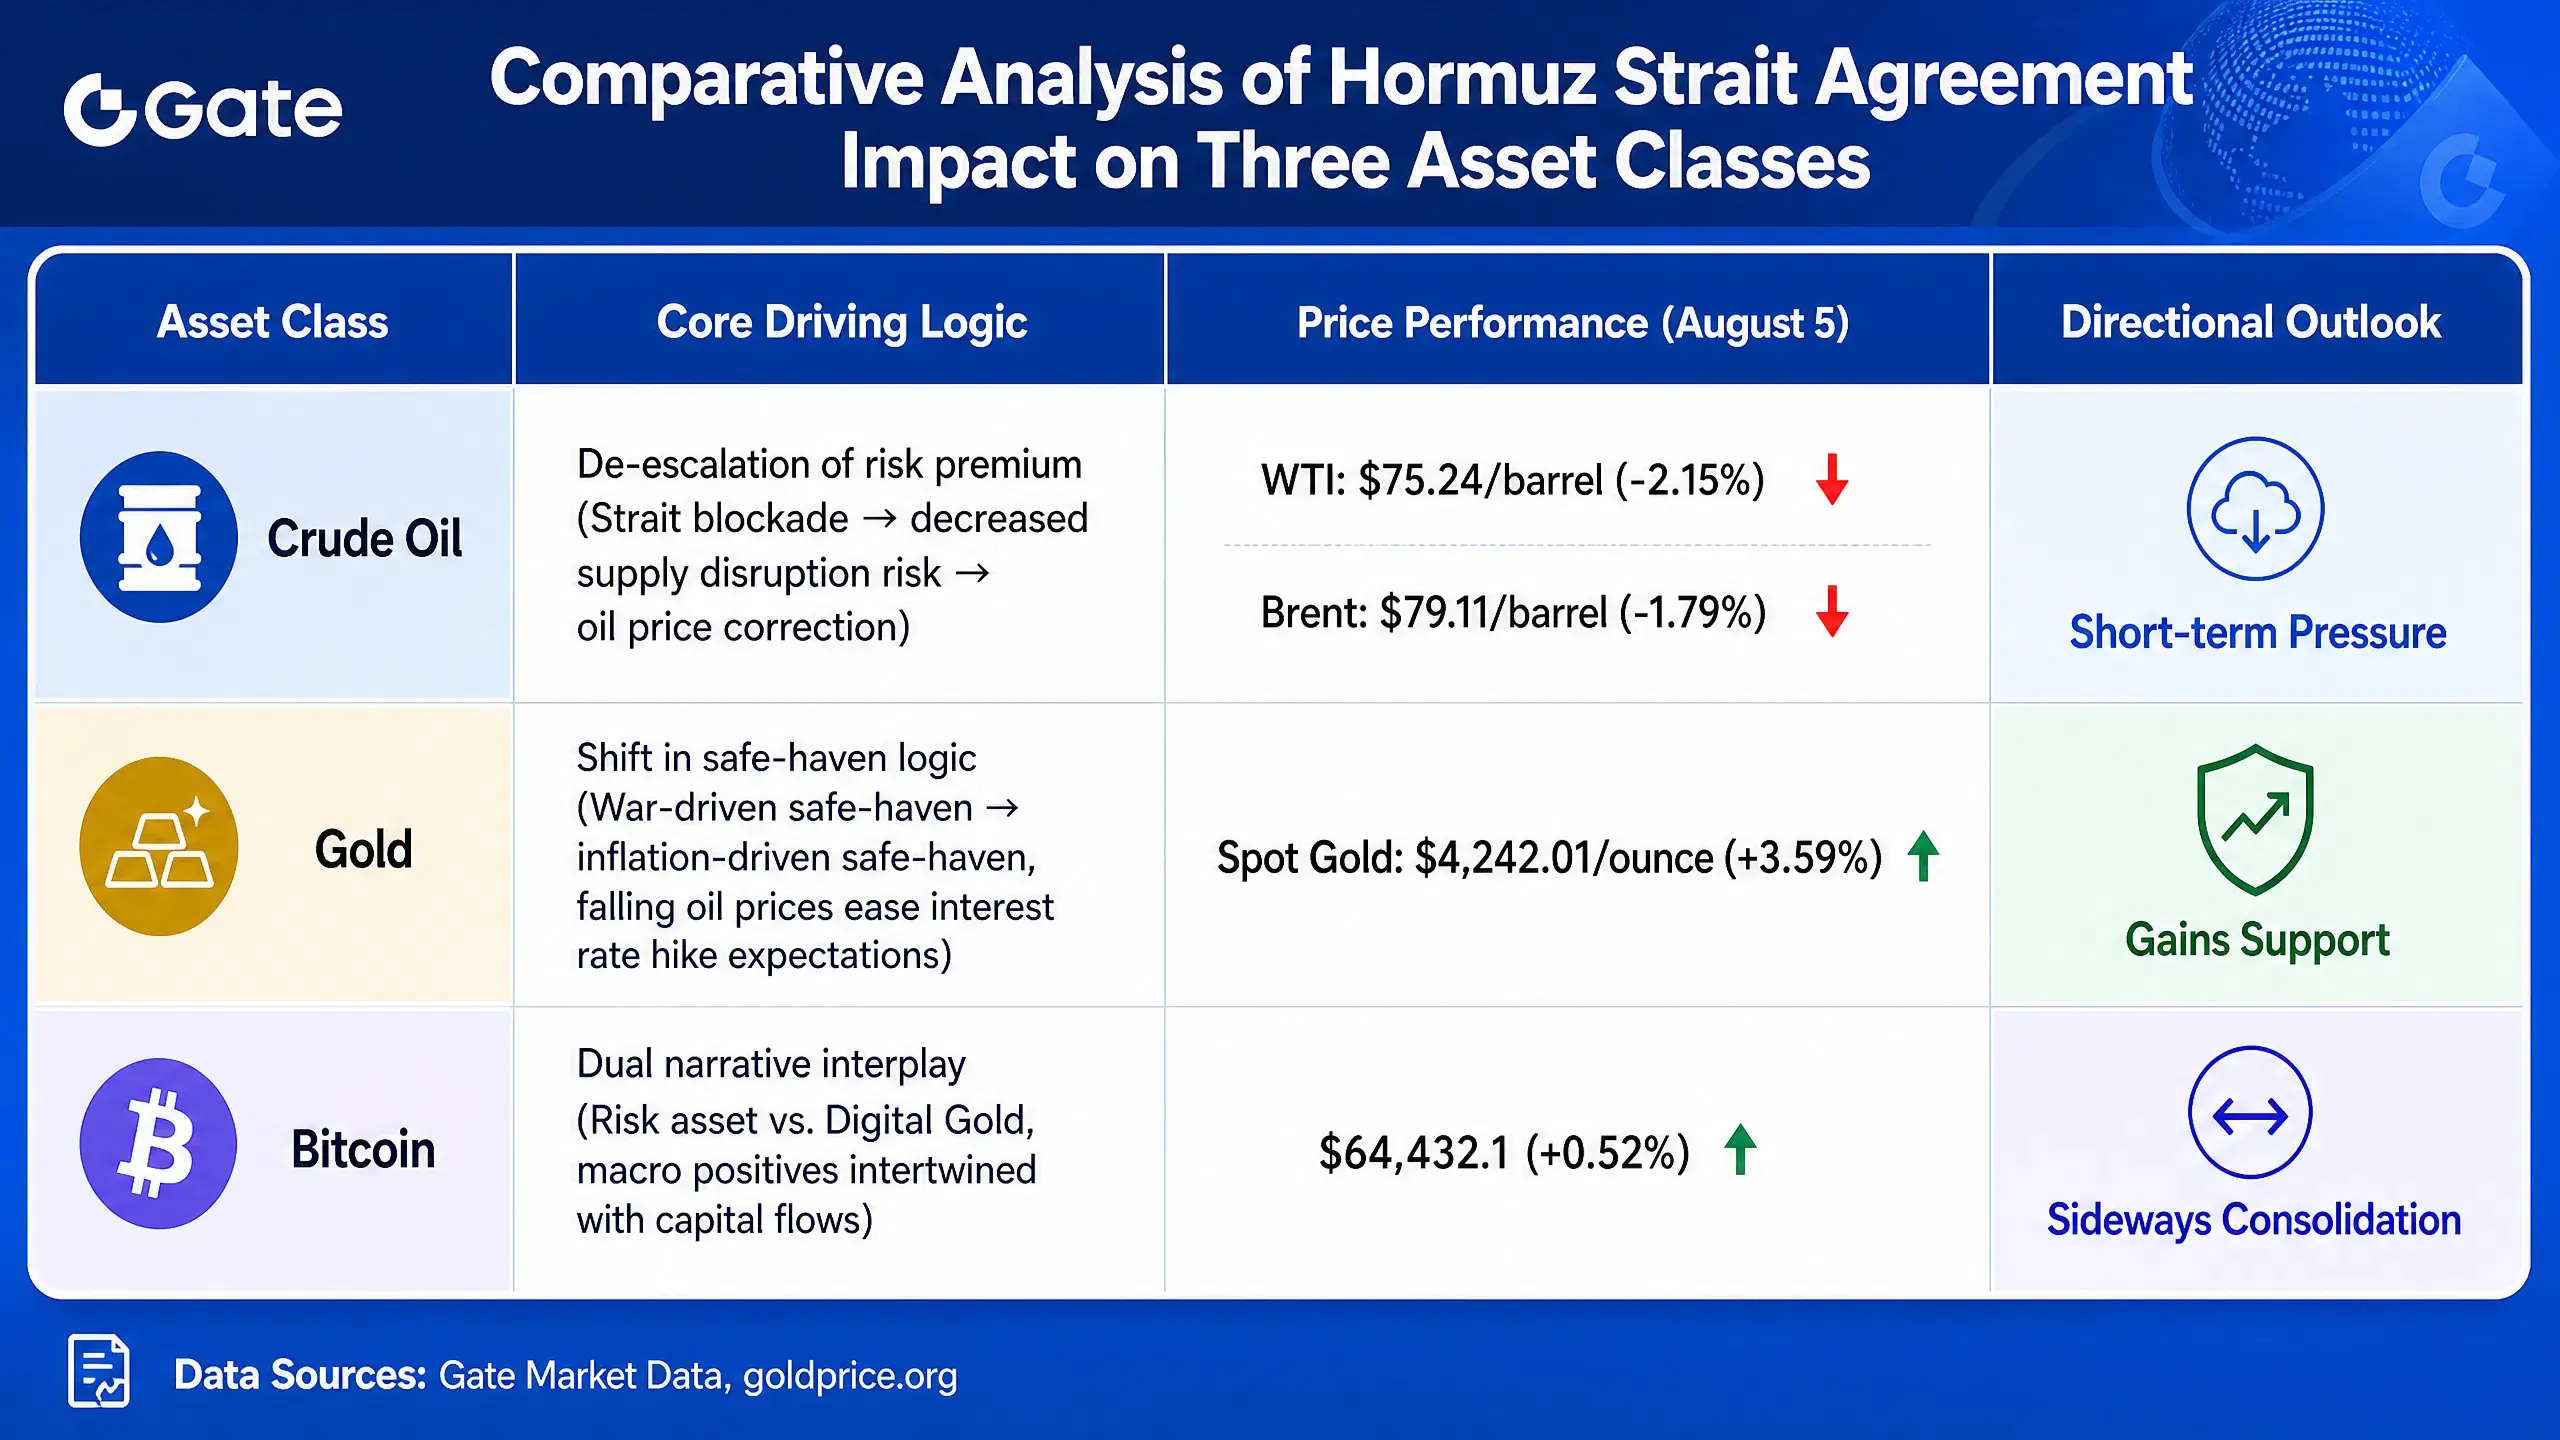
The trajectory of the Strait of Hormuz agreement is essentially a process in which global assets reprice geopolitical risk premiums. Crude oil faces the most direct pressure from the retreat of the risk premium; gold gains new support as safe-haven logic shifts; and Bitcoin is searching for direction amid macro tailwinds, recovering capital flows, and neutral on-chain signals. Which of the three will ultimately emerge as the winner depends on one variable: whether this agreement is merely a temporary ceasefire or a genuine turning point for the situation in the Middle East.
The draft agreement remains some distance from final approval. The attitude of Iran’s supreme leader, Israel’s response, and the direction of the talks over the next 60 days will all affect the final pricing of the three asset classes. For investors, understanding the distinct pricing logic of each asset is more important than simply betting on whether “the agreement will be reached.”
FAQ
Q: If U.S.-Iran negotiations result in an agreement, will Bitcoin rise or fall?
There are two opposing short-term forces. On the one hand, lower geopolitical risks could weaken Bitcoin’s safe-haven narrative. On the other hand, if falling oil prices cool inflation expectations and open up room for Fed policy easing, improved global liquidity would benefit risk assets, including Bitcoin. As of August 5, BTC was consolidating sideways near $64,000 while the market continued digesting the information. Bitcoin ETFs recorded net inflows for two consecutive days, with institutions such as BlackRock continuing to buy, indicating that institutional demand is recovering, although the scale remains insufficient to constitute a strong breakout signal.
Q: Why is gold rising even though geopolitical risks have eased?
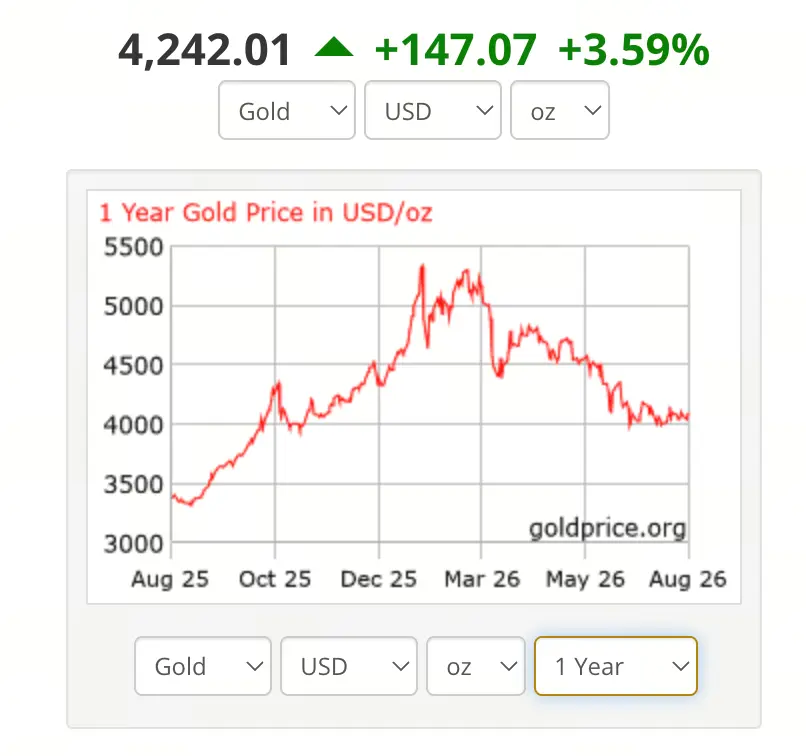
The market is shifting from the “war safe-haven” framework to the “inflation hedge” framework. Falling oil prices ease inflation expectations, reducing pressure for real U.S. Treasury yields to rise and lowering gold’s opportunity cost. The 10-year U.S. Treasury yield has fallen to 4.61%, while the DXY has dropped below 100, both of which support gold. At the same time, structural factors such as global central-bank demand for gold remain unchanged, and gold continues to attract long-term allocation capital.
Q: How significant is the impact of Strait of Hormuz navigation on oil prices?
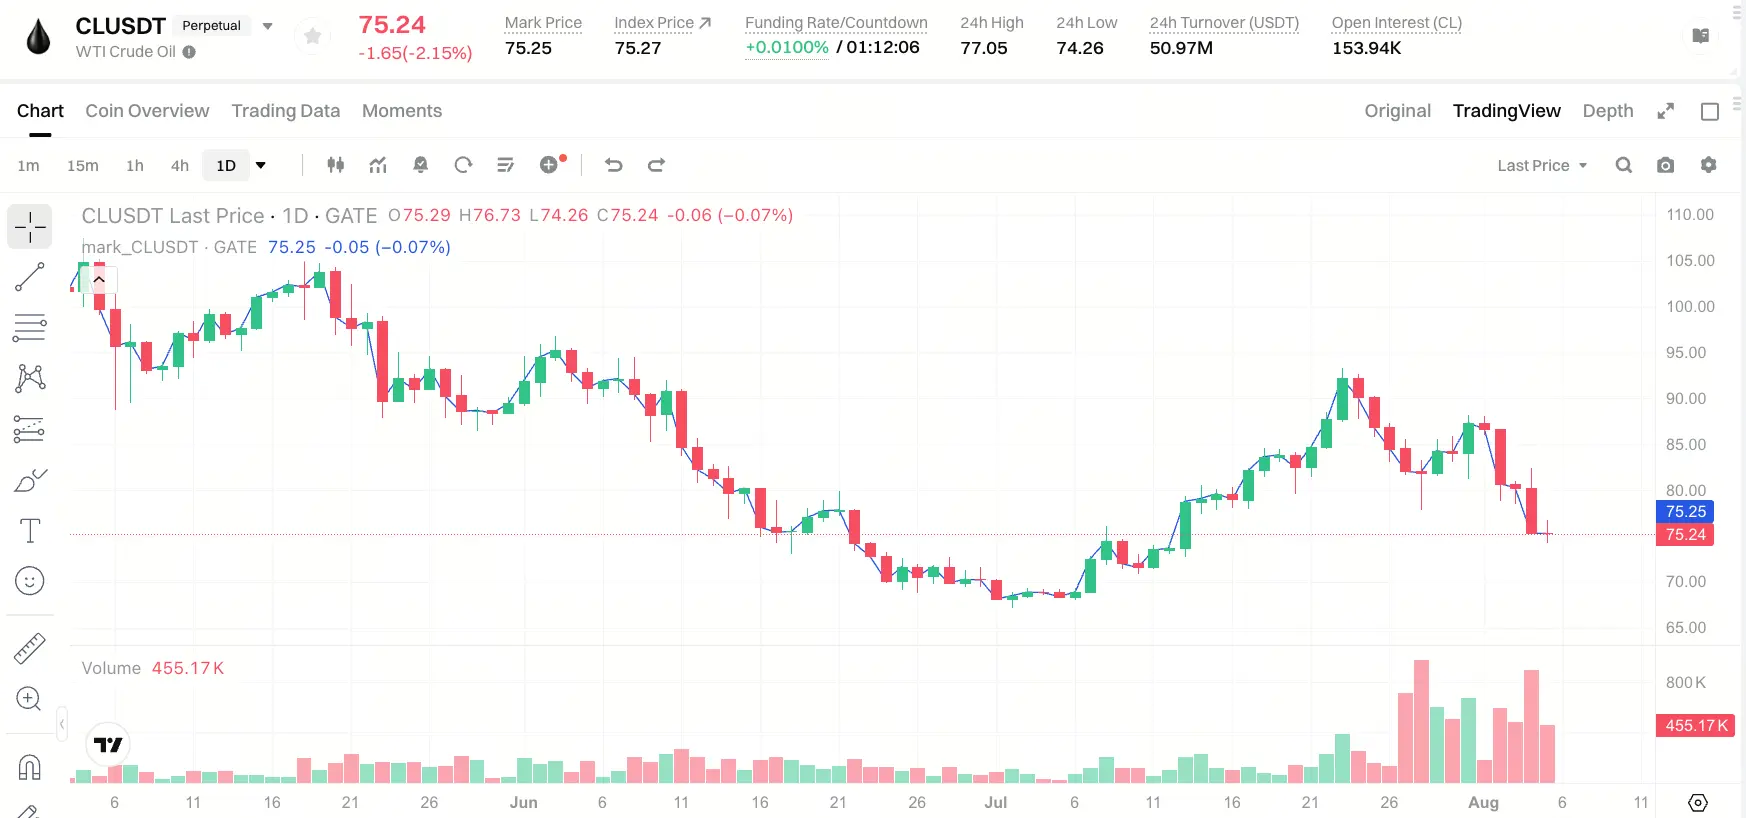
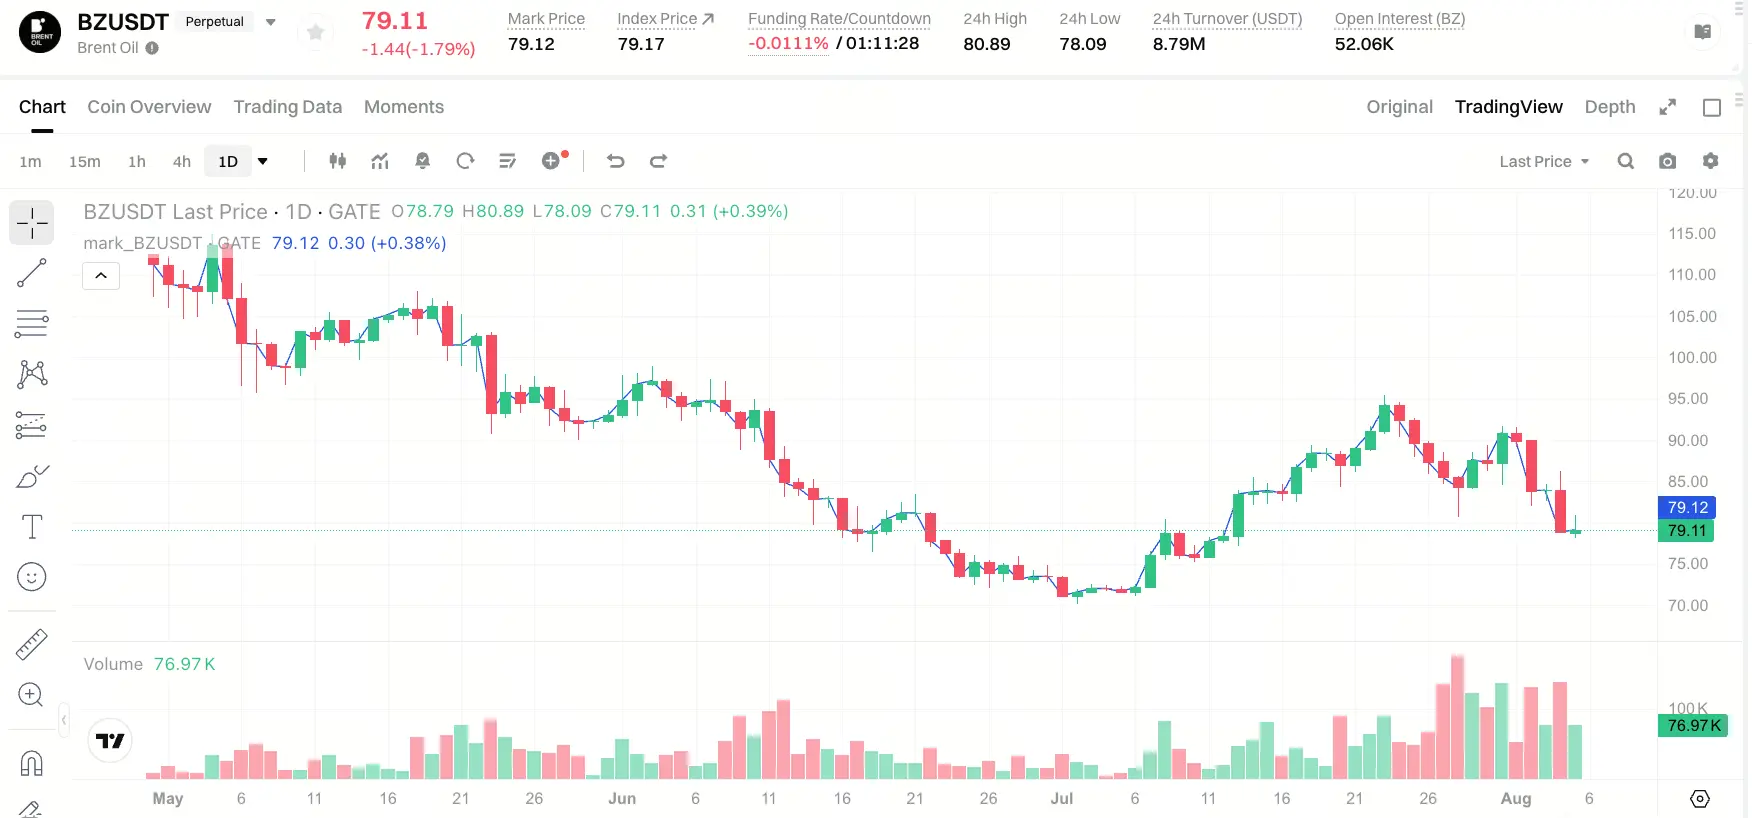
During the blockade of the strait, the market priced in a significant risk premium for supply disruptions. If the agreement takes effect, this portion of the premium will be rapidly unwound. On August 5, WTI crude oil stood at $75.22 per barrel, with its cumulative decline this week exceeding 12%, as the market rapidly repriced the asset. Going forward, if the Strait of Hormuz resumes normal navigation and expectations for Iranian exports gradually return, oil prices will face further correction pressure.
Q: What signal is Bitcoin’s on-chain data sending?
MVRV and SOPR are both currently in neutral ranges, indicating that the market has experienced neither panic selling nor broad profitability. Approximately $220 million worth of BTC flowed into exchanges over the past 24 hours, representing moderate loosening rather than large-scale dumping. ETH, meanwhile, recorded net outflows from exchanges, indicating divergent behavior among assets. Overall, on-chain data points to a “battle between bulls and bears” rather than a one-sided trend.
Q: Which variables should be monitored most closely going forward?
Whether Iran’s supreme leader approves the draft agreement, Israel’s response, actual changes to the U.S. Treasury’s sanctions list, and the pace of implementation after the strait resumes navigation. The final implementation of the agreement’s text will be the true anchor for market pricing. In addition, whether Bitcoin ETF flows continue to recover and whether BlackRock’s IBIT can maintain its inflow strength are also key indicators for assessing institutional demand trends.