In trading, price alone does not always show the full picture. A short price move with little volume may have less market significance than a similar move supported by strong participation. This distinction matters in crypto markets, where liquidity, volatility, and trading volume can change rapidly across different sessions and exchanges.
VWMA helps traders connect price movement with trading activity. By doing so, it provides a clearer view of where buyers and sellers have been most active and whether a trend is supported by volume.
What VWMA Is
VWMA stands for Volume Weighted Moving Average, a moving average that gives greater importance to prices traded with higher volume over a selected period.
The purpose of VWMA is to solve a common limitation of price-only averages. Traditional moving averages show where price has been, but they do not show whether those prices were supported by strong or weak trading activity. VWMA adds volume to the calculation, making the average more sensitive to areas where more market participants traded.
VWMA belongs to the category of Volume & Price Tools because it combines two core market variables: price and volume. It is also a technical indicator because traders use it on charts to interpret trend direction, participation strength, and possible dynamic support or resistance areas.
For example, if Bitcoin trades near one level with heavy volume and briefly moves to another level on low volume, VWMA will lean more toward the high-volume area. This helps traders identify where the market spent more activity, not just where price briefly appeared.
In simple terms, VWMA answers one practical question: where is the average price when volume is taken seriously?
How VWMA Is Calculated
VWMA is calculated by multiplying each period’s price by its trading volume, adding those weighted values together, and dividing the result by total volume over the same period.
A simplified version of the formula is:
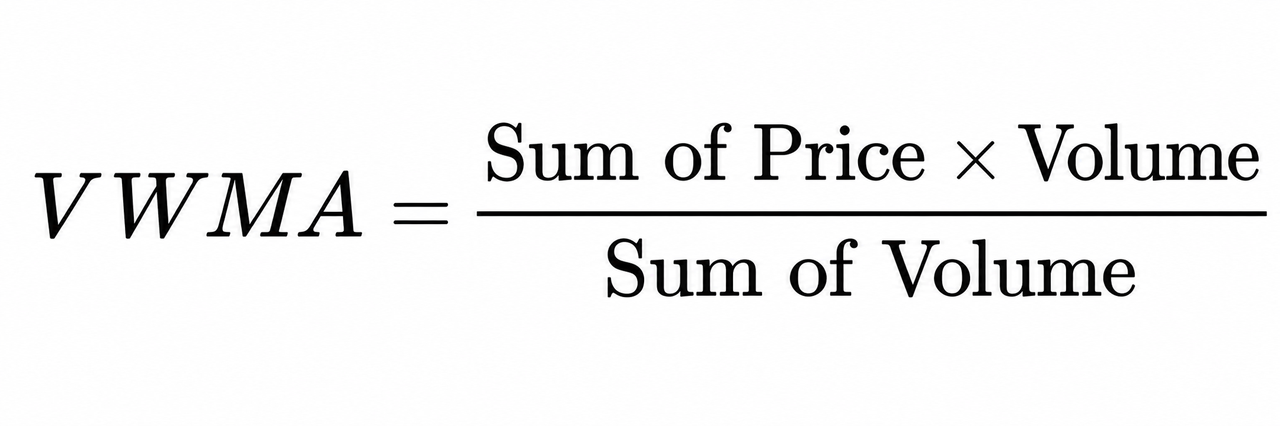
This formula means that prices with higher volume affect the VWMA line more than prices with lower volume. The indicator does not treat every candle equally. Instead, it gives more influence to the candles where more trading actually happened.
A practical interpretation is easier than the formula:
-
If price rises on strong volume, VWMA tends to move upward more clearly.
-
If price rises on weak volume, VWMA may rise more slowly.
-
If price falls on heavy volume, VWMA may shift downward faster.
-
If price moves briefly on low volume, VWMA may filter out part of that noise.
Most charting platforms calculate VWMA automatically. Traders usually only choose the lookback period, such as 20, 50, or 100 candles.
A shorter VWMA reacts more quickly to recent changes in volume and price. A longer VWMA smooths the data and gives a broader view of market participation.
VWMA vs SMA: The Role of Volume Weighting
The key difference between VWMA and SMA is volume weighting. SMA, or Simple Moving Average, calculates the average price over a selected number of periods and gives each period equal importance. VWMA adjusts that average by giving more weight to periods with higher trading volume.
This difference can become important in crypto markets because volume is often uneven. A token may move sharply during a high-volume breakout, then drift during a low-volume consolidation. SMA treats both periods equally. VWMA does not.
| Indicator |
What It Measures |
How Volume Is Used |
Main Use |
| SMA |
Average price over a selected period |
Volume is not included |
Shows general price direction |
| VWMA |
Average price weighted by trading volume |
High-volume periods have more influence |
Shows price direction adjusted by participation |
| Price Action |
Current and historical price movement |
Volume may be analyzed separately |
Shows structure, momentum, and key levels |
| Volume Bars |
Trading activity during each period |
Directly measured |
Shows participation strength |
SMA is useful because it provides a clean view of average price direction. VWMA is useful because it shows whether that average is being shaped by meaningful trading activity.
For example, suppose a crypto asset rises from $100 to $110 on low volume, then falls to $105 on much higher volume. An SMA may still show a smooth upward average because it gives each candle equal weight. VWMA may move closer to $105 because the higher-volume trading occurred near that level.
This does not mean VWMA is always better than SMA. The two indicators answer different questions. SMA asks, “What is the average price?” VWMA asks, “What is the average price after accounting for volume?”
When used together, they can help traders see whether price movement is supported by participation or simply moving through thin liquidity.
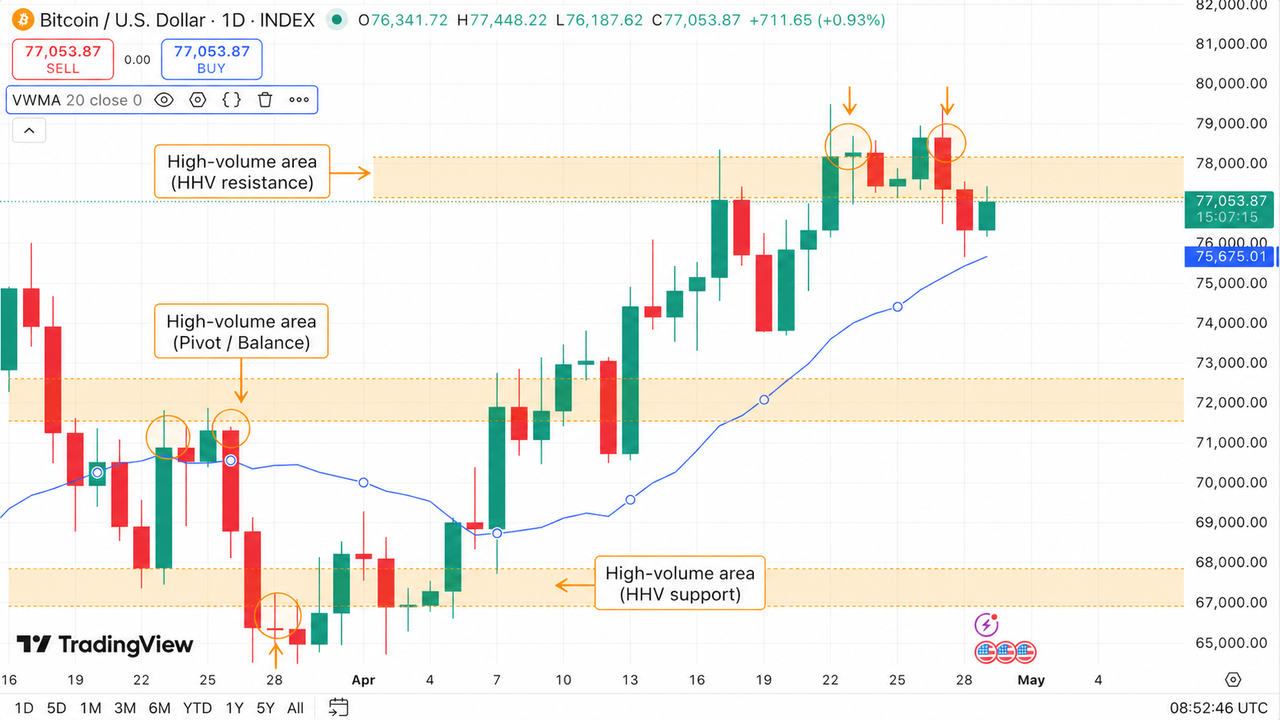
How VWMA Reflects True Trading Cost Zones
VWMA can help traders identify volume-weighted cost zones, which are areas where significant trading activity has taken place over a selected period.
A cost zone is not an exact entry level for all market participants. Instead, it is an approximate area where buyers and sellers exchanged meaningful volume. Because VWMA gives more weight to high-volume prices, it can act as a dynamic reference for where recent market activity has been concentrated.
In crypto trading, this can be useful because price often reacts around areas where many participants entered positions. These zones may later become support, resistance, or decision areas depending on broader market structure.
When price trades above VWMA, it may suggest that the asset is trading above its recent volume-weighted average cost. This can indicate that buyers who entered near the VWMA are, on average, in a stronger position.
When price trades below VWMA, it may suggest that the market is below its recent volume-weighted cost area. This can signal weaker conditions, especially if the move below VWMA occurs with rising sell volume.
VWMA becomes more useful when it aligns with visible chart structure. For example, a VWMA line near a previous breakout level, consolidation range, or high-volume reaction zone may provide stronger context than VWMA alone.
However, traders should avoid treating VWMA as a perfect support or resistance line. It is better understood as a moving reference zone that reflects the relationship between price and participation.
VWMA in Trend Confirmation
VWMA is commonly used to confirm whether a trend is supported by volume. A price trend that holds above a rising VWMA may indicate stronger buyer participation. A price trend that remains below a falling VWMA may indicate stronger seller participation.
In an uptrend, traders often look for price to stay above VWMA while the VWMA line slopes upward. This suggests that higher prices are being supported by trading activity, not only by temporary price movement.
In a downtrend, price staying below a declining VWMA may show that selling activity is influencing the volume-weighted average. This can confirm that sellers remain active during the move.
Several common VWMA interpretations include:
Price above VWMA Price is trading above its recent volume-weighted average. In an existing uptrend, this may support bullish trend context.
Price below VWMA Price is trading below its recent volume-weighted average. In an existing downtrend, this may support bearish trend context.
VWMA rising with price The upward move is supported by volume-weighted participation.
Price rising while VWMA stays flat The move may be less supported by volume and may require confirmation from price structure.
Price crossing VWMA A cross may suggest a shift in short-term balance, but it should not be used alone as a buy or sell signal.
VWMA is most helpful when combined with other chart evidence. A breakout above resistance with rising volume and price above VWMA may carry more significance than a breakout on weak volume. A breakdown below a support zone with price moving under VWMA may show that sellers are becoming more active.
For practical trading analysis, VWMA can help answer whether a move is backed by participation. It does not predict the move by itself.
Limitations of VWMA
VWMA has useful applications, but it also has limitations. Like all moving averages, it is based on historical data. It reacts to past price and volume behavior rather than forecasting future market direction.
One limitation is that VWMA can be affected by sudden volume spikes. In crypto markets, liquidation events, news reactions, or large exchange-specific trades can pull VWMA sharply toward one area. If the spike is temporary, the indicator may overstate the importance of that price zone.
Another limitation is that volume data can vary across trading venues. Crypto assets often trade on multiple exchanges, and reported volume may differ by platform, pair, and liquidity conditions. A VWMA calculated on one exchange may not fully represent the broader market.
VWMA can also be less reliable in low-liquidity assets. When volume is thin or irregular, the indicator may move unevenly and produce weaker signals. This is especially relevant for smaller tokens where a few large trades can distort the average.
A further risk is overinterpretation. Traders may assume that every VWMA touch, cross, or rejection has strong meaning. In reality, VWMA should be read in context. Market structure, support and resistance, volatility, order flow, and broader trend direction all matter.
The most important limitation is that VWMA is not a complete trading system. It can support analysis, but it should not replace risk management or independent confirmation.
Conclusion
VWMA, or Volume Weighted Moving Average, is a technical indicator that calculates average price while giving more importance to higher-volume periods. It helps traders understand where price movement is supported by meaningful market participation.
Compared with SMA, VWMA adds an important layer of context. SMA treats each price period equally, while VWMA gives more influence to prices where more trading occurred. This makes VWMA especially useful in crypto markets, where price movement can be shaped by uneven volume, liquidity gaps, and sudden participation changes.
VWMA can help traders identify volume-backed trends, dynamic cost zones, and possible areas where buyers or sellers are more active. It can also help confirm whether a trend is being supported by participation rather than price movement alone.
The best way to use VWMA is as a context indicator. It should be combined with price action, support and resistance, volume behavior, and broader market structure. When used carefully, VWMA can make technical analysis more grounded by showing how price and volume interact.
FAQs
What does VWMA mean?
VWMA means Volume Weighted Moving Average. It is a technical indicator that calculates average price while giving greater weight to periods with higher trading volume.
How is VWMA different from SMA?
SMA calculates the average price and treats every period equally. VWMA gives more influence to periods with higher volume, making it more sensitive to areas where more trading occurred.
What does VWMA show traders?
VWMA shows where the average price is when volume is included in the calculation. It helps traders see whether price movement is supported by stronger or weaker market participation.
Can VWMA identify support and resistance?
VWMA can act as a dynamic reference zone near areas of active trading, but it should not be treated as exact support or resistance. It works best when confirmed by chart structure and price action.
Does VWMA give buy and sell signals?
VWMA can help identify shifts in market balance, but it should not be used as a standalone buy or sell signal. Crosses above or below VWMA require confirmation from price action and broader trend context.