OpenAI and Nvidia (NVDA) are frequently compared in terms of valuation, with many asking, "Which is worth more?" According to Gate's latest disclosures, OPENAI's implied valuation stands at approximately $895 billion, while NVDA, the leading AI chip company listed on Nasdaq, is projected to have a market capitalization of about $5 trillion around July 2026. Although these numbers might appear comparable, they actually represent two fundamentally different concepts: OPENAI's figure is an implied valuation from private markets, while NVDA's is a public market capitalization. This means you cannot directly answer "which is more valuable" without understanding the context. It's essential to separate OpenAI as a company from OPENAI mirror notes, and then compare only against NVDA's publicly listed shares to avoid conflating private valuations, implied values, and public P/E ratios.
Before making comparisons, clarify whether you're discussing the company as a whole, its products, or its role within the industry chain. Just because both are involved in AI doesn't mean their valuation logic is the same.
Which Is More Valuable: OpenAI or Nvidia? Why Can't They Be Compared Directly?
On the surface, OPENAI's implied valuation (about $895 billion) and NVDA's market cap (about $5 trillion as of July 2026, per Yahoo Finance and StockAnalysis) could be discussed side by side, but they're not the same kind of figure. OPENAI's implied valuation is calculated using a commitment price of 722 times a reference share count—essentially, a figure derived from mirror note mapping. NVDA's market cap is based on its share price multiplied by the number of outstanding shares and fluctuates daily.
So, when asking "Which is worth more: OpenAI or Nvidia," it's critical to verify that both numbers are calculated using the same standards, at the same time, and from comparable sources. Ranking totals from fundamentally different systems can create a misleading impression that "OpenAI is more expensive" or "Nvidia is more expensive," while ignoring the lack of continuous trading in private valuations, the fact that OPENAI doesn't represent actual equity, and other important distinctions.
What Is OpenAI? How Does Its Unlisted Status Affect Valuation?
OpenAI provides AI model capabilities to organizations and individuals from its headquarters in San Francisco. It remains a private company, so the public can't buy OpenAI common stock through a ticker like NVDA.
Being private changes how valuations are calculated: typical metrics include post-money valuations from private funding rounds, rumors of secondary transfers, or platform-calculated implied values based on commitment price and reference share count. According to the OPENAI implied valuation formula, Gate's figure of about $895 billion is based on 1 OPENAI = 722 and a reference total share count of roughly 1.23–1.24 billion shares. This is a mirror note mapping input, not an official valuation from OpenAI. As a private company, OpenAI lacks continuous public trading, so treating any single number as the "current price" of OpenAI stock ignores these methodological differences.
What Is Nvidia (NVDA) and What Does It Represent for AI Stocks?
Nvidia (NVDA) is listed on Nasdaq under the ticker NVDA and represents the backbone of AI computing infrastructure: data center GPUs and AI acceleration platforms, with revenue verified through audited financials.
As of July 16, 2026, NVDA trades at about $208.82 per share, with a market cap near $5.1 trillion (source: Trefis). Around July 2026, NVDA's trailing P/E is about 31.7–32.5, and its market cap is about $5.02 trillion (sources: Yahoo Finance, StockAnalysis). These figures change daily, so always cite the date and source. NVDA is a "public, auditable" benchmark, structurally distinct from OpenAI's private, non-ticker status.
How Do OpenAI and NVDA Differ in Business Model?
OpenAI operates at the model and application layer (APIs, subscriptions, enterprise deployments), while Nvidia focuses on compute infrastructure (chips and platforms). They occupy different links in the AI value chain, with distinct revenue drivers and cost structures.
| Comparison |
OpenAI (Private) |
Nvidia (NVDA) |
| Value Chain Position |
Model & Application Layer |
Chip & Compute Platform Layer |
| Core Deliverables |
AI Models, APIs, Enterprise Software |
GPUs, Data Center Solutions |
| Revenue Model |
Subscriptions, Usage, Enterprise Contracts |
Hardware Sales, Platform Ecosystem |
| Listing Status |
Private, No Public Ticker |
Nasdaq-Listed (NVDA) |
| Valuation Approach |
Private Rounds, Mapping References |
P/E, P/S, Financial Reports |
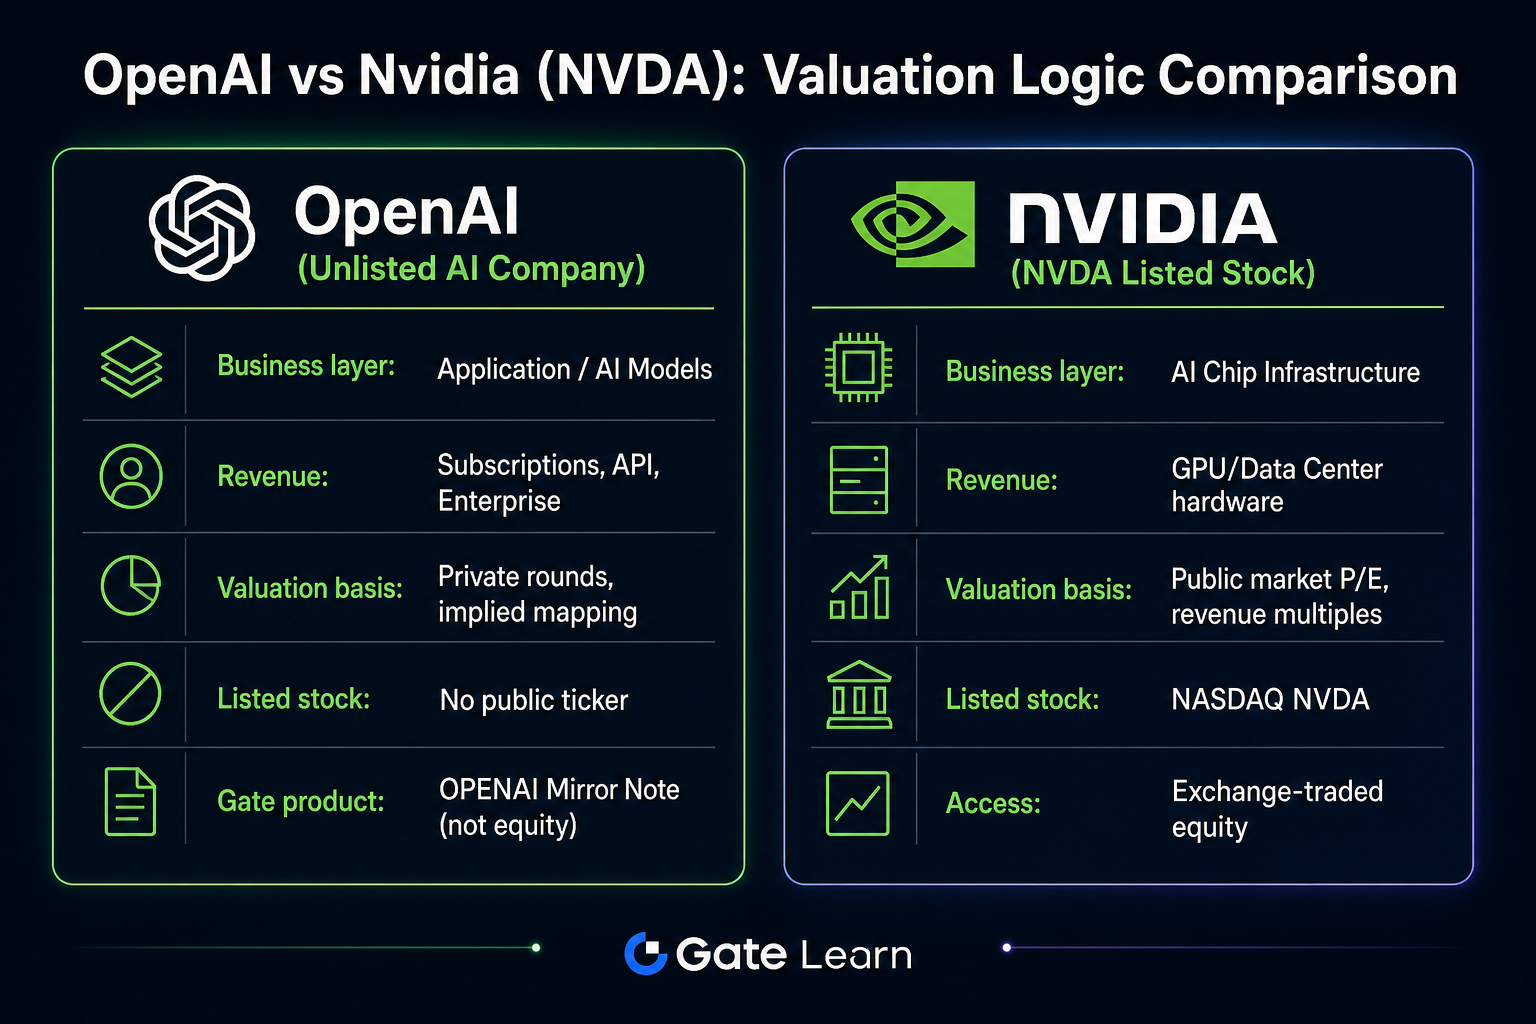 Figure 1. OpenAI and NVDA compared by value chain position, revenue model, and valuation approach.
This table illustrates structural differences and is not an investment recommendation. Their financial metrics are not directly interchangeable.
Can Private Valuations, Implied Value, and NVDA's P/E Be Compared Directly?
No. Private post-money valuations, OPENAI implied values, and NVDA P/E ratios answer different questions, each with unique inputs, limitations, and update cycles.
| Valuation Metric |
Typical Input |
Main Limitation |
| OpenAI Private Valuation |
Funding Documents, News |
Single Point in Time, No Continuous Trading |
| OPENAI Implied Value |
Commitment Price 722 × Reference Share Count |
Mapping Input, Not Company-Confirmed |
| NVDA P/E |
Share Price ÷ EPS (TTM) |
Changes Daily with Market and Financials |
Even when implied values and private valuations are similar in scale, OPENAI is still a mirror note, not actual OpenAI shares. NVDA's trailing P/E of about 31.7 (as of July 2026, StockAnalysis) reflects public-market profit pricing, which cannot be directly compared to private negotiation prices or mapping values. Comparing "$895 billion implied value" to "NVDA $5 trillion market cap" by multiples is misleading.
What Is the Difference Between Buying NVDA Stock and Gaining Exposure to OpenAI?
Buying NVDA follows the logic of public equities: search for NVDA on platforms like Gate Stocks, place orders according to exchange rules, and obtain Nasdaq-listed shares. OpenAI exposure is fragmented across private equity, private funds, or OPENAI mirror notes on Gate Pre-IPOs, each with distinct contracts and settlement rules.
| Path |
Asset Nature |
Pricing Source |
Rights |
| Buy NVDA Stock |
Public Common Stock |
Continuous Market Price |
Shareholder Rights per Listing and Bylaws |
| Actual OpenAI Equity |
Private Shares |
Private Placement/Transfer Negotiation |
Per Company Docs and Shareholder Agreements |
| Gate OPENAI |
Mirror Note |
Product Commitment Price & Reference Mapping |
Contractual Settlement, Not OpenAI Shares |
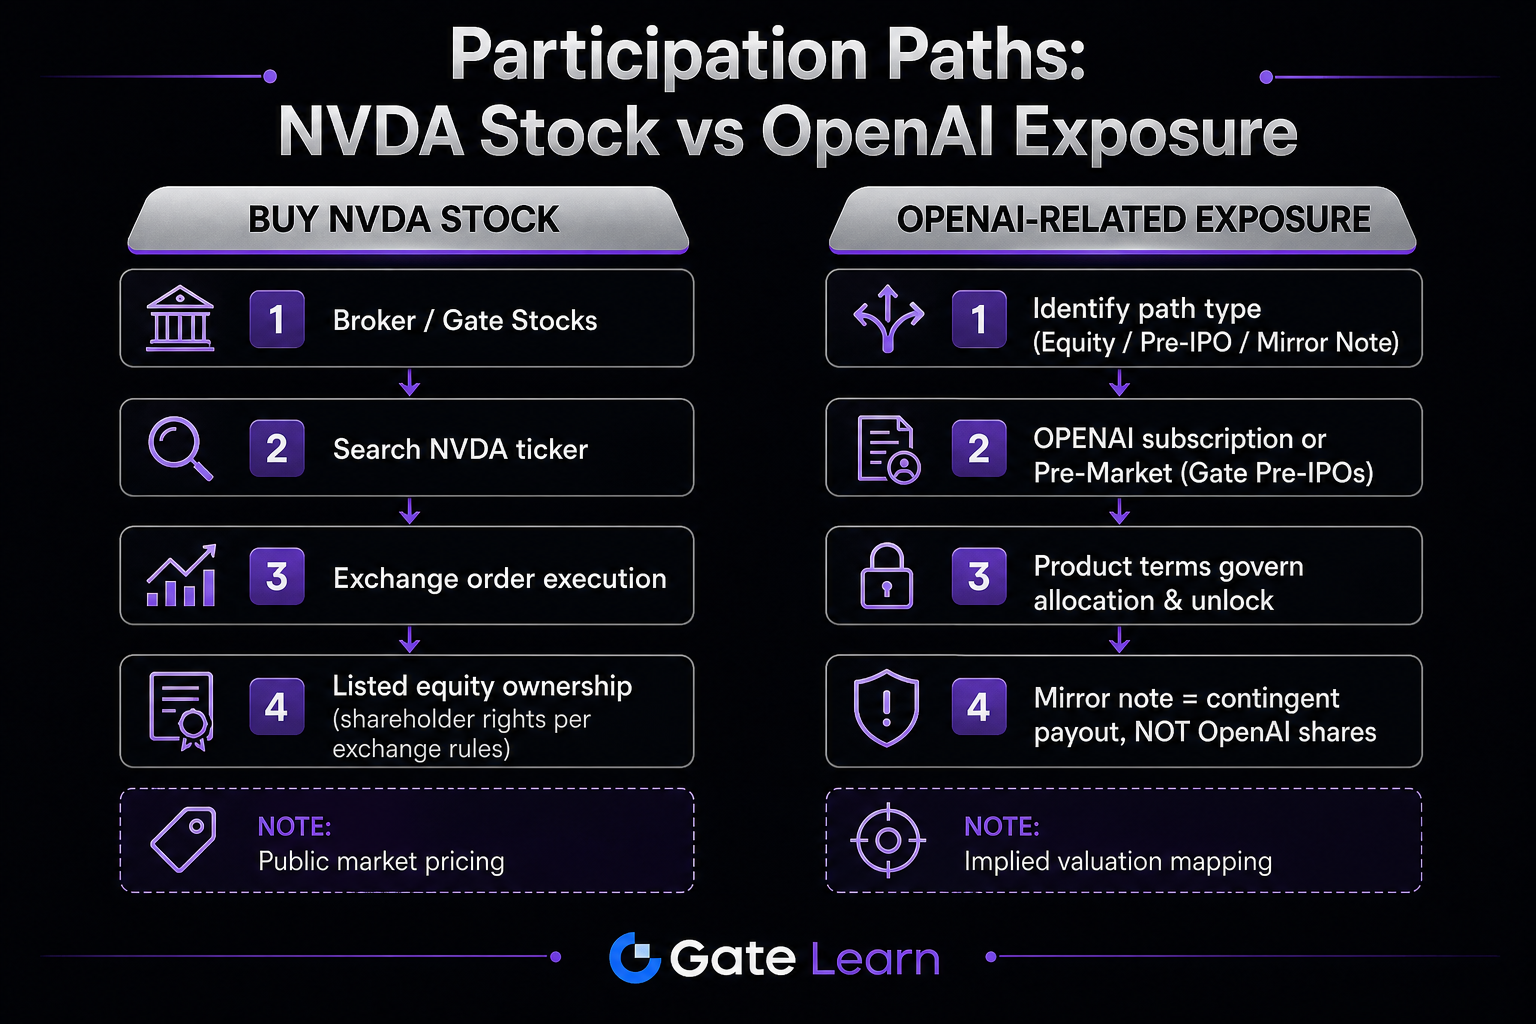 Figure 2. NVDA public stock path vs. OpenAI-related exposure (including OPENAI mirror notes).
The key is not "can it be traded," but "what is the legal nature of what you're trading": buying NVDA gives you public shares; OpenAI exposure may involve private equity, private arrangements, or Gate Pre-IPOs mirror notes, each with different contracts and settlement rules.
Are OpenAI and Nvidia Competitors or Complementary?
In most contexts, OpenAI and Nvidia are complementary: OpenAI consumes compute power to train and deploy models, while Nvidia supplies the GPUs and platforms. As AI demand grows, both application-layer revenue and infrastructure shipments may rise, but their financials are distinct. While procurement strategies or negotiating leverage may occasionally create tension, this doesn't mean a zero-sum rivalry. NVDA reflects the supply side of compute, while OpenAI's value is tied to the model layer and capital structure; the two are not substitutes for one another.
What Are Common Misconceptions When Comparing the Two?
Common errors include: treating OpenAI and NVDA as "the same kind of AI stock" and directly comparing multiples; assuming OPENAI mirror notes are equivalent to OpenAI stock or a substitute for NVDA; using a single private valuation and NVDA's market cap for ranking; quoting NVDA data without date and source; or thinking their valuations should always move in sync because they're in the same industry chain.
Summary
OpenAI and Nvidia (NVDA) operate under entirely different valuation systems: OpenAI relies on private market disclosures or OPENAI mirror note mapping, while NVDA is valued by public market multiples and audited financials. Business models differ—OpenAI focuses on applications, Nvidia on compute infrastructure; participation and rights structures vary; and they are generally complementary within the industry chain. Comparisons should clarify the valuation method, cite date and source, and avoid directly converting between mapping values, private valuations, and public P/E ratios.
FAQ
Which Is More Valuable: OpenAI or Nvidia?
Based on public disclosures, Gate's OPENAI implied value is about $895 billion, while NVDA's market cap is around $5 trillion as of July 2026 (sources: Yahoo Finance, StockAnalysis). The two metrics are not directly comparable—OPENAI's figure is a mirror note mapping input, NVDA's is a public market price—so always specify the methodology, date, and source.
Are OpenAI and Nvidia the Same Kind of Company?
No. OpenAI is a private AI model and application company; Nvidia (NVDA) is a Nasdaq-listed AI chip and compute platform company. They occupy different value chain positions, have different revenue structures and listing statuses, and are not the same "stock type."
Can You Compare OpenAI's Valuation and NVDA's P/E Directly?
No. OpenAI's valuation is usually based on private rounds or mirror note implied value, while NVDA uses public market metrics like trailing P/E. The underlying numbers, update frequency, and legal standing differ, so direct comparison is not valid.
What's the Difference Between Buying NVDA Stock and Gaining OpenAI Exposure?
Buying NVDA means acquiring public shares on an exchange, with pricing from continuous market activity. Gaining OpenAI exposure may involve private equity, private arrangements, or OPENAI mirror notes on Gate Pre-IPOs; the latter is based on product terms and reference values—not actual OpenAI shares—and the rights and settlement process are distinct from NVDA public stock.
How Should You Interpret OPENAI's Implied Valuation?
Gate's OPENAI implied valuation of about $895 billion is based on a commitment price of 1 OPENAI = 722 and a reference share count of roughly 1.23–1.24 billion. This illustrates the value mapping for mirror notes. It is not an official OpenAI valuation and cannot be directly compared to NVDA's market cap as a measure of "which is higher."
What Does NVDA Represent in AI Stock Discussions?
NVDA typically stands for the public benchmark of AI compute infrastructure: data center GPUs and related platforms. Its value is based on public financials and secondary market pricing, such as a trailing P/E of about 31.7 and market cap of $5.02 trillion as of July 2026 (sources: StockAnalysis, Yahoo Finance), and should always be cited with date.
Are OpenAI and NVDA Competitors?
In most scenarios, they are complementary: the model layer needs compute, and the compute layer needs downstream AI demand. Specific business decisions may affect procurement intensity, but this is not a simple zero-sum rivalry and shouldn't be used to draw one-sided investment conclusions.