That difference matters because the two indicators can look at the same price chart and tell different stories. A breakout trader may care about whether rising volume supports a move immediately, while a positional investor may be more interested in whether price continues advancing during low-volume periods. Neither indicator predicts price movements reliably on its own, and both can generate false signals in volatile or sideways markets.
Key Takeaways
-
OBV is generally better for broad volume confirmation because every up or down period can affect its cumulative volume total.
-
Negative Volume Index focuses only on periods of declining trading volume, making it more specialized for low-volume trend confirmation.
-
Rising OBV alongside rising prices generally strengthens a bullish trend interpretation; falling OBV alongside declining prices supports a bearish trend.
-
Bullish divergence and bearish divergence can appear on both indicators, but OBV usually produces more frequent signals because it updates more often.
-
NVI's traditional association with “smart money” is a market hypothesis, not proof that institutional investors are responsible for low-volume price movements.
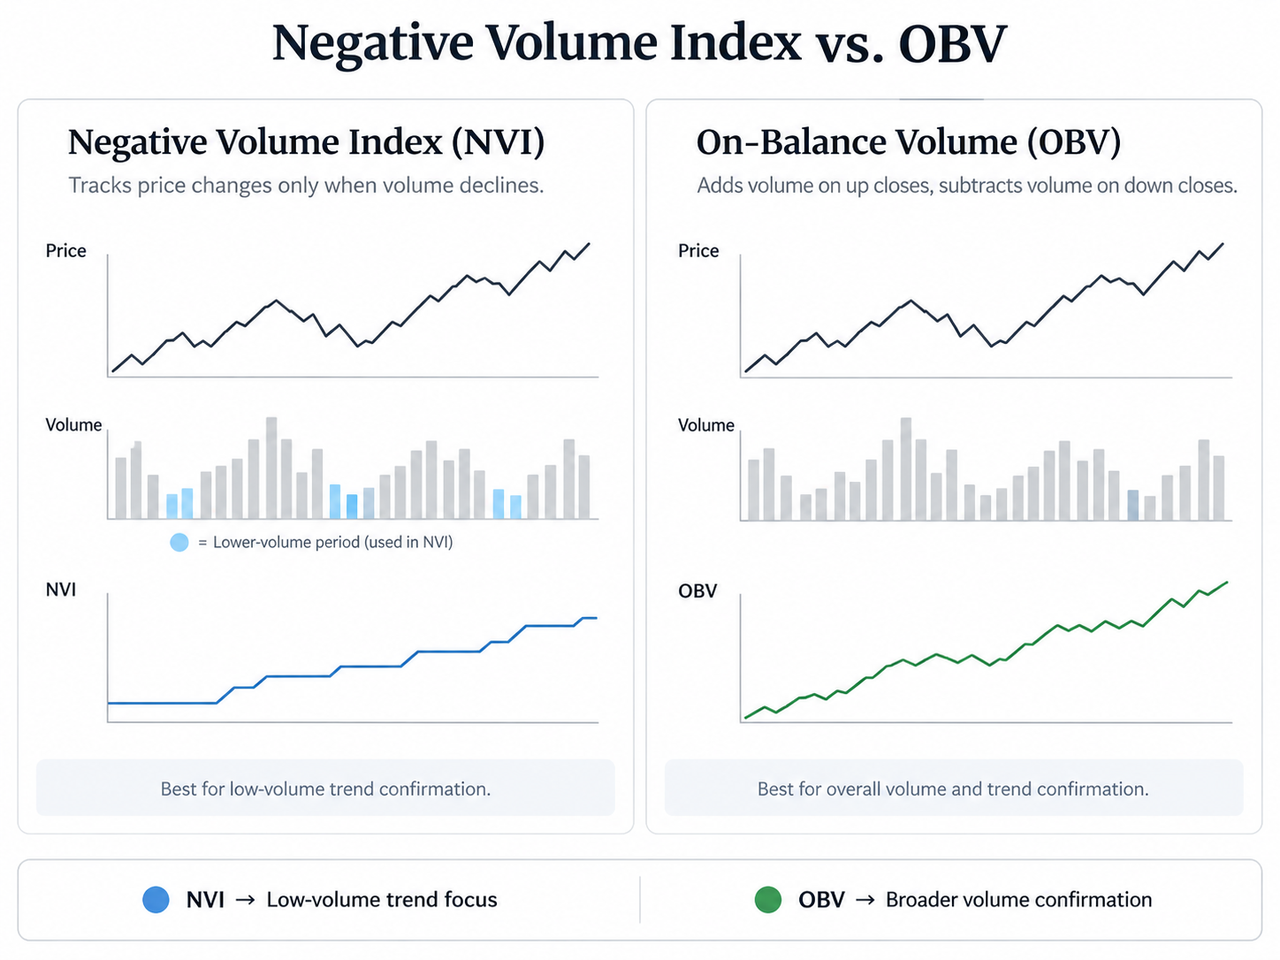
Negative Volume Index vs. OBV: Which Is Better for Volume Confirmation?
OBV wins for general-purpose volume confirmation.
The reason is simple. The OBV indicator reacts whenever the closing price changes relative to the previous close. If price rises, the period's volume is added. If price declines, it is subtracted. Over time, that creates a cumulative indicator that shows whether positive or negative volume pressure is dominating.
NVI ignores far more data. If today's market volume is equal to or greater than the previous period's volume, the Negative Volume Index normally doesn't change. It responds only when volume declines.
That narrower design isn't necessarily a weakness. It answers a different question.
OBV asks:
Is cumulative trading volume moving in the same direction as price?
NVI asks:
What is price doing during periods when participation is quieter than before?
For trend confirmation, breakout analysis and regular chart monitoring, OBV is usually the clearer choice. For low-volume trend analysis over longer periods, NVI can provide information that most volume indicators don't isolate.
| Feature |
Negative Volume Index |
On-Balance Volume |
| Indicator type |
Cumulative price-volume indicator |
Cumulative volume indicator |
| Updates when |
Current volume is lower than previous volume |
Price closes higher or lower |
| Main focus |
Low-volume price movements |
Directional cumulative volume |
| Best use |
Long-term, low-volume trend analysis |
Trend and breakout confirmation |
| Uses price-change magnitude |
Yes |
No |
| Uses full period volume |
Indirectly as a filter |
Yes |
| Bullish/bearish divergence |
Yes |
Yes |
| Typical signal frequency |
Lower |
Higher |
| Main weakness |
Ignores higher-volume periods |
Can react sharply to isolated high-volume sessions |
What Is the Negative Volume Index?
The Negative Volume Index is a cumulative indicator that tracks percentage price changes only when trading volume is lower than it was during the previous period.
Paul Dysart developed the concept in the 1930s. The indicator later became closely associated with Norman Fosback, who incorporated it into longer-term stock-market analysis. Fidelity describes the traditional NVI premise as the idea that more informed or “smart money” participants may be active when overall trading activity is relatively quiet.
That should be treated as a hypothesis rather than a literal measurement of institutional investors. Volume data doesn't identify whether a trade came from a hedge fund, market maker, retail investor or another market participant.
The mechanics are much more concrete.
When today's trading volume is lower than the previous day's:
NVI = Previous NVI + (Percentage Price Change × Previous NVI)
Or:
NVI(t) = NVI(t−1) × [1 + ((Close(t) − Close(t−1)) / Close(t−1))]
When market volume doesn't decline:
NVI(t) = NVI(t−1)
Suppose an asset closes at $100 and then reaches $102 while volume falls from 10 million units to 8 million. The percentage price change is 2%.
If the previous NVI was 1,000:
New NVI = 1,000 × 1.02 = 1,020
If volume instead increased to 12 million units, the NVI would remain at 1,000 despite the same price rise.
This selective calculation is what separates NVI from the Negative Volume Index approach to low-volume price trends from conventional volume-flow tools that respond continuously.
How On-Balance Volume Works
On-Balance Volume, or OBV, takes almost the opposite approach. It doesn't wait for negative volume or lower-volume periods. Instead, it assigns the entire period's volume according to price direction.
If today's closing price is above yesterday's closing price:
OBV = Previous OBV + Current Volume
If today's closing price is below the prior close price:
OBV = Previous OBV − Current Volume
If the closing price is unchanged:
OBV = Previous OBV
The indicator was popularized by Joseph Granville in 1963 and became closely associated with the principle that volume precedes price.
Suppose yesterday's OBV was 50 million.
Today the stock price rises and trading volume is 5 million:
OBV = 55 million
If the next day's price declines on 8 million of volume:
OBV = 47 million
The absolute value of OBV isn't usually the important part. Traders tend to focus on its direction, previous highs and lows, trend lines and relationship with price action.
That makes the OBV indicator especially intuitive for trend identification.
If price rises and OBV rises, buying pressure is broadly supporting the move.
If price declines and OBV falls, growing selling pressure is consistent with the bearish trend.
If the two move in different directions, a divergence may be developing.
Why OBV Usually Gives Clearer Trend Confirmation
OBV's biggest advantage is its daily or period-by-period granularity.
Imagine a cryptocurrency rises from $60,000 to $65,000 across several sessions. Some sessions have rising volume and others have declining volume.
NVI might update only twice because those were the only periods in which current volume was below the previous period's volume.
OBV can update after almost every price change.
This creates a more continuous picture of buying and selling pressure. When price rises and OBV rises through its recent trading range, cumulative volume is moving with the bullish trend. When the price falls and OBV falls, volume pressure is aligned with the bearish trend.
The same distinction is why OBV generally provides more direct trend confirmation than the Money Flow Index. MFI combines price and volume into a bounded momentum indicator, while balance volume OBV remains focused on cumulative directional volume.
A historical Best Buy example illustrates the principle. StockCharts documented periods in which Best Buy's price trend and OBV moved together, including a price downtrend break in late February that was followed by an OBV resistance breakout in March, and an uptrend break in late April that OBV confirmed with a support break in early May.
The example doesn't prove that OBV predicts reversals. It shows how the indicator can confirm a price move when volume structure changes in the same direction.
Bullish Divergence: When Volume Improves Before Price
A bullish divergence occurs when price action remains weak while the volume indicator begins improving.
With OBV, a common setup is:
If OBV rises while the stock price continues falling, the interpretation is that positive-volume periods are becoming stronger relative to negative-volume periods.
The price reversal hasn't happened yet. Divergence simply warns that the existing price trend may be losing momentum.
NVI can also form a bullish divergence, but its meaning is slightly different. If price remains weak while NVI rises, price performance during lower-volume periods is improving.
Because NVI filters out rising-volume periods, its divergence may develop more slowly.
Bearish Divergence: When OBV Falls as Price Rises
A bearish divergence reverses the relationship.
Suppose the current price reaches a new high while OBV fails to make a corresponding high or begins falling. Price rises, yet cumulative volume pressure is weakening.
That can suggest fewer volume-supported advances beneath the headline price movement.
For example:
Price: 100 → 104 → 108 → 111
OBV: 50M → 53M → 51M → 48M
The price trend still looks bullish, but the OBV line is moving lower.
That isn't an automatic short signal. Strong trends can continue even when divergence appears, and one large-volume period can substantially change cumulative OBV totals.
The more useful question is whether divergence agrees with price structure. A bearish OBV divergence becomes more relevant if price subsequently loses support or breaks its established trend.
Negative Volume and the “Smart Money” Idea
NVI is frequently described as a way to track smart money or institutional investors.
The original intuition was that highly informed market participants may operate more quietly, while less-informed crowd participation becomes more visible during periods of heavy activity.
Modern markets make that interpretation difficult to verify.
Institutional investors use algorithmic execution, dark pools, market makers, derivatives, OTC transactions and other structures that aren't captured neatly by a single exchange's daily volume figure. Crypto volume is even more fragmented because the same asset can trade simultaneously across many centralized and decentralized venues.
So NVI doesn't detect institutional investors directly.
A more defensible description is:
NVI measures price performance specifically during periods when reported trading volume declines relative to the previous period.
That mechanism is factual. The identity or psychology of the participants causing those price movements is an interpretation.
Using OBV to Confirm Breakouts
OBV can be particularly useful when price approaches a major resistance or support level.
Imagine an asset has traded between $90 and $100 for several weeks.
Price eventually rises to $102.
If OBV has already been climbing and breaks above its own recent high, cumulative volume supports the breakout. If OBV falls while price breaks above $100, participation looks less convincing.
This is one reason traders often compare an OBV breakout with price resistance rather than focusing on the cumulative OBV total itself.
For a live crypto example, a trader using Gate.com can compare recent price and transaction activity in the BTC/USDT market data available through Gate.com’s spot infrastructure with OBV or another volume indicator. Gate's spot API supports retrieval of BTC_USDT market transaction records, which is useful when examining current volume data rather than relying on a static historical chart.
Breakouts can still fail. OBV confirms participation; it doesn't prove that price will maintain the breakout.
When Negative Volume Index Is More Useful
OBV's broader responsiveness doesn't make NVI unnecessary.
NVI may be more informative when the trading strategy specifically focuses on quiet-market behavior.
Consider an asset that has remained in a bullish trend for several months. High-volume sessions are volatile, but on quieter days the price repeatedly edges higher.
OBV may swing sharply because large-volume sessions dominate its cumulative volume total.
NVI filters those high-volume sessions out.
If the Negative Volume Index maintains an upward price trend through those quieter periods, that can strengthen the case that the broader trend isn't dependent entirely on bursts of rising volume.
Historically, Norman Fosback compared NVI with a roughly one-year, 255-period moving average. Fidelity notes Fosback's historical claim that an NVI above this moving average was associated with bull-market conditions in his research.
Those historical probabilities shouldn't be treated as universal modern trading probabilities. Market structure, asset type, timeframe and testing methodology all matter. There is likewise no defensible universal rule that NVI has a “60–65% strike ratio” across stocks or cryptocurrencies.
OBV, Chaikin Money Flow and Other Indicators
No single volume indicator captures every aspect of market dynamics.
Chaikin Money Flow weights volume according to where the closing price sits within each period's high-low range. It therefore answers a different question from OBV, which simply classifies the entire period's volume by whether the closing price rose or fell.
The Chaikin Money Flow and Money Flow Index comparison shows another distinction: MFI converts price and volume into a bounded momentum oscillator, while CMF fluctuates around a zero line to estimate accumulation and distribution pressure.
The Accumulation/Distribution vs. OBV comparison is useful because the balance volume indicator ignores where the closing price sits inside the period's trading range, whereas A/D explicitly incorporates that relationship.
Ease of Movement asks how efficiently price moves relative to volume, and the Volume Oscillator compares shorter and longer moving averages of volume itself.
A Klinger Volume Oscillator adds another framework by combining price direction, trading range and volume into a trend-oriented oscillator.
Those indicators aren't interchangeable. The best complementary indicator depends on the question being asked.
Can Negative Volume Index and OBV Be Used Together?
Yes, and their different filters can make the combination useful.
Suppose:
-
price is rising;
-
OBV rises;
-
NVI rises.
OBV shows cumulative volume moving with price. NVI shows that lower-volume periods are also contributing positively.
That is stronger confirmation than either indicator provides alone because two different calculations agree.
Now consider:
-
price rises;
-
OBV rises;
-
NVI declines.
The overall volume-price trend remains positive, but quieter sessions are behaving less favorably.
The opposite combination can also occur:
Lower-volume periods are supporting price, yet total cumulative volume is deteriorating. Rather than forcing a bullish or bearish conclusion, the disagreement tells the trader to inspect price levels, volume data and market structure more carefully.
Using two indicators is useful only when each contributes different information. Adding several cumulative volume indicators that react to essentially the same inputs can create the illusion of confirmation without adding much analytical value.
Main Limitations of Negative Volume Index and Balance Volume OBV
Both indicators simplify complex market behavior.
OBV ignores the size of the price change
A 0.1% rise and a 10% rise receive exactly the same treatment: the period's full volume is added.
One unusually high-volume day can therefore cause a large jump in the cumulative OBV total.
NVI ignores higher-volume periods
Price can make its most important move on rising volume while NVI remains unchanged.
That is intentional, but it makes NVI incomplete as a standalone volume-analysis tool.
Exchange volume isn't the whole market
Crypto market volume varies by venue. The latest trading volume on one exchange doesn't represent all global buying pressure or selling pressure.
Divergence can persist
Bullish divergence doesn't guarantee a price reversal, and bearish divergence doesn't guarantee a decline. Markets can remain divergent for extended periods.
Choppy markets create false signals
OBV can repeatedly change direction during sideways price action, producing apparent breakouts that disappear quickly.
NVI can also struggle in highly volatile markets where frequent changes in daily volume cause the indicator to update inconsistently relative to the broader trend.
Price action, support and resistance, moving averages and other indicators can provide useful confirmation rather than relying on a single volume line.
Conclusion: Is Negative Volume Index or OBV Better?
For volume confirmation, OBV is generally the better all-purpose indicator.
It continuously connects the direction of the closing price with cumulative volume, making it useful for confirming market trends, breakouts, bullish divergence, bearish divergence and changing buying or selling pressure.
The Negative Volume Index has a narrower role. By responding only when volume falls, NVI isolates how price behaves during quieter trading periods. That can make it useful for long-term trend analysis and positional strategies where low-volume behavior matters more than immediate breakout participation.
The choice is therefore not simply Negative Volume Index vs. OBV, with one universal winner. Use OBV when the question is whether volume supports the current price trend. Use NVI when the question is whether that trend remains healthy specifically during lower-volume periods.
Neither should be treated as a leading indicator that reliably predicts future prices. Volume confirmation improves context; it doesn't remove uncertainty.
Frequently Asked Questions
Is OBV better than the Negative Volume Index?
OBV is generally better for broad trend and volume confirmation because it reacts to almost every period in which the closing price changes. NVI is more specialized and is generally more useful when the analysis specifically focuses on lower-volume periods.
What does it mean when OBV rises?
When OBV rises, volume on periods with higher closing prices is outweighing volume on periods with lower closing prices. This is commonly interpreted as increasing positive volume pressure or buying pressure, especially when price is also rising.
Is Negative Volume Index a smart-money indicator?
NVI is traditionally associated with the idea that better-informed investors may be active during quieter market periods, but it doesn't identify institutional investors directly. It simply tracks percentage price changes when trading volume is lower than during the previous period.
What is bullish divergence in OBV?
Bullish divergence occurs when price trends downward while OBV begins rising or forms a stronger low. It suggests that cumulative selling pressure may be weakening, but a price reversal still requires confirmation from subsequent price action.
What is bearish divergence in OBV?
Bearish divergence occurs when price rises while OBV trends downward or fails to confirm new price highs. It can indicate weakening volume participation behind the advance, although strong price trends can continue despite divergence.
Can OBV and Negative Volume Index be used together?
Yes. OBV can measure the broader cumulative volume trend while NVI isolates price behavior during declining-volume periods. When price, OBV and NVI move in the same direction, they provide confirmation through different calculation methods rather than merely duplicating the same signal.
Disclaimer: Technical indicators are analytical tools, not guarantees of future market performance. Historical signals, divergences and volume relationships can fail, particularly in volatile or low-liquidity markets. Trading decisions should consider price structure, risk management and broader market conditions rather than relying on NVI, OBV or any other indicator alone.







