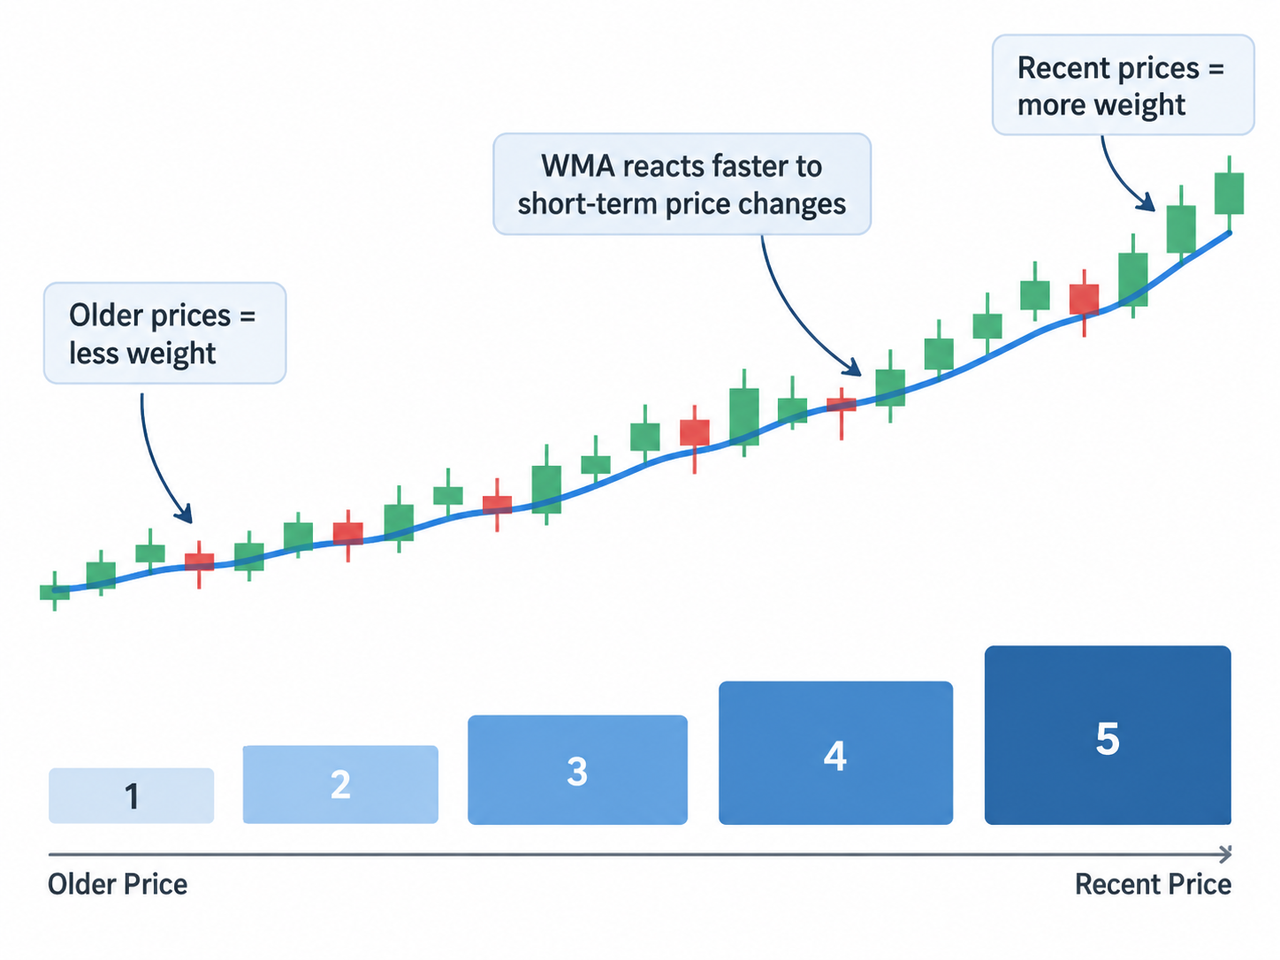
That responsiveness makes WMA useful for traders watching short-term trends, pullbacks and changes in momentum. The catch is sensitivity: a line that reacts sooner can also respond more strongly to temporary market noise.
Here, WMA means Weighted Moving Average. The acronym can also refer to Microsoft's Windows Media Audio format, WMA features built-in Digital Rights Management support. or, in a completely different context, a Wildlife Management Area. Those meanings aren't related to technical analysis.
Key Takeaways
-
WMA gives progressively more weight to the most recent price data.
-
A standard 5-period WMA typically uses weights of 5, 4, 3, 2 and 1 from newest to oldest observation.
-
WMA follows recent price movements more closely than an equivalent Simple Moving Average.
-
SMA, WMA, EMA and TMA smooth data differently, so their responsiveness and lag aren't identical.
-
WMA can help identify short-term price trends, but its sensitivity can create false signals in sideways or volatile markets.
What Is the WMA Weighted Moving Average?
A Weighted Moving Average calculates an average price across a defined number of periods while assigning a different weighting factor to each observation. The newest price typically receives the highest weight, with the weight falling progressively for older data.
That is the main difference from the Simple Moving Average, which gives every price in its calculation equal importance.
Suppose price rises sharply during the latest candle. That recent change has a greater impact on the WMA than on an SMA covering the same number of periods. The WMA therefore tends to turn sooner when short-term price behavior changes.
Fidelity's technical description of WMA likewise defines it as a moving average that assigns heavier weighting to more recent data.
This doesn't mean WMA predicts where price will go next. It describes recent price trends with less smoothing than slower traditional moving averages, making it useful when responsiveness matters more than maximum stability.
How Is the WMA Indicator Calculated?
The standard formula is:
WMA = Sum of (Price × Weight) ÷ Sum of Weights
Consider a 5-period example:
| Period |
Closing Price |
Weight |
| Oldest |
$100 |
1 |
|
$102 |
2 |
|
$103 |
3 |
|
$105 |
4 |
| Most recent |
$108 |
5 |
Multiply each closing price by its assigned weight:
WMA = [(100 × 1) + (102 × 2) + (103 × 3) + (105 × 4) + (108 × 5)] ÷ 15
WMA = 1,573 ÷ 15 = $104.87
The newest $108 price has five times the weight of the oldest $100 observation. When another period closes, the calculation moves forward, new data enters, and the oldest observation drops out.
A 10-period WMA commonly follows the same process with weights from 10 down to 1. A shorter time period produces greater sensitivity, while adding more periods generally creates a smoother line with more lag.
The exact calculation can be handled automatically by modern charting tools, but understanding the process helps explain why the indicator behaves differently from other moving averages.
How Traders Read a WMA Moving Average
The direction of the WMA provides a simple first signal.
A rising WMA indicates that recent prices are pulling the weighted average higher. Price remaining above a rising WMA can support an existing bullish short-term trend interpretation, while price below a falling WMA can support a bearish one.
Crosses also attract attention. If price moves from below to above the WMA, traders may interpret that as evidence that recent price behavior is strengthening. A move back below it can suggest weakening momentum.
Those crosses aren't guarantees. In a sideways market, price can cross a sensitive moving average repeatedly without producing a meaningful trend.
WMA can also behave as a dynamic support or resistance area. During an established uptrend, pullbacks may stall around a rising moving average. During a downtrend, rallies may struggle near a falling line. These are areas to observe, not fixed resistance levels or support levels.
For a practical chart example, a trader can open the BTC/USDT market on Gate.com, add a moving average and zoom between timeframes to see how changing the number of periods affects responsiveness.
WMA vs. Simple Moving Average, EMA and TMA
Moving averages share one basic purpose: they smooth price data to make market trends easier to see. Their weighting rules determine how quickly they respond.
| Moving Average |
Weighting Method |
Typical Behavior |
| SMA |
All prices weighted equally |
Smooth, relatively slower |
| WMA |
Recent prices receive linearly greater weight |
Responsive to recent changes |
| EMA |
Recent prices receive exponentially greater influence |
Responsive, with exponential decay |
| TMA |
Price is effectively smoothed twice |
Very smooth, generally more lagged |
| DEMA |
Combines EMA calculations to offset some lag |
Designed to reduce lag |
The Simple Moving Average weighs all prices equally. WMA deliberately emphasizes the most recent prices, so it typically stays closer to current price action.
An Exponential Moving Average also emphasizes recent data, but its formula applies exponential weighting rather than the linear weighting commonly used by WMA. The EMA 9 indicator, for example, is designed for short-term price momentum.
It would be too broad to say EMA is always faster than WMA. Responsiveness depends on the selected period, the weighting formula and the sequence of prices being measured.
A Triangular Moving Average (TMA) moves in the other direction. It effectively applies double smoothing, commonly by calculating an SMA of an SMA. That places relatively greater influence around the middle of the data window and generally creates a smoother but more lagged result. Schwab's Triangular Moving Average documentation describes it as a double-smoothed SMA.
This creates a useful spectrum: WMA prioritizes responsiveness, while TMA prioritizes smoothing.
Using WMA to Track Short-Term Price Changes
WMA is most helpful when traders combine its direction with actual price structure.
Imagine price is producing higher highs and higher lows while a short-period WMA is also rising. Price then pulls back toward the moving average but remains above an established swing low. In that situation, the WMA supports what the price chart is already showing: the short-term trend remains upward unless the structure changes.
Horizontal levels add another layer. Daily High/Low levels can identify broader intraday support and resistance areas, while Session High/Low levels show price extremes within a particular trading session.
Volume matters too, but it isn't part of the standard WMA formula. WMA weights price based on recency. VWAP, by contrast, incorporates both price and trading volume to estimate an intraday volume-weighted average price.
That distinction can help traders choose tools based on the question they're trying to answer: WMA focuses on recent price direction, while VWAP provides a volume-sensitive intraday benchmark.
WMA Periods and Sensitivity
There is no universally ideal WMA period.
A very short WMA reacts quickly. That may be helpful for scalping or short-term trading, but it can also generate more noise and rapid signal changes. Increasing the period makes the indicator slower and smoother.
The principle is similar to comparing the EMA 9, EMA 20 and EMA 50: shorter settings prioritize recent movement, while longer settings place more importance on the broader trend.
Traders can therefore begin with the timeframe and strategy rather than searching for one perfect number. The appropriate setting ultimately depends on how much lag and sensitivity the strategy can tolerate.
Limitations of the WMA Indicator
WMA's responsiveness is a double-edged sword.
Giving the newest prices more weight can reduce lag compared with an equivalent SMA, but it also makes WMA more sensitive to abrupt price changes. A temporary spike can pull the line sharply upward before price quickly reverses.
Sideways markets are another problem. Repeated price crosses can create multiple apparent signals without any sustained trend developing.
WMA also doesn't measure volume, volatility or trend strength by itself. Combining it with price structure, resistance areas and other technical indicators can provide more context. For broader intraday trend confirmation, the EMA 50 is less sensitive to individual short-term movements.
No period selection or indicator combination can guarantee a profitable outcome. Moving averages are based on historical price data, so every version retains some lag.
Conclusion
The WMA indicator is a Weighted Moving Average that gives more weight to recent price data, allowing it to react relatively quickly to short-term price changes. A standard WMA uses progressively larger weights as observations become more recent, which makes it more responsive than an equal-period SMA.
That responsiveness is most helpful when traders want to follow short-term trends or monitor pullbacks. It can also become a weakness during noisy or range-bound markets.
WMA works best as a trend reference alongside price structure, support and resistance, volume and appropriate risk management rather than as a standalone prediction tool.
FAQ
What does WMA mean in trading?
WMA stands for Weighted Moving Average. It is a technical analysis indicator that assigns more weight to recent prices than older prices so the moving average responds more strongly to current price behavior.
Is WMA better than SMA?
Neither is universally better. WMA emphasizes recent data and usually reacts sooner, while SMA gives each observation equal weight and produces greater smoothing. The useful choice depends on the trader's timeframe, strategy and sensitivity preferences.
Is WMA faster than EMA?
Not necessarily. WMA commonly uses linear weights, while EMA applies exponentially decreasing weights to older observations. Their relative responsiveness depends on the period and the actual price sequence, so EMA shouldn't automatically be described as faster in every situation.
Does WMA use volume?
No. A standard Weighted Moving Average assigns weights according to how recent each price observation is. It doesn't use trading volume in its formula.
In trading, WMA means Weighted Moving Average. In computing, WMA also stands for Windows Media Audio, Microsoft's audio compression technology associated with .wma files. Microsoft explains that .wma files are Advanced Systems Format files containing audio, commonly compressed using Windows Media Audio codecs; this meaning has no connection to moving averages or financial markets. Microsoft's Windows Media file documentation confirms the distinction.
No. Windows Media Audio is a digital-audio technology, while Weighted Moving Average is a mathematical price indicator. A .wma audio file can use Microsoft's Advanced Systems Format container, whereas the trading WMA is calculated from price data and weighting factors.
Disclaimer: Technical indicators use historical data and cannot guarantee future price movements or investment outcomes. Cryptocurrency markets can be volatile, and indicators should be interpreted alongside market structure, liquidity, risk management and other relevant information.







