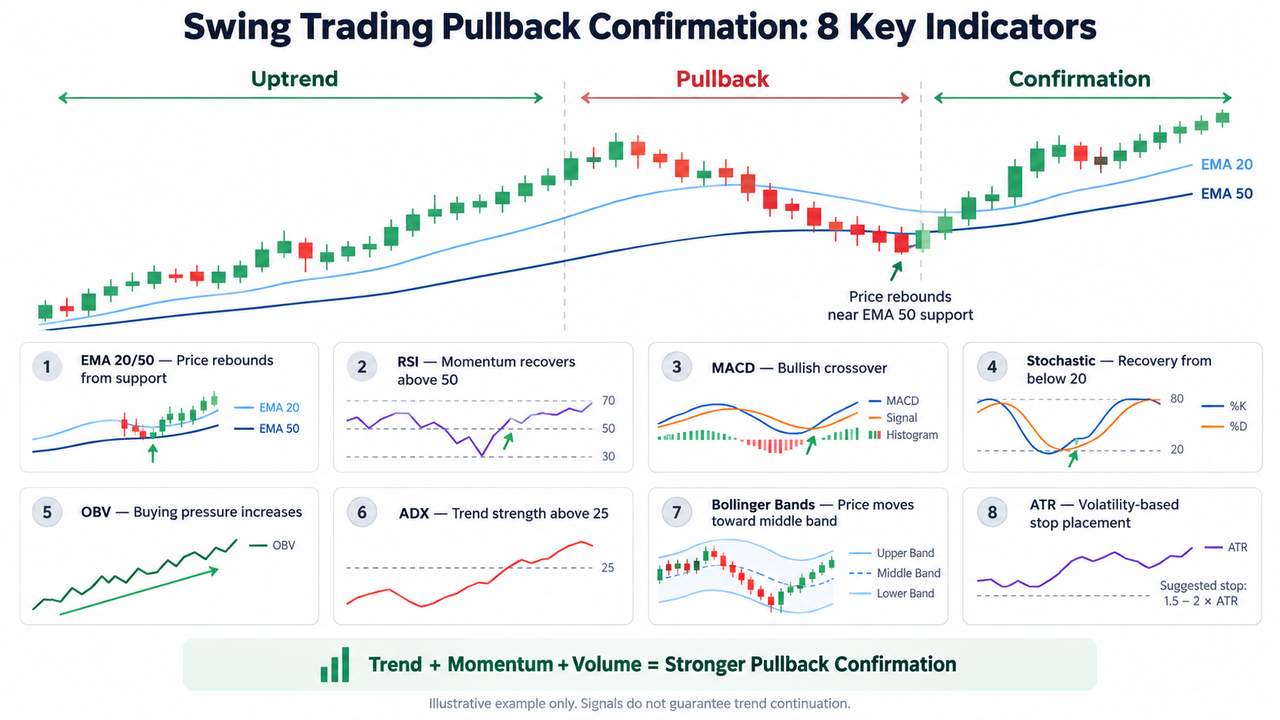
For swing traders holding positions over several days or weeks, the challenge is timing an entry without mistaking a weakening market for a buying opportunity. These eight indicators help assess trend direction, recovery strength, and potential entry and exit points. None can reliably confirm a pullback on its own.
Key Takeaways
-
Moving averages, RSI, and MACD help identify whether a pullback remains consistent with the prevailing trend.
-
Volume confirmation helps distinguish temporary selling pressure from a potential trend reversal.
-
Stochastic Oscillator and Bollinger Bands highlight momentum shifts and possible recovery zones.
-
ADX measures trend strength, while ATR helps traders adjust risk management to market volatility.
-
Combining trend, momentum, and volume indicators with price action can reduce dependence on isolated trading signals.
What Are Pullbacks in Swing Trading?
A pullback is a temporary price movement against an established market trend. During an uptrend, prices decline before potentially continuing higher. In a bearish trend, prices may briefly recover before selling pressure returns.
Swing trading strategies often target these temporary corrections because they can create entry opportunities near established support and resistance levels.
The difficulty is knowing whether the original trend remains intact.
A healthy bullish pullback may show declining trading volume, reduced selling momentum, and support near an important price level. A trend reversal, however, may involve sustained selling, broken support, and weakening market structure.
That's why support and resistance indicators work best alongside tools that measure trend strength and momentum confirmation.
8 Best Indicators for Swing Trading Pullback Confirmation
| Indicator |
Primary Function |
Pullback Confirmation |
| EMA 20 and EMA 50 |
Trend direction |
Price rebounds from dynamic support |
| RSI |
Momentum |
Selling pressure weakens |
| MACD |
Trend momentum |
Bullish signal-line crossover |
| Stochastic Oscillator |
Momentum reset |
Recovery from oversold territory |
| On-Balance Volume |
Volume confirmation |
Buying pressure returns |
| ADX |
Trend strength |
Established trend remains strong |
| Bollinger Bands |
Volatility and price extremes |
Price recovers toward middle band |
| ATR |
Volatility and risk |
Stop-loss distance reflects volatility |
-
Exponential Moving Averages (EMA 20 and EMA 50)
Moving averages are among the most practical indicators for swing trading because they smooth price movements and reveal broader market direction.
The 20-period EMA responds quickly to recent price changes, while the 50-period EMA acts as a slower trend filter.
During a bullish pullback, traders often watch whether price approaches the rising EMA 20 or EMA 50 and then recovers.
For example, if ETH falls toward its 50-day EMA without breaking the previous swing low, a bullish recovery candle may suggest renewed buying interest.
The EMA 20 versus EMA 50 swing trading framework helps distinguish short-term weakness from a possible change in trend direction.
Moving averages remain lagging indicators and can produce repeated false signals in sideways markets.
-
Relative Strength Index (RSI)
The Relative Strength Index (RSI) is a momentum oscillator measuring the speed and magnitude of price changes on a 0–100 scale.
Readings below 30 traditionally indicate oversold conditions, while readings above 70 suggest overbought conditions.
However, RSI doesn't need to fall below 30 during every bullish pullback.
In strong uptrends, the 40–50 region can act as a momentum support zone. A recovery above 50 may indicate that selling pressure is fading.
Bullish divergence, where price forms a lower low while RSI forms a higher low, can also indicate weakening downward momentum.
The RSI indicator becomes more useful when its signals align with visible support and bullish price action.
-
Moving Average Convergence Divergence (MACD)
Moving Average Convergence Divergence (MACD) measures changes in trend momentum using the relationship between two exponential moving averages.
Its standard configuration includes:
-
MACD line: 12-period EMA minus 26-period EMA
-
Signal line: 9-period EMA of the MACD line
-
Histogram: Difference between MACD and signal lines
A bullish crossover occurs when the MACD line crosses above its signal line.
During a pullback, shrinking negative histogram bars or an upward MACD crossover can indicate improving momentum.
A crossover above the zero line provides another form of bullish confirmation, although it may arrive after the initial recovery.
As Fidelity's MACD reference explains, frequent crossovers in sideways markets can produce unreliable trading signals.
-
Stochastic Oscillator
The Stochastic Oscillator compares the closing price with its recent high-low range.
Readings below 20 typically indicate oversold conditions, while readings above 80 indicate overbought conditions.
During an uptrend, traders may watch for the oscillator to recover above 20 following a temporary decline.
A bullish crossover between its %K and %D lines can provide additional momentum confirmation.
The catch is that oversold readings can persist during strong bearish price moves.
Stochastic signals are therefore more meaningful when a bullish candlestick pattern appears near an established support level.
-
On-Balance Volume (OBV)
On-Balance Volume tracks buying and selling pressure by adding volume when prices close higher and subtracting it when prices close lower.
During a constructive bullish pullback, OBV may remain relatively stable even as the market price declines.
This can suggest that selling pressure is less aggressive than the price movement initially appears.
A rising OBV alongside recovering prices strengthens the case for trend continuation.
Traders also examine whether trading volume expands during the first convincing bullish recovery candle.
The On-Balance Volume indicator provides a cumulative view of participation, although it cannot independently distinguish institutional accumulation from other trading activity.
-
Average Directional Index (ADX)
The Average Directional Index measures trend strength without identifying whether the market is moving upward or downward.
ADX readings above 25 are commonly interpreted as evidence of a meaningful trend, although the threshold varies across markets.
During a pullback, a relatively strong ADX reading can support the argument that the existing trend remains established.
Traders often combine ADX with directional movement indicators (+DI and -DI) to assess whether bullish or bearish pressure dominates.
A falling ADX can indicate weakening trend strength, but it doesn't necessarily predict an immediate reversal.
-
Bollinger Bands
Bollinger Bands consist of a moving average surrounded by upper and lower bands, commonly positioned two standard deviations away.
They help swing traders evaluate market volatility and relative price extremes.
During a bullish pullback, price may approach the lower band before recovering toward the middle band.
A close back above the middle band can strengthen a continuation setup when the broader trend remains bullish.
Band contraction, commonly called a squeeze, signals declining volatility and can precede a significant price move in either direction.
Bollinger Bands shouldn't be treated as automatic buy or sell signals because prices can remain near an outer band during strong trends.
-
Average True Range (ATR)
Average True Range (ATR) is a volatility indicator that measures the average trading range over a selected period, commonly 14 candles.
Unlike momentum indicators, ATR doesn't predict trend direction.
Its main benefit is helping traders manage risk around pullback entries.
For example, if an asset trades at $100 with a daily ATR of $3, a 1.5× ATR distance equals $4.50.
Traders sometimes use 1.5× to 2× ATR as a volatility-based stop reference, while checking that the stop is also consistent with nearby market structure.
Fidelity's ATR methodology explains how expanding trading ranges affect volatility measurements.
How to Combine Swing Trading Indicators With Price Action
Reliable swing trading signals depend more on complementary evidence than the number of indicators displayed.
A practical approach combines three different functions:
-
Trend filter: Use EMA 20 and EMA 50 to identify the prevailing market direction.
-
Momentum confirmation: Check whether RSI or MACD indicates that the pullback is weakening.
-
Volume confirmation: Look for recovering OBV or expanding trading volume on bullish candles.
Consider a hypothetical BTC/USDT setup.
Bitcoin approaches its rising 50-day EMA after a 6% correction. RSI stabilizes near 45, MACD's negative histogram contracts, and trading volume increases as price closes above the previous candle's high.
A trader examining the BTC/USDT spot market on Gate.com could compare those signals with nearby price levels before evaluating an entry.
The Fibonacci retracement indicator can add context by identifying potential support zones around the 38.2%, 50%, and 61.8% retracement levels.
These observations increase confirmation, but they don't establish a guaranteed continuation.
Choosing Entry and Exit Points Under Different Market Conditions
Pullback confirmation becomes less reliable when market conditions shift from trending to sideways.
Swing traders should consider the following differences:
| Market Conditions |
Preferred Confirmation |
| Strong uptrend |
EMA support, RSI recovery, rising OBV |
| Weak trend |
ADX improvement and price structure |
| Sideways market |
Support and resistance, reduced reliance on MACD crossovers |
| High market volatility |
Wider ATR-based risk assessment |
| Bearish trend |
Resistance rejection and weakening momentum |
Entry price matters, but invalidation matters just as much.
A stop-loss may be positioned beyond the nearest meaningful support level, with ATR helping assess whether normal volatility could trigger it prematurely.
A fixed-risk method limits the planned loss to a predetermined percentage of trading capital. Actual losses can exceed the intended amount because of gaps or slippage.
Common Mistakes When Using Technical Indicators for Pullbacks
The biggest mistake is treating oversold conditions as proof that prices must recover.
RSI can stay below 30 during a bearish trend, while MACD crossovers may repeatedly fail in sideways markets.
Another problem is indicator duplication. Combining RSI, Stochastic Oscillator, and several similar momentum indicators can create apparent agreement without adding much independent evidence.
Volume, trend, momentum, and price structure generally provide a more balanced framework.
Claims that MACD and RSI combinations achieve a 73% win rate, or that the 50-day moving average achieves 60%, shouldn't be treated as universal performance statistics. Results depend on the asset, timeframe, entry rules, transaction costs, and testing method.
Conclusion
The best indicators for confirming swing trading pullbacks are EMA, RSI, MACD, Stochastic Oscillator, OBV, ADX, Bollinger Bands, and ATR.
Their strongest application is identifying an established trend, recognizing weakening countertrend momentum, and checking whether volume supports the recovery.
Traders should prioritize price action, market context, and proper risk management over isolated indicator signals. Even a well-confirmed pullback can develop into a larger trend reversal.
Frequently Asked Questions
What is the best swing trading indicator for confirming pullbacks?
EMA 20 and EMA 50 are useful starting points because they identify trend direction and potential dynamic support. RSI or MACD can then help determine whether momentum is recovering.
Can RSI and MACD confirm swing trading pullbacks together?
Yes. RSI can identify weakening selling pressure, while MACD tracks momentum shifts and signal-line crossovers. Neither indicator guarantees a profitable trade, and their signals can overlap.
Which indicators work best during high market volatility?
ATR and Bollinger Bands help measure changing volatility. ATR is particularly useful for evaluating stop-loss distances, while Bollinger Bands show relative price positioning.
Is the Stochastic Oscillator better than RSI for swing trading?
Neither is consistently superior. Stochastic can respond quickly to short-term price movements, while RSI is often used to assess broader momentum conditions.
How many indicators should swing traders use?
Three complementary indicators are often sufficient for a basic setup: one trend indicator, one momentum indicator, and one volume indicator. Additional tools should provide different information rather than duplicate existing signals.
Disclaimer
This content is for educational purposes only and does not constitute investment advice. Technical indicators rely on historical price and volume data and cannot guarantee future results. Cryptocurrency trading involves substantial market volatility, liquidity risks, and potential capital losses.







