
Share your thoughts
placeholder
Article
My hand trembled slightly when I set the stop loss a few days ago; this morning, I realized that filial devotion had been unnecessary. 😂
The last thing I saw before bed, $TOSHI was still ranging around 0.0001169. It hadn’t broken above the key level, but I saw that the key level had never been broken. Before the market had fully started moving, my judgment was: hold as long as the pullback doesn’t break the level; it wouldn’t be too late to exit if it did. That dip a few days ago was pretty scary, and I nearly got shaken out, but the logic hadn’t changed. When I opened the chart this morning
post-image
TOSHI-0.71%
SNDK+0.32%
BTC-0.55%
i was curious and looked at the audit (lol) for laptop coin
you will all be happy to know it is made by a web3 consulting company that most recently made "shiba-wings"
like bruh why even hire these people
post-image
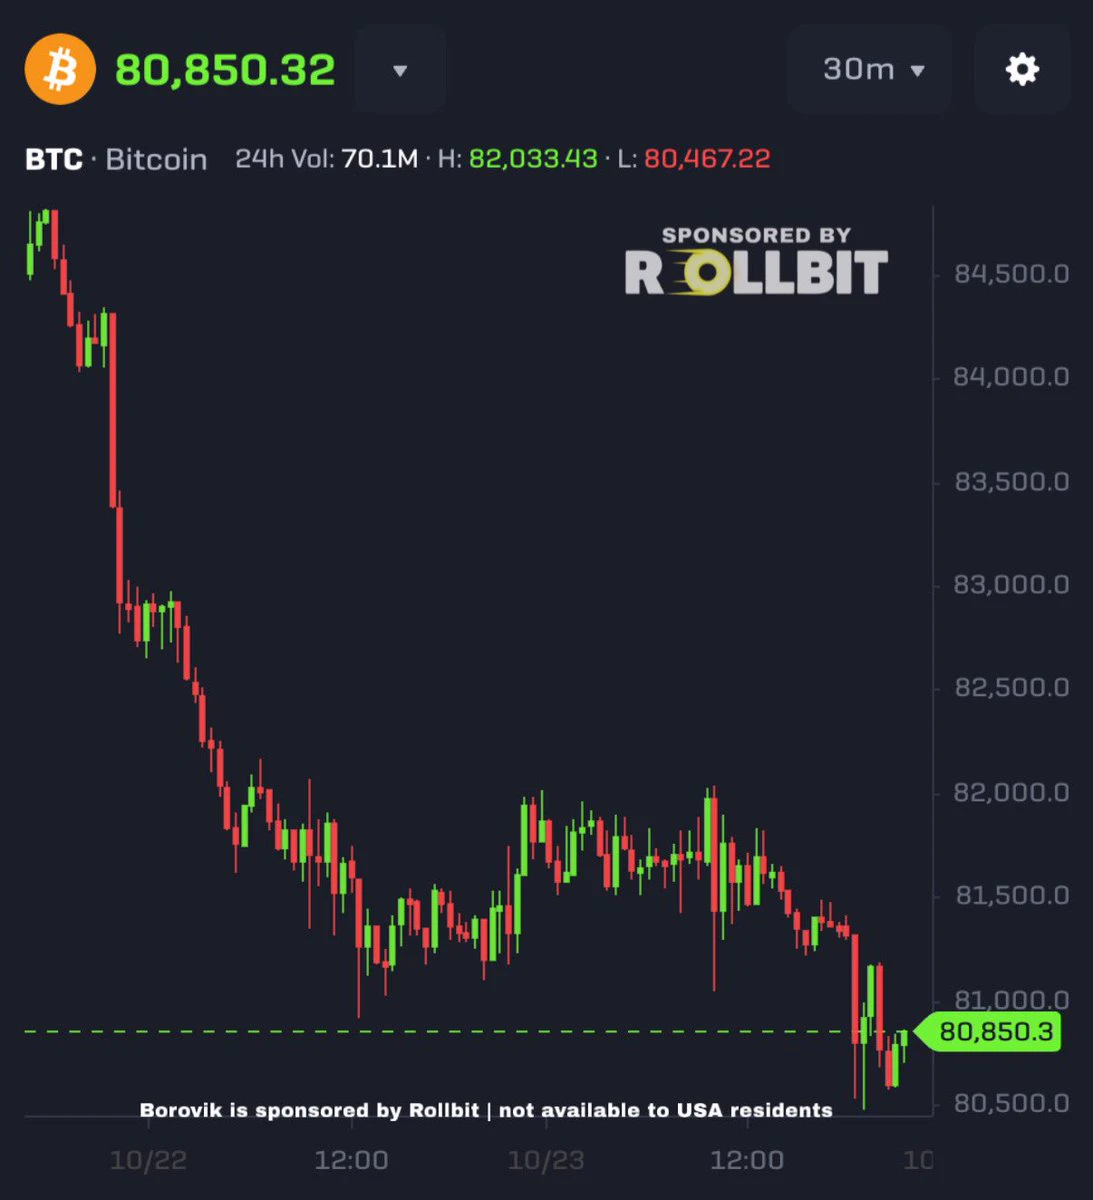
BTC gives me the feeling that it doesn’t want to fall, but it also doesn’t dare to rise.
USDT’s market cap has been fluctuating within a range since August 27.
There have been no capital inflows, but for now there have also been no obvious outflows. (There has been a slight outflow, and USDT has shown a slight tendency toward a negative premium, but it is not significant.)
Friday’s CPI data may come in line with or even below expectations, but there may still be no clear downward trend, and it may not necessarily provide a definitive answer on whether rates will be raised.
Brother Feng does no
BTC-0.53%
MSTR-1.49%
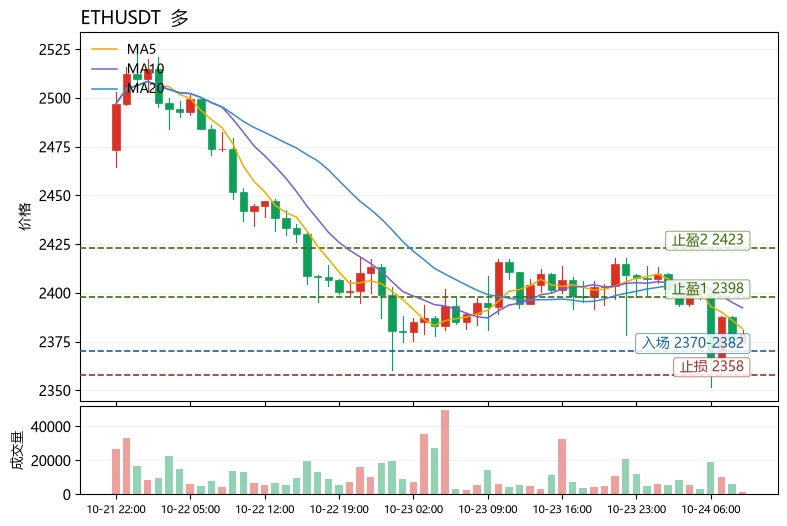
Insiders are watching $LINK /USDT squeeze past 12.80 with quiet confidence.

$LINK /USDT - LONG

Trade Plan:
Entry: 12.695 – 12.801
SL: 12.241
TP1: 13.129
TP2: 13.382
TP3: 13.763

Why this setup?
Why now? The daily trend is bullish, the 1h ATR of 0.211428 signals expanding volatility, and the 15m RSI at 30.93 shows oversold relief. The entry zone sits between 12.695 and 12.801, targeting TP1 at 13.129 and TP2 at 13.382, with the 1h price currently at 12.748. Invalidation is drawn hard at 11.747, which is the line in the sand that protects the long bias.

Debate:
Are we hitting TP2 or getti
LINK+3.66%
No big-picture thinking, can't hold; the profits this round are paper-thin, but I love it to death. Just after lunch, when checking the chart, $HEMI climbed back near 0.008967, with resistance sitting up there. Every push upward fell just short. One look at the trend and I knew it wouldn't break higher, so I shorted right away and waited for the pullback. 🍲

Now at 0.008731, +52.69%—this round wasn't for nothing. Everyone on board should be waking up with a smile. It feels really good. Time for a proper meal. With a trend like this, I don't even need to think—the account is out there dancin
post-image
HEMI-24.79%
ZEC-4.37%
BTC-0.55%
$FLR burn is starting to ramp up fast.. 🔥
The burn spikes are getting bigger after FIP.16.
More usage = more $FLR burned = becoming deflationary.
Don't just trust it, look at it all live on-chain.
post-image
FLR-0.83%
Commence short 🕹️🫰🐻
post-image
  • 1
$1000 to $100,000 Crypto Trade Challenge Today
live-cover
LIVE1,559
hyperliquid:native 🎯
HTF still holding, no major change. Crazy pump, RSI high but no signs of stopping yet ✔️
1H: weak H&S formed → led to this dump. Trendline could get tested if BTC sweeps M/O. Break = deeper pullback, possible sweep of $80
1D: bearish engulfing candle forming, hints at deeper pullback IF it closes like this. Losing M/O could send us to $80, $78, or even $76 retest if we get a dump around PPI/CPI
1W: RSI still stretched. Another red close = 2 bearish divergences in 3 weeks (huge, but too early to call)
Huge untested 1W FVG below that we'll likely tag eventually
Not opening
HYPE-2.20%
BTC-0.53%
$XLM /USDT is range-bound, but the 1h setup hints at a short squeeze nobody is talking about.

$XLM /USDT - SHORT

Trade Plan:
Entry: 0.19221 – 0.19365
SL: 0.19983
TP1: 0.18775
TP2: 0.18430
TP3: 0.17913

Why this setup?
Why now? The daily trend is range, yet the 1h ATR of 0.002876 shows volatility is compressing, which often precedes a directional burst. The 15m RSI at 58.47 is neither overbought nor oversold, meaning the next impulse can run hard without a warning divergence. The entry zone at 0.19293 aligns perfectly with the 1h price, giving a clean trigger for a short bias. TP1 at 0.187
post-image
XLM+5.28%
Everyone is sleeping on SYMBOL but the 4h setup says otherwise.

$HYPE /USDT - LONG

Trade Plan:
Entry: 84.853 – 85.301
SL: 82.928
TP1: 86.689
TP2: 87.763
TP3: 89.375

Why this setup?
Why now? The daily trend is bullish and the 1h ATR of 0.895449 shows enough volatility to fuel a clean move. The 15m RSI sits at 34.93, meaning the asset is approaching oversold territory without being stuck there. The entry zone between 84.853 and 85.301 around 85.077 offers a precise ref for a long with room to breathe. TP1 at 86.689 and TP2 at 87.763 are realistic targets if momentum holds, while the invali
post-image
HYPE-2.21%
I wasn't even expecting to break even, but it directly put me in profit. This service really came through🙏. Held $LINK from 11.416 all the way to 12.761, +834.7%. All that waiting was worth it—really worth it.

The last thing I saw before bed was the market still grinding sluggishly, and I was honestly a little nervous too. But bottom consolidation is the most honest signal: funds were quietly accumulating, not buying blindly. So I didn't hesitate much—I placed a long order as planned and waited for the market to give me an answer. It really did, and rather forcefully.

I closed 75% of the
post-image
LINK+3.66%
BNB-0.95%
ADA+1.05%
$SOL I’m bearish on this move. It fell 2.7%, while the retail long-short ratio rose from 1.96 to 2.02 and the large traders’ ratio rose from 2.43 to 2.50—both sides increased their long positions in the same direction, and no one has capitulated. This is not the structure of a bottom. The funding rate flipped from positive to negative, meaning those willing to pay to go long have exited; in the past hour, only 4 short positions were liquidated, while not a single long was liquidated, showing that none of the leverage has been forced out and all the overhead positions are still stacked above. I
post-image
SOL-1.07%
Insiders are quietly pressing short on $XAUT /USDT while the range traps longs.

$XAUT /USDT - SHORT

Trade Plan:
Entry: 4405.2 – 4410.2
SL: 4431.3
TP1: 4390.0
TP2: 4378.1
TP3: 4360.4

Why this setup?
Why now? The daily trend is range, which means $XAUT /USDT is coiling inside a narrow band and a directional breakout is overdue. The 1h ATR of 9.8535 shows volatility is compressed, so a sudden expansion could fuel a swift move toward the short entry zone at 4407.7. With the 15m RSI at 54.11, momentum has not yet exhausted itself, leaving room for the first target at 4390.0 and a deeper test
XAUT-0.22%
I did nothing—just went to the restroom, and when I came back, the candlestick chart had already done the work for me. During the intraday bottoming phase, $HYPE hovered around 83.949 for most of the day. It ranged sideways at the bottom without breaking down, so I judged that this wasn’t distribution but accumulation. I told myself then: hold this level and wait for it to show its hand. Bottoming is the biggest test of patience, but as long as the structure remained intact, I chose to believe. 🤣

I opened a long position and then went to take care of other things. When I opened the chart ag
post-image
HYPE-2.21%
ETH+0.24%
BTC-0.55%
Crypto Market and Trading Insights
live-cover
LIVE357
Insiders are quietly setting up a massive short on SOXL right now

$SOXL /USDT - SHORT

Trade Plan:
Entry: 126.17 – 126.73
SL: 129.09
TP1: 124.47
TP2: 123.15
TP3: 121.16

Why this setup?
Why now? The 1h price is sitting at 126.45 inside a tight entry zone between 126.17 and 126.73, giving us a precise trigger. The 1h ATR of 1.101089 shows the current volatility is compressed enough to expect a sharp move. The 15m RSI at 55.47 means the asset is not overbought yet, leaving room for sellers to dominate. The daily trend is range, which often breaks down violently in one direction once the rang
SOXL+1.22%
Nobody is talking about this bullish setup hiding in plain sight right now.

$USELESS /USDT - LONG

Trade Plan:
Entry: 0.22428 – 0.23130
SL: 0.19408
TP1: 0.25307
TP2: 0.26992
TP3: 0.29520

Why this setup?
Why now? The daily trend is firmly bullish, and the 1h ATR of 0.014044 shows volatility is compressing just before a potential expansion. The 15m RSI at 54.85 proves there is no overbought exhaustion yet, while the 1h price sitting at 0.22779 places us exactly at the entry reference. This means the entry zone between 0.22428 and 0.23130 is live, targeting TP1 at 0.25307 and TP2 at 0.26992,
USELESS+4.25%
Nobody is talking about this hidden bearish setup in HOME.

$HOME /USDT - SHORT

Trade Plan:
Entry: 0.006 – 0.006
SL: 0.006
TP1: 0.006
TP2: 0.006
TP3: 0.006

Why this setup?
Why now? The daily trend is bearish, which sets the stage for a continuation move. The 1h price is sitting at the exact entry zone, giving us a precise trigger. The 15m RSI is at 52.13, showing just enough momentum to push lower without being overextended. The 1h ATR is 0.000053, confirming that the volatility is compressed enough for a sharp breakdown. The invalidation level is the line in the sand, and breaching it me
HOME-0.17%
Load More

Join 40 M users in our growing community

⚡️ Join 40 M users in the crypto craze discussion

💬 Engage with your favorite top creators

👍 See what interests you

View More