




Share your thoughts
placeholder
Article
The hand that set the stop-loss a few days ago trembled slightly; this morning, I realized that was unnecessary filial piety. Before bed, I placed the short order for $TUT , and when I woke up, the candlestick had already completed most of the move for me 😏
Watching the market at the time, the rebound had no volume, and every push upward felt weak. The selling pressure above was obvious—someone was rushing to exit every time the price tested a high. This structure was not a breakout, but a bull trap. I set the entry at 0.042201 in advance; when it was time to short, I shorted without hesitati
post-image
TUT+23.75%
SNDK+1.95%
BNB+7.64%
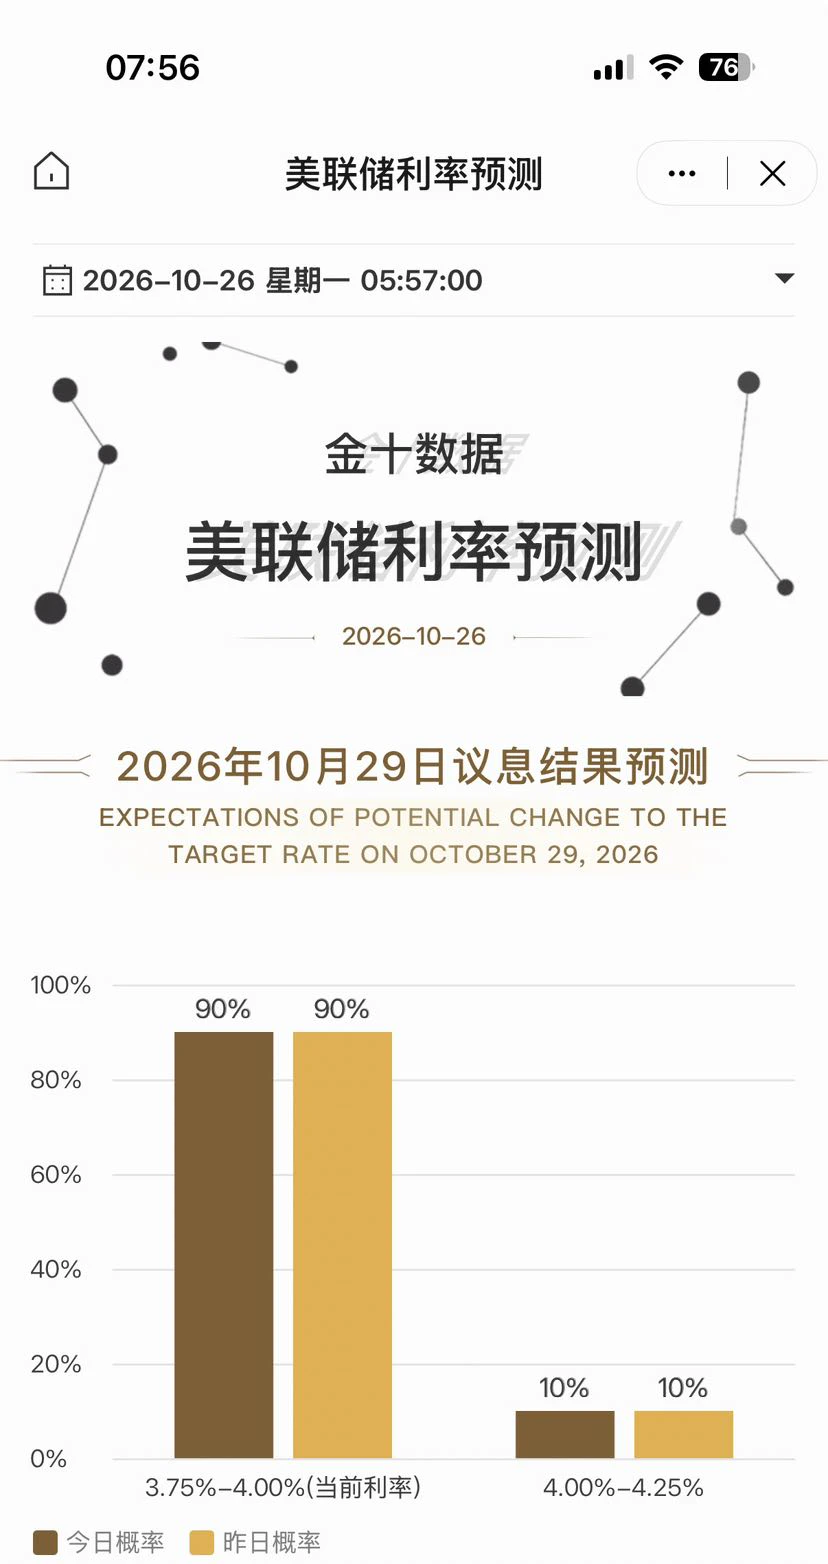
The probability of a Fed rate hike in September fell from 66% to 50% in just a few days. Fed Chair Christopher Waller sent a clear dovish signal, saying that if inflation slows further, he would support keeping rates unchanged in September. Bitcoin broke above $82,000, gold rose above $4,500, and U.S. stocks posted their biggest gain in nearly a month. What does such a sharp drop in expectations mean? How is the logic of crypto market pricing being reshaped?
Nobody's watching ONDO at 0.3699—but the 4h chart is about to force a decision.

ONDO/USDT - LONG

Trade Plan:
Entry: 0.3690 – 0.3708
SL: 0.3616
TP1: 0.3761
TP2: 0.3803
TP3: 0.3865

Why this setup?
Why now? The 1D trend is bullish, and price is holding just above the 0.3690 support floor with a 95% long confidence. RSI on the 15m is at 52.93—room to run, not overheated. ATR shows tight volatility, so the breakout from this coil could snap fast toward TP1 at 0.3761. This is the calm before the expansion.

Debate:
Are you scaling in at 0.3699, or waiting for a retest of 0.3690 to add size?
ONDO+4.54%
Ondo Stock Token Race: Hold for Cash, Trade to Win 50,000 USDT
https://www.gate.com/share/act/824a0a1b
post-image
ONDO+4.54%
  • 4
Why did Arbitrum get so arbitrary? Because it decided to surge without warning.
$ARB ‌ARB/USDT – Up 24%, facing resistance near 0.17045
Short (rejection from resistance)
Entry Zone: 0.1660 – 0.1680
TP1: 0.1620 / TP2: 0.1580 / TP3: 0.1540
SL: 0.1720
Long (pullback to support)
Entry Zone: 0.1580 – 0.1590
TP1: 0.1620 / TP2: 0.1660 / TP3: 0.1700
SL: 0.1550
Key Levels
Resistance: 0.16665 / 0.17045 (recent peak)
Support: 0.1620 / 0.15904 / 0.14764 / 0.13623
⚠️ Not financial advice. DYOR and manage your risk.
ARB+30.80%
My long position made a round trip, and today I finally saw the protective level do its job. The drop a few days ago came sharply; to be honest, I was somewhat panicked because a lot of the unrealized profit had already been given back. But since I had placed a stop-loss order in advance, I didn’t have to watch the market all night trying to guess the key level. Once the price climbed back above 0.0116, I first took profit on 30% of the position, while moving the protective level higher with the trend for the remaining 70%. This wasn’t about predicting how much further the price could rise; I
post-image
LAB+3.22%
SNDK+1.95%
Nietzsche called it the most genial building ever created.
post-image
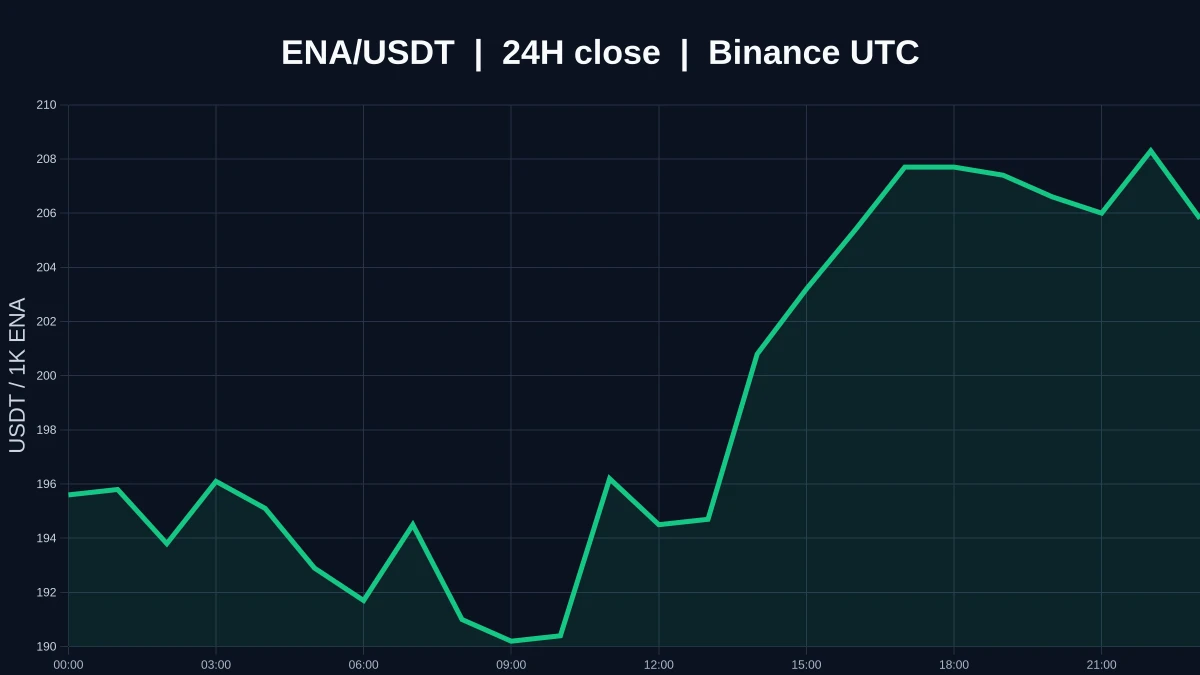
This $ENA long position has really tested my patience. After entering around 0.15082, it kept grinding sideways. Several pullbacks in between swept the stop-losses of quite a few people, but I knew that as long as the bull-bear dividing level held, the consolidation was within the normal range. The price just surged to 0.16741, with unrealized profit reaching around +529.79%. I reduced the position by 70% as planned, and moved the protection level directly higher on the remaining 30%, so even a pullback from here won't affect my principal.

The most important thing in holding this position wa
post-image
ENA+6.13%
LAB+3.22%
DOGE+7.03%
Everyone’s staring at the wrong side of NEAR while the 4H quietly flips the script.

$NEAR /USDT - LONG

Trade Plan:
Entry: 2.1670 – 2.1918
SL: 2.0599
TP1: 2.2690
TP2: 2.3287
TP3: 2.4183

Why this setup?
- My setup says LONG with 95% confidence, yet the 15m RSI is bloodied at 38.57—that’s the classic “bullish shakeout” fingerprint.
- Price is parked at 2.1794, hugging the 1H ATR (0.0497) like a coiled spring. The 1D trend is still bullish, so this dip is the invitation, not the obituary.
- Why now? The “Waiting” status is the tell—the market is loading the cannon before TP1 at 2.2690 an
NEAR+3.61%
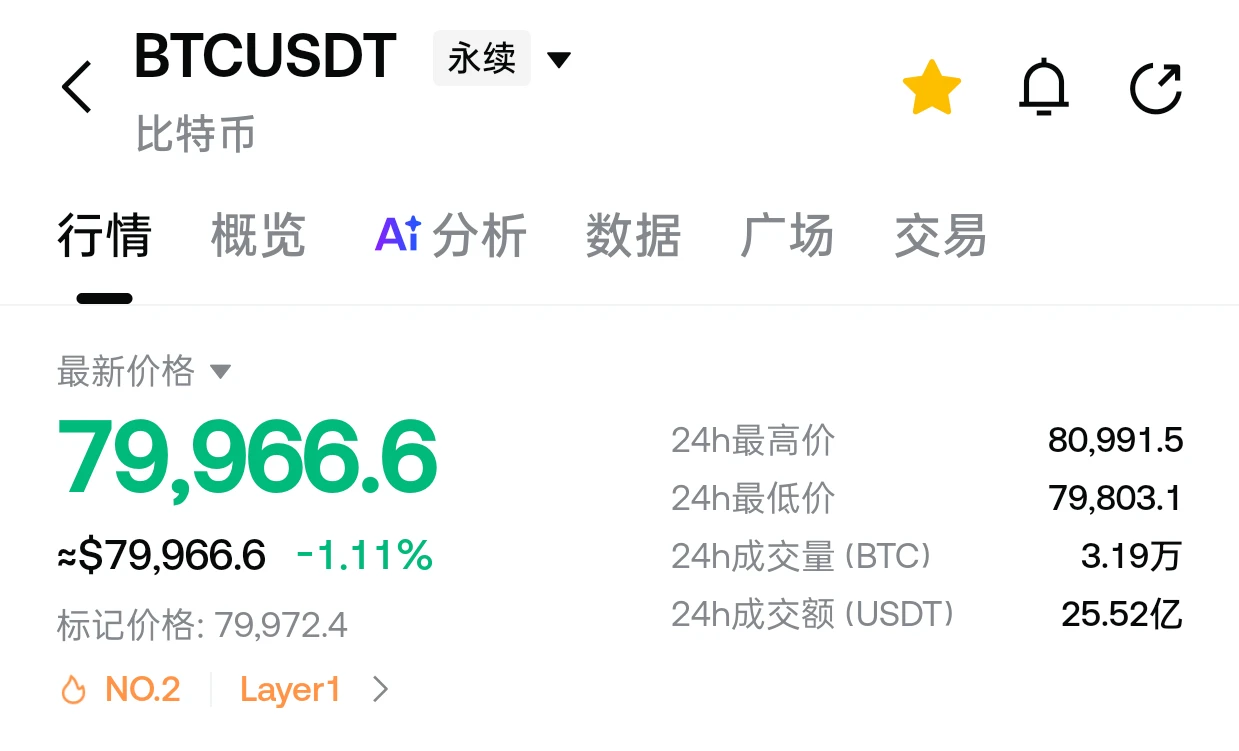
Bull-Bear Divide Deepens Around $82K! B.TOP Founder Sells All His BTC
live-cover
LIVE61
The opportunity is still there, be patient.

$ADA $SOL
post-image
ADA+4.26%
SOL+2.25%
Everyone’s watching Bitcoin—but $LAB /USDT is quietly setting up a 95% confidence trap.

$LAB /USDT - SHORT

Trade Plan:
Entry: 0.07477 – 0.07525
SL: 0.07728
TP1: 0.07331
TP2: 0.07217
TP3: 0.07046

Why this setup?
Why now? The 4H chart screams exhaustion.
- 1D trend is bearish, and price is hugging the 0.07501 reference—a classic dead-cat bounce zone.
- RSI (15m) at 55.95 shows weak momentum, not strength—buyers are fading.
- ATR (1h) at 0.000947 means volatility is compressed; the next expansion usually follows the path of least resistance: down.
- Targets are stacked: TP1 at 0.073
LAB+3.22%
The hand that set the stop-loss a few days ago trembled slightly; this morning, I realized that filial piety was unnecessary.
After the early-session dump, $SOL still poked its head up and faked two upward moves around 104.51. The volume kept shrinking, and the resistance above was too obvious. At a spot this heavy with the scent of a bull trap, I went straight in short. Don’t let the range grind away your patience, only to try to win back your dignity in a one-way move.
By the time I came to my senses, the price had already reached 103.3, delivering a return of +109.4%. This round of holding
post-image
SOL+2.25%
ETH+1.57%
SNDK+1.95%
Crypto Signals and Trding Insights
live-cover
LIVE1,228
This was purely the market being in a good mood and casually scattering some gold coins, with one happening to land right on my head. During the repeated intraday swings, $XRP fell just short every time it pushed higher. The candlesticks looked limp, but when I looked at the trading volume, buying pressure had actually been quietly strengthening all along. When everyone was afraid to move, I instead felt it was time to act.

The long position signaled at 1.3845 is now at 1.4149, +204.92%. Feeling good, brothers. This kind of bottoming structure tests your patience the most, but as long as you
post-image
XRP+1.76%
BTC+0.45%
ZEC+0.01%
I originally planned to cut my losses as a sacrifice to the heavens, but the ritual never happened—the meat roasted itself.
With green filling the screen, $XAU kept oscillating around 4474.29, while the sell walls grew thinner each time. There was clearly no big money looking to take the other side. The rebound lacked volume and support, so I followed the trend and entered a short.
I switched over casually and saw it had already dropped to 4438.98, giving me a full +72.11% on paper. That was real meat on the table. It dragged its feet earlier, but the result tastes just as good.
Take profits
post-image
XAU+0.10%
XRP+1.76%
BNB+7.64%
Everyone’s watching 54.17 on $LTC /USDT—but the real trap is what happens below 52.79.

$LTC /USDT - SHORT

Trade Plan:
Entry: 54.02 – 54.32
SL: 56.01
TP1: 52.79
TP2: 51.87
TP3: 50.49

Why this setup?
- 1D trend is *range*, yet 4h momentum is screaming SHORT with 77% confidence.
- RSI on 15m sits at 50.5—no bounce fuel left; price is stalling right under resistance.
- ATR (0.59) shows low volatility—perfect setup for a slow bleed to TP1 (52.79) before a quick flush to TP2 (51.87).
- Why now? Entry zone 54.02–54.32 is a magnet for late longs, but invalidation at 51.03 is far—room to ru
LTC+7.40%
$BULLA Signal】1H momentum weakening + funding rate too high, quick short-term long
$BULLA 4H momentum bars are shortening, RSI 71.5 is flattening at elevated levels, and 1H buying inertia remains. The 0.1175% funding rate is relatively high, the order book bid-ask ratio is 0.99, and depth imbalance is -0.51%. Volume has plunged from the previous hour, with the price trapped in a narrow consolidation range.
🎯Direction: Long
⚡Entry/Limit order: 0.08422-0.08448
🛑Stop-loss: 0.08363
🚀Target 1: 0.08575
🚀Target 2: 0.08638
🛡️Trade management:
- Execution strategy: After reaching Target 1, reduce
post-image
BULLA+199.41%
BTC+0.32%
ETH+1.56%
SOL+2.17%
Everyone’s staring at LTC’s range—but the 77% short signal says the exit door is already open.

LTC/USDT - SHORT

Trade Plan:
Entry: 53.89 – 54.17
SL: 55.80
TP1: 52.70
TP2: 51.82
TP3: 50.49

Why this setup?
- Price is pinned at 54.03 while 4h momentum rolls over; RSI 15m at 47 shows no buying spark.
- ATR 1h (0.57) is tight—this coil snaps fast, and TP1 at 52.70 is only 2.5% away.
- 1D trend is *range*, not bull—so this isn’t a dip-buy, it’s a mean-reversion gift.
- Why now? Entry zone 53.89–54.17 is the last polite area before the slide to 51.82.

Debate:
If LTC breaks 53.80, do you
LTC+7.26%
But there is one type of person I don’t recommend chasing: those who only want to get in after seeing a rise. Entering at this level leaves them uneasy, and they’ll run at the first bout of volatility. Wait and see what the next round of structure brings. Putting risk control first is called rationality; cutting losses after taking a hit is called decisive loss-cutting. There will be more opportunities ahead. Opportunities are waited for, not snatched.
$SOL $DOGE
post-image
SOL+2.25%
DOGE+7.03%
Load More

Join 40 M users in our growing community

⚡️ Join 40 M users in the crypto craze discussion

💬 Engage with your favorite top creators

👍 See what interests you

View More