
Share your thoughts
placeholder
Article
I originally wanted to cut my losses and sacrifice the meat to the heavens, but the sacrifice never happened—the meat roasted itself.
When the screen was glowing green, $LIT repeatedly hovered around 3.753, with every dip being bought back up. The bottom consolidated without breaking down, while volume quietly expanded—clearly, someone was accumulating amid the chaos.
I went with the flow and opened a long position, betting that this level could hold. Then it shot straight up to 4.739, and +1259.71% was firmly in the bag. This run was worth the wait—I finally got to sink my teeth into a big p
post-image
LIT-0.62%
BTC+0.56%
ZEC+1.61%
Everyone’s cheering SOL at 103.75, but the 4h tape just whispered a secret—are you listening?

$SOL /USDT - SHORT

Trade Plan:
Entry: 103.61 – 103.89
SL: 105.14
TP1: 102.71
TP2: 102.01
TP3: 100.97

Why this setup?
Why now?
- RSI on the 15m is overheated at 66.31 while price hugs resistance—classic exhaustion fuel for a short.
- ATR (0.58) is tight, but TP2 at 102.01 offers a 1.6% drop before the daily range floor.
- Trend is *range*, not bull—mean reversion is the edge, not breakout chasing.
- Confidence 55 is low, but the invalidation at 102.34 keeps risk defined: 1.3% to stop vs 1
SOL+2.55%
U.S job report market impact
live-cover
LIVE1,480
#Gate事件合约晒单挑战
The Rebate Is Not the Edge — Your Execution Is
A 5 USDT rebate can look attractive at first glance.
But when participating in a Gate Event Contract challenge, the better question is not:
“How much can I earn from the reward?”
It is:
“How much does it actually cost me to qualify?”
That difference between headline reward and real net value is where execution discipline becomes important.
A qualifying trade can generate a 5 USDT rebate, but if spread, fees, slippage, poor fills, or unnecessary capital exposure consume most of that amount, the reward may simply be paying you back fo
BTC+0.56%
ETH+1.24%
Labor Day weekend pump enjoyoooors please stand up 🙋‍♂️
post-image
Nvidia’s Growing AI Network Creates Fresh Interest Across the Semiconductor Industry
live-cover
LIVE410
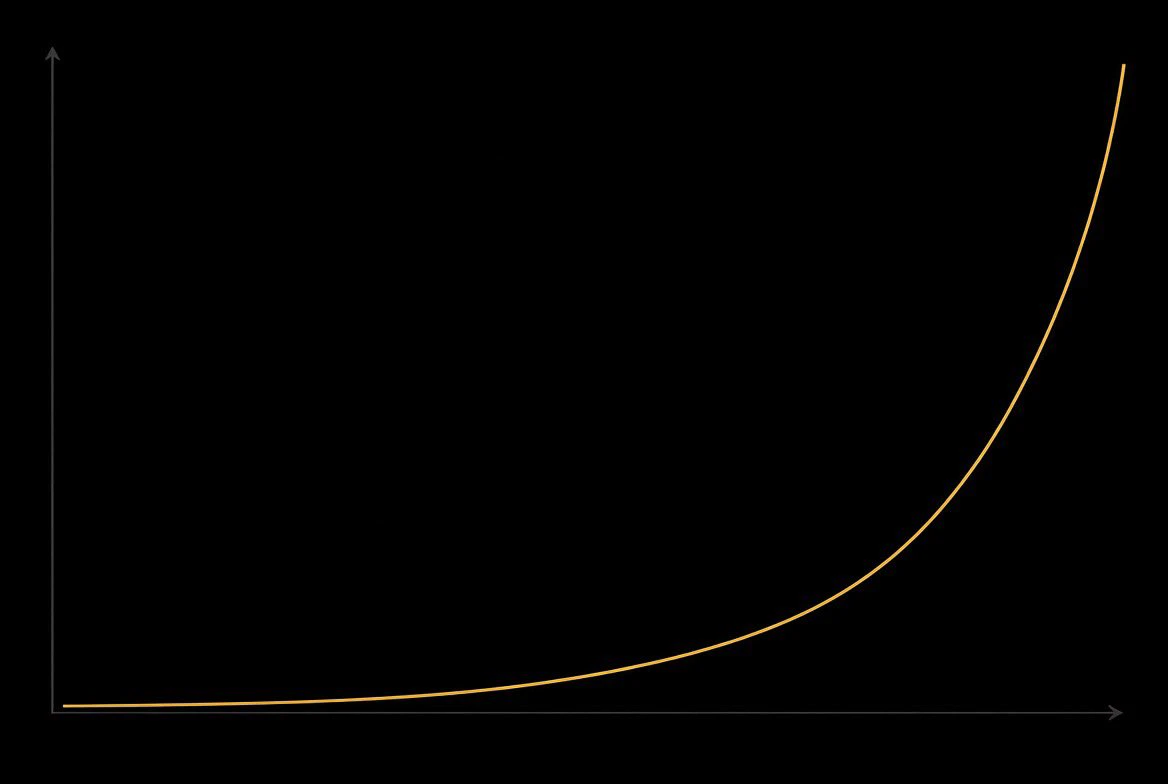
Crypto market cycle.
Do you agree with this?
post-image
$UNITREE Confucius, this original stock, will be priceless once it is listed on the spot market.
post-image
UNITREE+0.30%
Everyone is long LINK while the 4h chart whispers a different story.

$LINK /USDT - SHORT

Trade Plan:
Entry: 12.056 – 12.108
SL: 12.401
TP1: 11.843
TP2: 11.684
TP3: 11.445

Why this setup?
Why now?
- 1D trend is bullish, but the 4h signal says SHORT with 84% confidence—that’s a serious divergence.
- RSI on the 15m is at 62.54, showing short-term momentum is cooling off right at the 12.082 resistance zone.
- ATR (1h) at 0.102 means tight stops—we’re coiling, and the first target is 11.843, a quick 2% move if the rejection holds.
- The setup is waiting, not triggered—so the risk/rewa
LINK+3.84%
September 6 $BTC early-morning analysis
The 4-hour chart continues its range-bound recovery, up 0.78%, with net capital inflows of 143 million and buying funds continuing to return. The price has held above the Bollinger middle band at 79465.4, with solid support at the 78618 low below; large sell orders are placed in the order book, indicating clear overhead selling pressure. The Bollinger upper band at 82352.8 is strong mid-term resistance, while the lower band at 76578 serves as a key defense level. The market is experiencing a recovery rebound after the decline and has not yet entered a s
post-image
BTC+0.54%
ETH+1.21%
#SNDK
SNDK is currently trading around $1,739.85. After the recent sharp upside move, the stock remains in a strong bullish structure, but the price is now entering a zone where resistance, momentum and profit-taking risk become increasingly important.
MOMENTUM STATUS
The technical picture remains bullish, with RSI(14) around 77, indicating that momentum is strong but already in overbought territory. MACD remains positive, supporting the continuation of the current bullish trend.
Overbought does not automatically mean a reversal is coming. It simply means buyers have pushed price aggressively
post-image
SNDK+11.88%
Trumps right hand man..
post-image
Now 1 $BNB = $778
Believe me, it will be worth $800 or even more soon 😉
post-image
CryptoSat
Guys, $BNB is 7% up in the past 24 hours 🔥
The price just broke out of the MA99 on the weekly chart. This is the same level that was rejected in the past two weeks, but it has finally broken through.
I am watching closely to open a long position at 760 - 730, with a stop loss at 718.
Targets: 775, 790, 808, 826, 840, 880
Leverage: 50x
repost-content-media
BNB+8.28%
  • 1
#Gate事件合约晒单挑战
GT BREAKS ABOVE $9
GT has entered a much more important technical zone after breaking through the $9 psychological level. With GT trading around $9.15, the token is now holding above a level that previously acted as a major resistance reference. The key question is no longer whether GT can reach $9 it is whether buyers can turn $9 into sustainable support and build the next leg higher.
THE BREAKOUT STRUCTURE
The move from the recent $8 area toward $9+ represents a strong short-term expansion. Recent market data shows GT previously reached around $8.65 before pulling back, while
post-image
GT+12.08%
Everyone’s watching Bitcoin, but $LTC /USDT’s 15m RSI just screamed at 73—and nobody’s talking about the trap.

$LTC /USDT - SHORT

Trade Plan:
Entry: 54.7 – 54.9
SL: 56.6
TP1: 53.4
TP2: 52.5
TP3: 51.2

Why this setup?
- 4h bias is SHORT with 77% confidence—this isn’t a coin flip.
- 1D trend is *range*, so we’re not chasing a breakout; we’re fading a local pump.
- RSI 15m at 73.16 = overheated micro-move. Mean reversion is the play.
- Entry zone 54.7–54.9, with TP1 at 53.4. Why now? The range ceiling is rejecting momentum, and ATR 1h (0.57) gives us room to breathe.

Debate:
If price
LTC+9.04%
$SUSHI is going to hit 0.27 - 0.3 soon 😍
Buy now ✅
Aim for:
1st expansion zone: 0.27-0.3
2nd expansion zone: 0.35-0.37
3rd expansion zone: 0.4 - 0.47
Move stop loss to entry once 0.285 hits 👍
post-image
SUSHI+32.45%
#Gate60MillionUsers
My first Gate trade still makes me laugh 😂
I remember staring at the chart like I had everything figured out. I saw a move, got excited, and entered without giving much thought to risk.
For a few minutes, everything looked perfect.
Then the market moved against me.
I kept staring at the screen thinking, “It’ll come back.”
Spoiler: it didn’t. 😂
That tiny trade taught me something I still remember today: the market doesn’t care how confident you feel.
Looking back, losing that trade wasn’t the worst part. The funny part was how seriously I thought I knew what I was doing.
post-image
This yield has me feeling nervous, worried the market will come to its senses tomorrow and blacklist me 😅 That false bullish candle during the repeated intraday swings was obviously bait to lure people in to take the bags—I almost applauded it right then.
The resistance above was clear, and the rebound volume couldn’t keep up. Every push upward was just short of breaking through. I set up a short position around 0.4520, not expecting it to crash too hard, just hoping to leave my wallet a way out. As it turned out, the market plunged on its own.
The price has now touched 0.2327, and the short
post-image
BNB+8.34%
XRP+1.84%
Everyone’s watching $MU /USDT at 1015—but the 4h tape is quietly screaming lower.

$MU /USDT - SHORT

Trade Plan:
Entry: 1014.50 – 1016.54
SL: 1025.30
TP1: 1008.18
TP2: 1003.29
TP3: 995.95

Why this setup?
- RSI on 15m sits at 52—no real bounce fuel, just dead air before the drop.
- 1D trend is *range*, meaning shorts win at the top of the box, not the bottom.
- ATR 1h is 4.07—tight enough for a fast flush to TP1 (1008) and TP2 (1003) if 1014.50 breaks.
- Confidence is 55, not 90—so this is a scalp, not a conviction hold.
Why now? Price is stalling at the exact entry_ref with zero m
MU+1.39%
Load More

Join 40 M users in our growing community

⚡️ Join 40 M users in the crypto craze discussion

💬 Engage with your favorite top creators

👍 See what interests you

View More