



Share your thoughts
placeholder
Article
$TRX Faces Resistance Perfectly On The Trendline To The Pink Ascending Triangle ✅️
post-image
TRX-0.06%
This was purely the market being in a good mood and casually tossing out some gold coins—one just happened to land on my head. With the screen glowing green, I kept my eyes on $DGAI ’s order book and noticed it had stopped falling. Trading volume was also shrinking, while buyers at the bottom were unusually determined. I was thinking at the time: isn’t this exactly a sign that the bottoming process is over?

After entering at 0.6959, the price surged straight to 0.7852, putting a +252.85% return right in my face. I timed the rhythm so well that I wanted to applaud myself. Many people die befo
post-image
DGAI-1.51%
BNB-1.14%
SNDK+11.68%
Everyone’s long silver—until they see what’s hiding at 66.24 on $XAG /USDT.

$XAG /USDT - SHORT

Trade Plan:
Entry: 66.12 – 66.36
SL: 67.39
TP1: 65.38
TP2: 64.81
TP3: 63.95

Why this setup?
• 4H bias is SHORT with 55% confidence—not a slam dunk, but the range-bound 1D trend favors selling rallies, not chasing breakouts.
• RSI (15m) at 51.27 is dead neutral, giving price room to drift lower without being oversold.
• ATR (1h) at 0.477 suggests a slow bleed—TP1 at 65.38 is a 1.3R move, TP2 at 64.81 adds another 0.8R.
• Why now? The “Waiting” status means the invalidation at 66.98 is your
XAG-1.30%
Financial News, Crypto Market Updates, Real Trading Strategies
live-cover
LIVE1,218
Most traders still think XLM is going long—here’s why the 4h chart is screaming otherwise.

$XLM /USDT - SHORT

Trade Plan:
Entry: 0.17888 – 0.17984
SL: 0.18398
TP1: 0.17589
TP2: 0.17358
TP3: 0.17011

Why this setup?
Why now?
- 1D trend is *range*, not bullish—so upside is capped.
- RSI (15m) at 45.7 shows weak momentum, but the 4h bias is SHORT with 55% confidence—a slow bleed, not a crash.
- Price sits at 0.17936, right at the entry ref. TP1 at 0.17589 (-1.9%) is the first magnet; TP2 at 0.17358 (-3.2%) if support cracks.
- The alt (long) setup is invalid above 0.18173—so any pump
XLM-3.82%
Everyone’s watching 718, but the real trap is the range above 730—are you shorting the fakeout?

$BNB /USDT - SHORT

Trade Plan:
Entry: 716.83 – 719.47
SL: 730.78
TP1: 708.68
TP2: 702.37
TP3: 692.90

Why this setup?
- BNB sits at 718.15 with a 4h SHORT bias (55% confidence) while the 1D trend chops sideways—no momentum to break higher.
- RSI (15m) at 47.84 shows zero buying pressure; ATR (1h) at 5.26 means moves are tight, but TP1 at 708.68 is a clean 1.3% drop from entry.
- Why now? Price is “Armed” below resistance—if 719.47 holds as the ceiling, downside to 702.37 (TP2) opens fast, b
BNB-1.14%
$ETH Signal】Short-term short, 4H long bearish candle + selling pressure dominant
$ETH The 4H long bearish candle fell 2.18% through EMA20, with aggressive selling dominant and a buy ratio of 0.47. The 1H MACD histogram’s negative value expanded, with the rebound stalling around 2460. Order book depth was -1.15%, with clear suppression from sell-side orders.
🎯Direction: Short short
⚡Entry/limit order: 2445.5513 - 2452.9100
🛑Stop-loss: 2477.4391
🚀Target 1: 2416.1163
🚀Target 2: 2397.7195
🛡️Trade management:
- Execution strategy: Reduce the position by 50% after reaching Target 1 and move th
post-image
ETH-2.49%
We all know how this ends..
Right?
$TROLL
post-image
TROLL+44.73%
TROLLFACE+0.23%
I didn't do anything—just went to the bathroom, and when I came back, the candlestick chart had already done the work for me. 🙂
While the market was bottoming intraday, funds quietly entered. Volume wasn't large, but buying strengthened—a classic accumulation pattern. While everyone else was still waiting, I gave the direction outright.
This move $INTC went straight from 90.88 to 95.83, securing +386.75%. It was truly sluggish at first, but the breakout feels great; those already on board should be grinning in their sleep.
As for the trade: take 80% off the table first, and set the remaining
post-image
INTC+4.61%
SNDK+11.68%
ETH-2.49%
$1000 to $100,000 Crypto Trade Challenge Today
live-cover
LIVE524
Most traders still think $H /USDT is bottoming—the 95% confidence short says otherwise.

$H /USDT - SHORT

Trade Plan:
Entry: 0.07925 – 0.08007
SL: 0.08364
TP1: 0.07667
TP2: 0.07468
TP3: 0.07170

Why this setup?
- 1D trend is bearish, and price is pinned at 0.07966—a weak bounce zone, not a reversal.
- RSI (15m) at 44 shows zero momentum for buyers; every relief pop is getting sold.
- ATR (1h) of 0.001659 means tight stops—perfect for a fast bleed toward TP1 (0.07667) before TP2 (0.07468).
- Why now? The 4h structure is “Armed” with invalidation at 0.07920—if we lose that, shorts are
H+2.23%
Everyone’s long $CL /USDT at 91.15, but the 4h tape is quietly screaming for a fade.

$CL /USDT - SHORT

Trade Plan:
Entry: 90.98 – 91.32
SL: 92.82
TP1: 89.90
TP2: 89.06
TP3: 87.81

Why this setup?
Why now?
- 1D is a **range**, not a breakout—so 91.15 is resistance, not support.
- RSI on the 15m is only 56, meaning no momentum spike to chase longs.
- ATR (1h) at 0.69 shows volatility is compressing—ranges snap fast.
- Short setup targets 89.90 (TP1) then 89.06 (TP2), while invalidation sits at 88.47.
- Confidence is 55.4—not a home run, but a high-probability scalp if 91.32 holds.
CL-0.58%
I had just switched the software to the background when it suddenly shot up—is it playing hide-and-seek with me? A few days ago, PONS was the last thing I looked at before bed. It had been moving sideways at the bottom for several days, with funds quietly entering and buy orders piling up, but the price stayed suppressed and unmoved—a classic night-before-the-breakout setup.
I said it then: don't hesitate to go long. I entered at 0.4156, and when I woke up this morning, 0.6788 had already given me the answer: +1249.3% secured.
Don't let profits inflate your ego, and don't despair over pullback
post-image
PONS+9.14%
BNB-1.14%
XRP-4.83%
$ENJ MASSIVE SEND INCOMING DONT SAY I DIDNT WARN YOU
post-image
ENJ+11.54%
$MARSCOIN Signal】Long — High funding rate + short squeeze brewing
$MARSCOIN Funding rate 0.0618%, with longs facing relatively high holding costs and a short-squeeze setup emerging. The 1H RSI is 64.42, while the MACD histogram has narrowed to 0.0025, indicating weakening momentum. The 4H Bollinger upper band is at 0.1998, leaving 7% room above.
🎯Direction: Long
⚡Entry/limit order: 0.1849136 - 0.1854700
🛑Stop-loss: 0.1833925
🚀Target 1: 0.1885863
🚀Target 2: 0.1901444
🛡️Trade management:
- Execution strategy: Reduce the position by 50% after reaching Target 1, and move the stop-loss up to
post-image
MARSCOIN+67.10%
BTC-2.50%
ETH-2.51%
SOL-3.50%
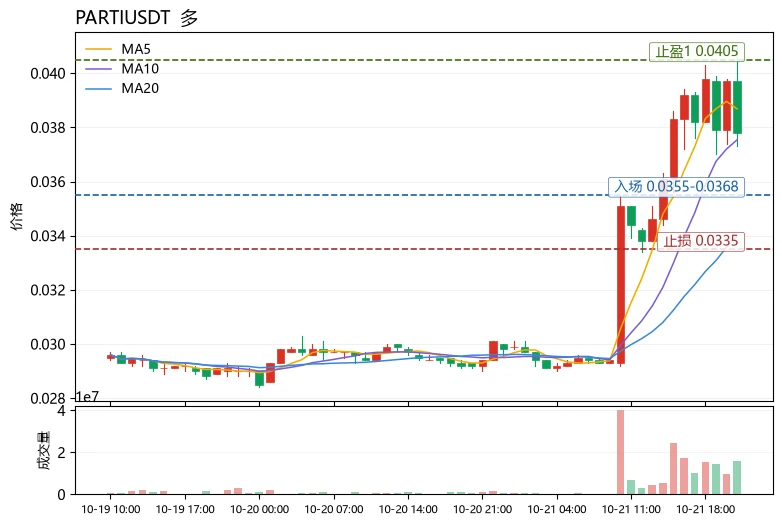
This trend is so obvious I don’t even need to think—the account is dancing on its own. While everyone was still watching from the sidelines, I already felt something was off. It had clearly moved sideways at the highs for so long, selling pressure kept building, yet trading volume kept shrinking. That wasn’t a good sign.

I saw it even more clearly as it formed a base intraday: insufficient support, with no one willing to buy on the way up. This kind of price-volume divergence couldn’t last long. So around 0.03576, I directly shared a short-selling idea, focusing on going with the trend.

No
post-image
SNDK+11.68%
ADA-5.45%
No vision, couldn’t hold on—the profits on this move were paper-thin, but I loved every bit of it. I opened the chart this morning and saw $ORDI grinding sideways all night without ever breaking below 3.960. Bottoming out without breaking down is a classic bullish signal, so I directly called for a long. Now it’s started moving at 3.988, with a +34.07% return. This bite of the trade feels great. It was truly sluggish at first, but once it broke out, it felt amazing. This bite of the trade feels great; staying up late wasn’t in vain. Time to treat myself to a good meal. Position management: Tak
post-image
ORDI-5.54%
LAB-0.53%
ETH-2.49%
This yield is making me nervous, and I’m worried the market will come to its senses tomorrow and blacklist me. 😂 When I checked the charts after lunch, $NIL made another push, but it clearly lacked follow-through, with shrinking volume and insufficient support. Every surge looked like a test. Seeing this setup, I knew it was a classic bull trap: the key resistance above was substantial, and there would be no one to take it higher. I told my friends right then, don’t chase it—wait until it runs out of steam; that’s our opportunity. Sure enough, it started falling in the afternoon and kept grin
post-image
NIL-1.88%
XRP-4.83%
LAB-0.53%
Why is everyone long $H /USDT while the 4h chart screams 95% short conviction?

$H /USDT - SHORT

Trade Plan:
Entry: 0.07975 – 0.08055
SL: 0.08400
TP1: 0.07726
TP2: 0.07534
TP3: 0.07246

Why this setup?
- Daily trend is bearish, and the 4h signal just armed a SHORT at 0.08015 with 95% confidence.
- RSI 15m at 44.53 shows zero momentum to the upside—weakness is the story.
- Targets are stacked: TP1 0.07726 (-3.6%), TP2 0.07534 (-6%), TP3 0.07246 (-9.6%).
- Invalidation sits at 0.08400, but the alt-long setup needs a break above 0.08304—that’s a trap door, not a ladder.
- Why now? Pri
H+2.23%
This is a support level for $CATE on a high timeframe. I don't think the price will spend much time here, as it showed strength during this pullback
post-image
CATE-12.69%
Load More

Join 40 M users in our growing community

⚡️ Join 40 M users in the crypto craze discussion

💬 Engage with your favorite top creators

👍 See what interests you

View More