



Share your thoughts
placeholder
Article
Four Assets, One Picture
The fastest way to understand the market is to read assets of different character in the same frame. The current picture is short and clear: BTC is trying to hold above 80K and is green on the week; ETH is negative on the day in the 2.5K zone; SOL is seeing a sharper daily drop around 108 dollars; GT is trading nearly flat in the 10 dollar zone.
What this table says is this: risk appetite is not dead, it is divided. Capital is not flowing fully into altcoins; the bulk is still waiting in Bitcoin. In periods like this, declines in altcoins are usually faster than BTC's,
post-image
xxx40xxx
$GT : What Makes an Exchange Token Different
GT stands in a different place from the other three: as an exchange's own token, its price depends not only on the general direction of the crypto market but also on the platform's own activity. In the latest picture GT sits just above the 10 dollar band with a nearly flat daily change; in other words, it looks relatively less affected by BTC's indecision.
The logic of this divergence is simple: demand for exchange tokens is interwoven with user numbers, trading volume and the token's functions inside the platform. When the broader market falls but an exchange's volume rises, that token's story gets written differently.
Still, this does not make GT a safe harbour. Exchange tokens are sensitive to liquidity shocks, regulatory headlines and sudden shifts in user behaviour. That is why the wolf does not look at price alone; it also looks at platform volume, user activity and the token's circulating supply.
A practical approach: GT can be considered a balancing element in a portfolio, but its size should never be set on belief alone. And tracking GT purely through a price chart is an incomplete reading; platform announcements, newly listed assets and activity on the user side directly shape demand for the token. BTC represents direction, ETH infrastructure, SOL speed, and GT the pulse of the platform. Read together, the market picture becomes far clearer: where is capital waiting, where is it flowing, and where is it getting stuck?
Risk Note: This content is not financial advice. It is for informational purposes only. Do your own research before making investment decisions.
$BTC $ETH $SOL
#GateSquareMidAutumnReunion
#BTCRetakes80K #WeekendMarketBullishOrBearish #ShareWeekly #WeeklyShare
repost-content-media
BTC-0.45%
ETH-0.93%
SOL-1.82%
GT+0.28%
  • 3
  • 1
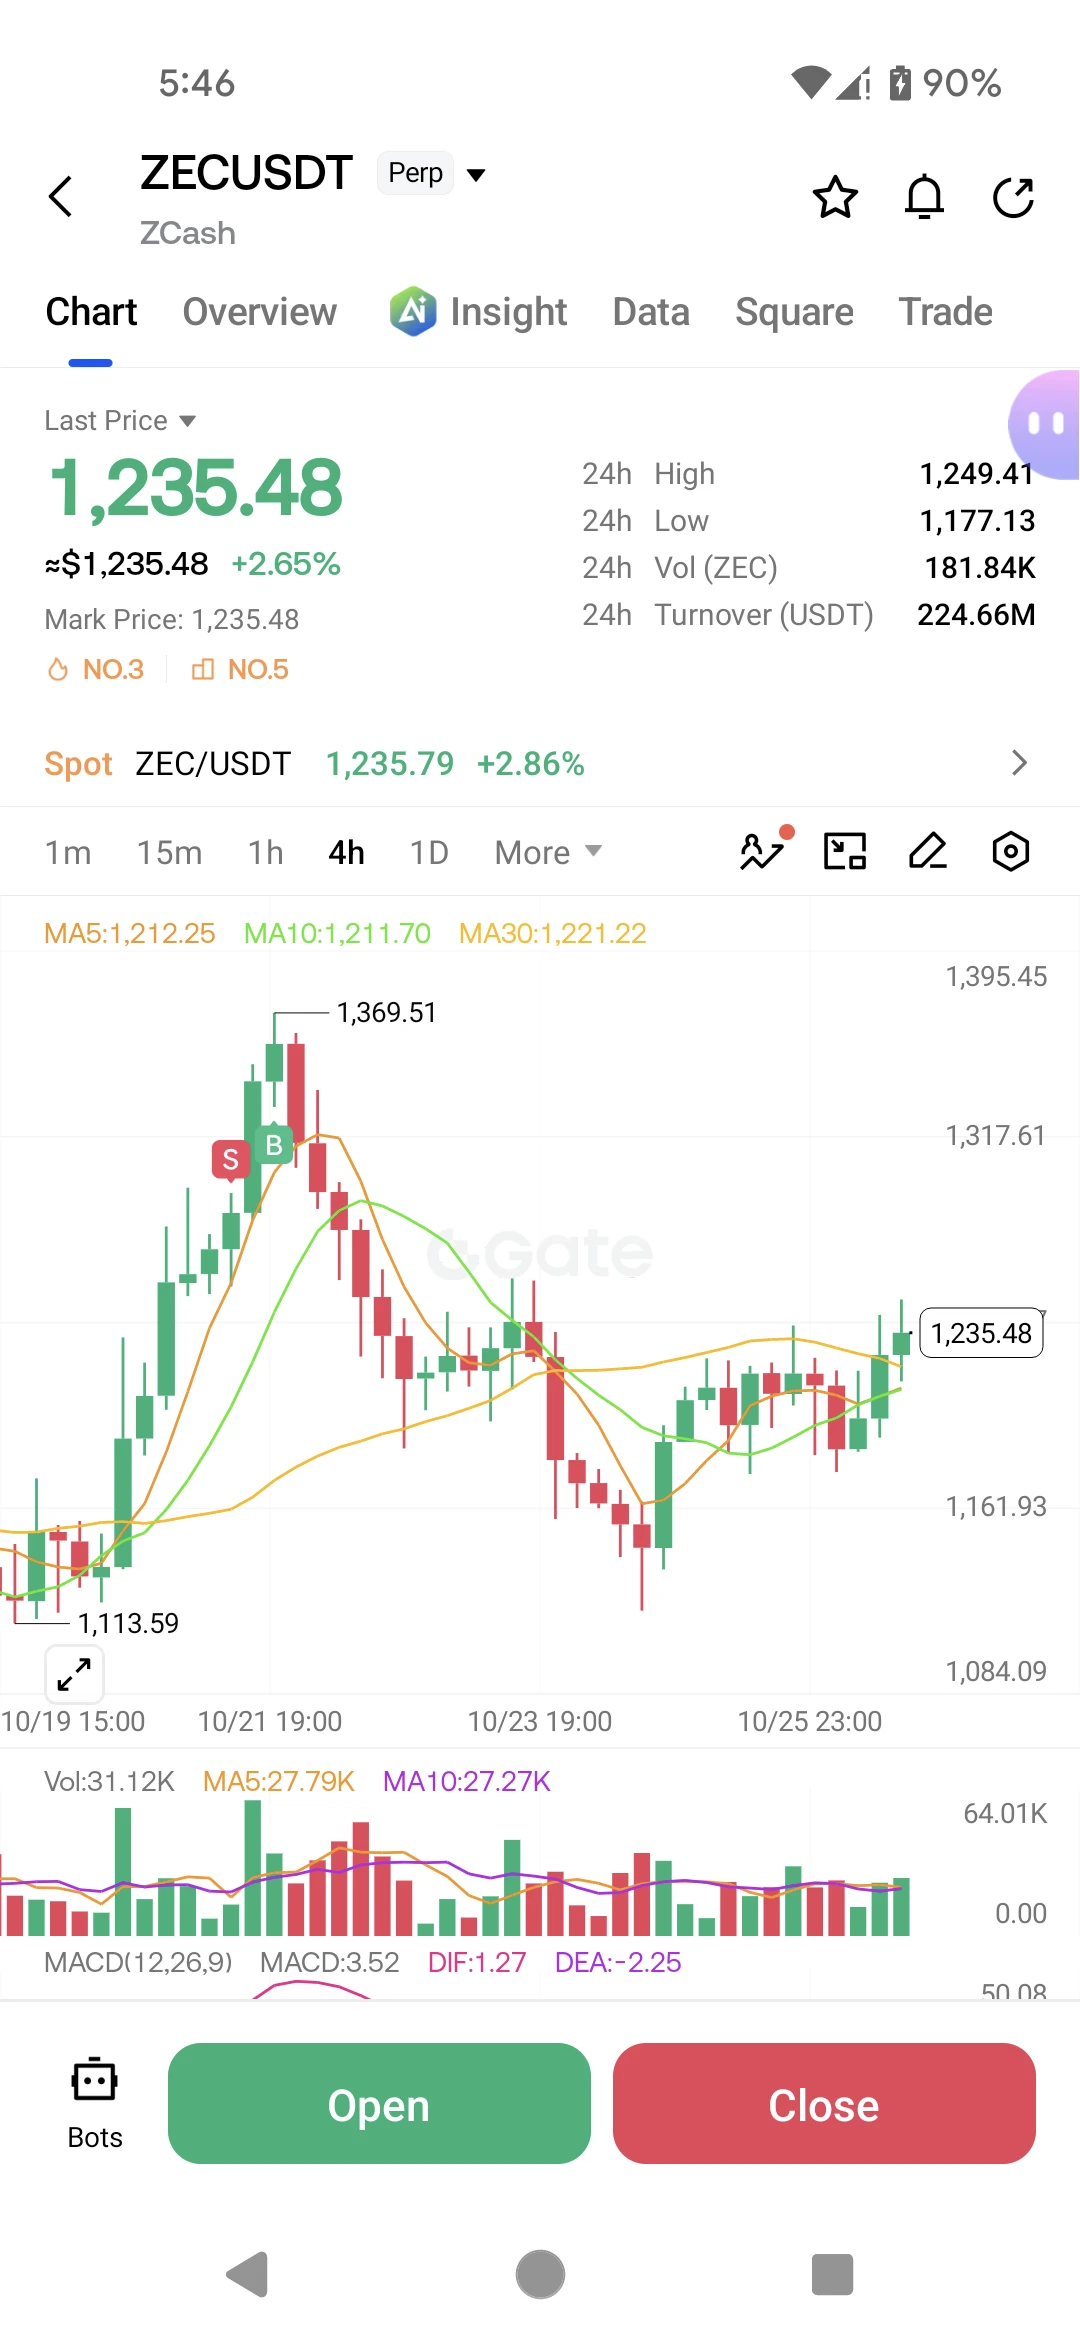
Insiders are calling ZEC the next 40% move hiding in plain sight.

$ZEC /USDT - LONG

Trade Plan:
Entry: 1438.77 – 1449.85
SL: 1391.10
TP1: 1484.22
TP2: 1510.83
TP3: 1550.74

Why this setup?
Why now? The daily trend is firmly bullish, setting the stage for a continuation. The 1h price is holding at 1444.63, just above a tight entry zone of 1438.77 to 1449.85, signaling accumulation. The 1h ATR of 22.17 confirms enough volatility to push toward the first target of 1484.22. A 15m RSI reading of 46.9 shows room to run before overbought, with the second target at 1510.83, while the invalidation
post-image
ZEC-2.14%
#BOJHikesTo1.25%31YearHigh
BOJ Hikes Rates to 1.25%: A 31-Year High
The Bank of Japan (BOJ) has taken another significant step in its monetary-policy journey by raising its policy rate to 1.25%, marking the highest level in approximately 31 years. The move represents an important shift for Japan, a country that spent decades dealing with extremely low interest rates, deflationary pressures, and unconventional monetary policies.
The decision highlights how dramatically Japan’s economic environment has changed. For many years, Japan was associated with near-zero or negative interest rates. Howe
$ETH Signal】1H bullish golden cross at the low + 4H EMA support, buy on the pullback
$ETH The 1H MACD has formed a bullish golden cross at the low, with the histogram turning positive at 0.1573. The current price of 2594.4 is holding above the 1H EMA20 at 2591.95, while the 4H EMA20 at 2567.20 provides support below. The order book buy/sell depth ratio is 0.23, with an imbalance of -63.14% and sell orders stacked above 2598. The last 1H candle had a buy_sell_ratio of 0.80 and volume of 32393, rising on reduced volume; buyers are actively pushing prices higher, but with limited strength.
🎯Dir
post-image
ETH-0.94%
Everyone is missing the obvious trap forming in $FIL /USDT right now.

$FIL /USDT - SHORT

Trade Plan:
Entry: 0.9202 – 0.9314
SL: 0.9792
TP1: 0.8858
TP2: 0.8591
TP3: 0.8190

Why this setup?
Why now? The daily trend is range, which means the asset is coiling for a directional break that usually favors the short side when momentum fades. The 1h ATR of 0.022245 shows volatility is expanding just enough to fuel a move but not yet enough to trap the overextended longs. A 15m RSI at 34.55 confirms momentum is leaning bearish without being oversold, leaving room for further downside. The entry zon
FIL-12.64%
🔥Free strategy levels for Sunday night👇
🔥Long entry levels (see the pinned subscription post for the second entry level, empty unit, and take-profit level; long- and short-term spot setups are also in the pinned post)
===========
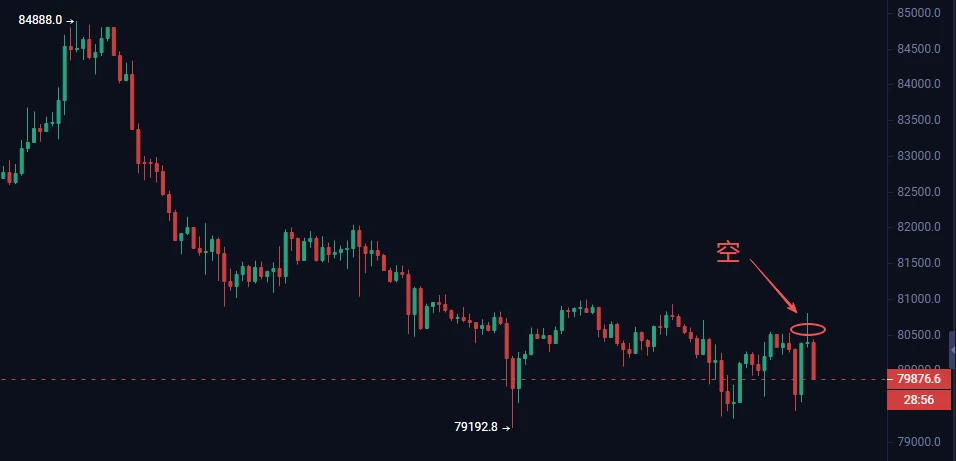
79300 long, 79000 long, Sun 77600
2535 long, 2515 long, stop loss 2465
#MSTR领涨纳指100
MSTR+16.35%
Watching the market nonstop gets annoying; turning it off actually made things clearer. When I stopped watching the market, I stopped panicking too.
During the intraday bottoming, $HUMA held its level while funds quietly entered. I only suggested testing with a small position, not chasing.
Later, it rallied from 0.02133 to 0.02235, +116.19%. I played this move just right—staying up late wasn’t for nothing, and the timing was spot-on.
For a coin you’re not confident in, taking a quick look keeps you clear-headed; buying a single lot is foolish. Staying out of the market isn’t a sin—opening pos
post-image
HUMA-6.25%
SNDK-0.11%
SOL-1.79%
If you longed hyperliquid:native and shorted aster-2:native a year ago you would be up >500% while paying $0 in funding.
Only thing that beats that is buying something like $100 strike HYPE call options a year ago.
Don't sleep on pear trading - ngl also talking to myself here.
post-image
HYPE+0.19%
ASTER-3.32%
BTC and ETH Approach Important Price Zones as Weekend Trading Momentum Continues
live-cover
LIVE404
I didn't make any judgment; I just held it a little longer and didn't expect it to actually reward me. When I opened the charts this morning, $AKE funds quietly entered the market and held after the pullback. I said to leave the long position alone for now and let it play out.
Floating PnL +11100.56%, entry price 0.0101698, current price 0.056355. We nailed the timing, so those already on board should be wide awake with smiles.
The prerequisite for compounding is staying alive; the shortcut to getting rich is often going to zero.
Have a strategy before the market opens, discipline during the
post-image
AKE+2.72%
SNDK-0.11%
XRP-2.04%
‼ The lowest price of the year, four gt half-price offer ends tonight; 90% win rate, over 600 subscribers🎉 have been profiting every day for nearly a month🀄️Today’s futures/spot updates are live👇
https://www.gate.com/zh/profile/Bitcoin King, come over
🔥Recently continuously profited 6,660,000 U‼️Accurately went long on the NFP at 75000/2375, now at 81900/2665, profiting again📈SanDisk went long at 1440, reached 1820, doubling the account by 800,000📈Second wave went long at 1535, then surged to 1800, doubling the account🀄️This time ZEC went long at 1035, reached 1590 in a massive surge, d
GT+0.28%
BTC-0.47%
  • 10
【$ONE Signal】1H pullback + negative funding rate short squeeze, buy the dip
$ONE 1H pulled back to 0.003634, funding rate -0.3503%, order book bid/ask depth ratio 1.81, depth imbalance 28.82%.
4H RSI 67.71, 1H RSI 49.94 neutral, 4H MACD bullish histogram contracting, 1H bearish histogram expanding, indicators in conflict.
1H Bollinger middle band at 0.0040 acting as resistance, lower band at 0.0034 providing support, 4H EMA20 at 0.0027 far below, open interest stable.
There are bids above the intraday low of 0.003541, shorts continue to pay funding, and the price remains resilient.
🎯Direction
post-image
When autumn arrives on the eighth day of the ninth month, my flowers bloom and all other flowers perish.
Their sky-reaching fragrance permeates Chang’an; the entire city is clad in golden armor.
After spending enough time in the market, you come to understand that true opportunities never come every day.
Most of the time, the market simply grinds out a bottom and swings back and forth. The more urgently you try to make moves, the more easily you exhaust yourself; going long is difficult, and going short is difficult, and one careless move can leave you repeatedly harvested by the market.
Like
post-image
BTC-0.47%
ETH-0.94%
SOL rises above $111! Spot ETF inflows exceed $28 million—is ins
live-cover
LIVE1,894
$AKE Air coins currently still have a market value of 35 billion. Even if they fall 99% more, there would still be 350 million. The downside is practically unlimited!
post-image
AKE-0.91%
AVAX surges 50% in four days and hits the trending list: I’m watching for a pullback here, not chasing
Wow, $AVAX itself has climbed onto CoinGecko’s trending list. I’m bullish at this level—up 50% in four days to 11.271, with 24h volume at 141 million USDT, 6.2 times the 30-day average.
My view: the bullish trend remains intact, but RSI at 79.2 is clearly overbought. I wouldn’t chase here; I’d buy the dip on a pullback.
Bullish rationale: first, the momentum isn’t over yet—MACD’s bullish crossover above the zero line is only one day old, and MA7 has crossed above MA30 on its first day; secon
AVAX+13.60%
#以太坊现货ETF单日净流入1.44亿美元 #Gate广场中秋团圆局 The Ethereum spot ETF saw a net inflow of $144 million in a single day, with BlackRock’s ETHA ranking first with a net inflow of $114 million. This released a positive institutional capital signal and provided clear support and a boost for Ethereum’s (ETH) subsequent performance, although short-term trends remain affected by the macro environment, market structure, and capital rotation. The specific impact analysis is as follows:
1. Short-term impact: Boosting market sentiment and supporting the coin price
Stronger buying pressure: The continued net inflows i
post-image
ETH-0.93%
The more divided the market is, the more people look for opportunities in Memes
#GateMemeCarnivalSeason
BTC is grinding back and forth above $80,000, ETH is doing its own thing, and the altcoin market has split into two camps. In this kind of market, those suffering most aren't the ones holding positions, but those sitting in cash waiting for direction. Those waiting for a pullback have missed the ride so far, those chasing highs are stuck halfway up the mountain, and only those watching narratives and capital flows are still looking for opportunities.
Here's the bottom line: the Meme sector i
MU+3.80%
Almost every piece of news this week has centered on Bitcoin, which has returned above $80,000.
CryptoPotato put it bluntly: if holders had been shown the headlines from the past few days a week ago, most would have expected a bloodbath. Rate hikes, geopolitical conflicts, and regulatory setbacks all hit at once, yet the price ultimately reclaimed the $80,000 level.
Despite the barrage of bearish news, the price has been unable to fall, suggesting that those planning to sell have already done most of their selling. The market does not explain why; it only leaves traces. Price action that can w
post-image
BTC-0.45%
Japanese stocks are attracting fresh attention as several key sectors show stronger momentum, with real estate, power and semiconductor-related names becoming important areas to watch.
The latest market activity shows that sector rotation remains a major theme in Japanese equities. Semiconductor and AI-related stocks have been particularly active, while power and other infrastructure-linked companies are also attracting market interest. Recent trading in Japan saw the Nikkei 225 rise 1.38% on September 18, with major semiconductor and AI-linked companies helping drive the move.
The semiconduct
JPN2250.00%
Load More

Join 40 M users in our growing community

⚡️ Join 40 M users in the crypto craze discussion

💬 Engage with your favorite top creators

👍 See what interests you

Trending Topics

MSTRTopsNasdaq100

74.15k Views3k Discussing

Strategy (MSTR) has gained about 48% over the past month, making it the best-performing stock in the Nasdaq 100, while Bitcoin rose roughly 12% over the same period. The company holds 845,050 BTC with a cumulative cost basis of about $63.73B. MSTR is not a pure Bitcoin proxy — its price swings can be more extreme. Can this rally last?

Gate Tops 24H Net Inflows Among Exchanges

26.47k Views3.69k Discussing

BTCRetakes80K

57.24k Views60.62k Discussing

View More