Square
Following
Hot
News
Notifications
Profile
Share your thoughts
placeholder
Article
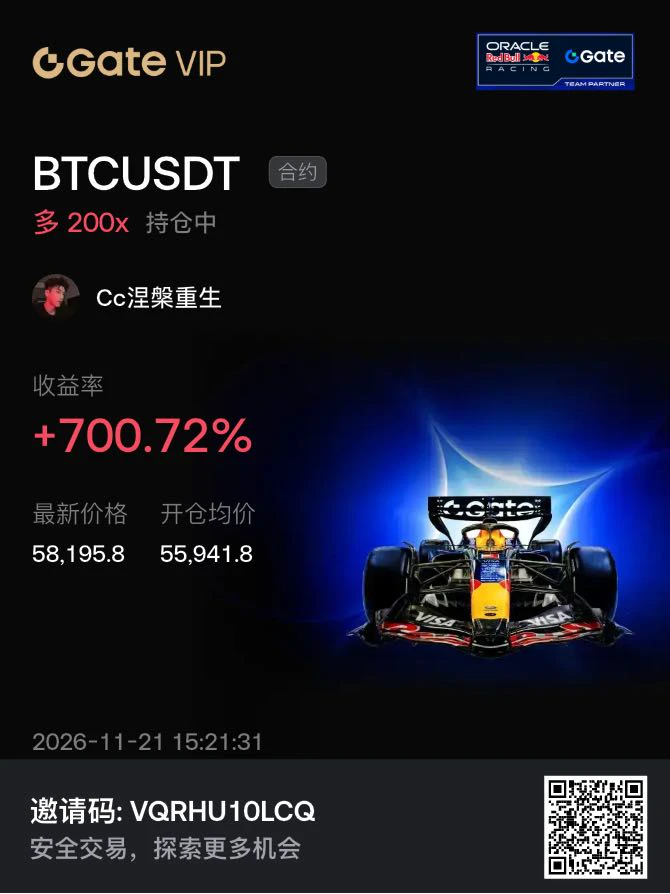
I’m awesome—my earlier call came through!
I shared this in the members’ group at 12 just now: it would bounce 5%.
Now look at BTC—didn’t it bounce 5%?
BTC is at 58k now. It didn’t let me down.
BTC-0.67%
Weekly Strategy Review

The rhythm throughout the week stayed in sync with the market, and every resistance zone identified for each trade was tested precisely by price action.

BTC: We laid out a short strategy from the highs. Each rebound stalled at the anticipated levels; after meeting resistance, price continued lower, repeatedly breaking through our preset targets. The expected bullish rebound never gained momentum. Once the weak structure was confirmed, shorting rallies in line with the trend provided ample room.

ETH followed the bearish trend throughout as well. Each rebound touched th
BTC-0.65%
ETH-1.23%
Trenches
FIONA
F
bade
b
FIONA
B34n...pump
Market Cap
$.
Change
.
24h Vol
$.
Holders
.
PIEVERSE
P
bade
b
PIEVERSE
0x0e...25a9
Market Cap
$.
Change
.
24h Vol
$.
Holders
.
mihao
m
bade
b
mihao
4Cxj...pump
Market Cap
$.
Change
.
24h Vol
$.
Holders
.
PROS
P
bade
b
PROS
0x8b...9832
Market Cap
$.
Change
.
24h Vol
$.
Holders
.
CLAUDIA
C
bade
b
CLAUDIA
2j5S...W2ZM
Market Cap
$.
Change
.
24h Vol
$.
Holders
.
[ NEW STREAMER ] MARKET UPDATE
live-cover
LIVE2,002
BTC-0.67%
Reduce the position and hold long term, treating it as spot
post-image
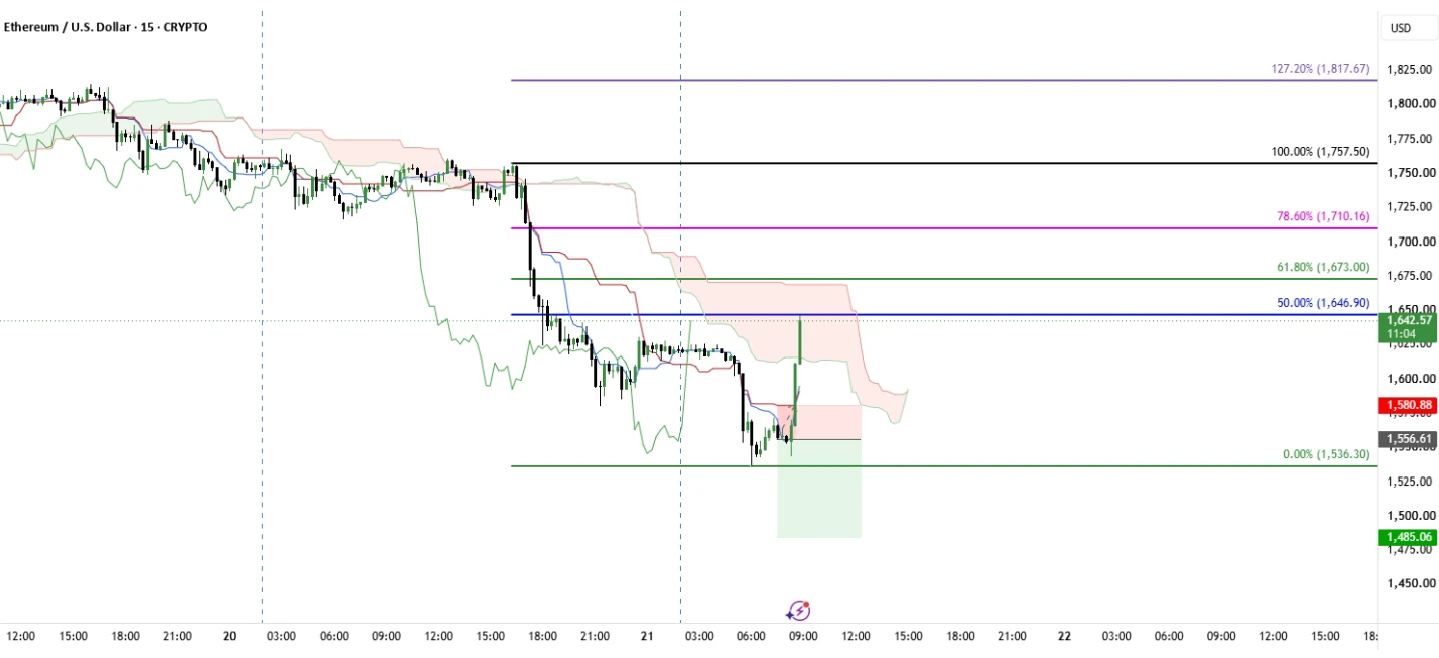
ETHUSD | Bullish Counter-Trade Setup

ETH is attempting a short-term recovery after an extended bearish move. Following the previous stop-loss hit, price has produced a sharp bullish impulse on the 15-minute chart. However, the overall market structure remains bearish, making this a counter-trend trade rather than a confirmed reversal.

Market Structure

ETH previously declined from the $1,800–$1,825 region toward the $1,536.30 low before buyers stepped in and triggered a sharp rebound. The latest bullish candle pushed price toward $1,642.57, approaching the 50% Fibonacci retracement level at
post-image
ETH-1.26%
Even a nuclear bomb can't break 50,000.
post-image
Kongming - Spot Position · Bullish Signal
$ETH $BTC $SOL

I reviewed the cycle patterns over the next twelve years, and the current price is right at a key support zone. This is a major bottoming opportunity that comes once every four years—miss it, and you’ll have to wait another four years!!
90-day trading P&L +1,626.6+47.55%BTC-5.58%ETH-6.14%SOL-6.25%
Risk warning: The above reflects only my personal market views and does not constitute investment advice. The crypto market is highly volatile, so please be sure to manage your positions and control risk.
post-image
ETH-1.26%
BTC-0.67%
$BCH It repeatedly faced resistance below the moving averages, with selling pressure continuing to weigh on it. The rebound could never hold above key moving averages, so I entered a short in line with the trend. I captured a 341% gain during this leg down, banking $253
.
Today, I'm also keeping a close eye on and ZEC.
$BCH It rallied to the resistance zone but couldn't push higher, so I opened a short. Entry range: 190.55 - 193.68 First target: 183.80 Second target: 177.1 Stop-loss: 199.49
$BCH This sell-off is moving faster than everyone's enthusiasm for going to work on Monday. The trend
post-image
DODOX
DODOXDODOX
Pump.Fun
MC:$2.22KHolders:87
32.76%
BCH+1.05%
btc market updates
live-cover
LIVE2,605
SOL-0.77%
BTC-0.67%
ETH-1.26%
USDC+0.01%
XRP-1.15%
$AKE The risk-off period is over. I’ve closed out everything. Bye
post-image
AKE+6.07%
I've had many dreams,
but this is the only one that will come true🙈
post-image
The bull is here, we're saved!
“Ah Q’s Spiritual Victory Method”
post-image
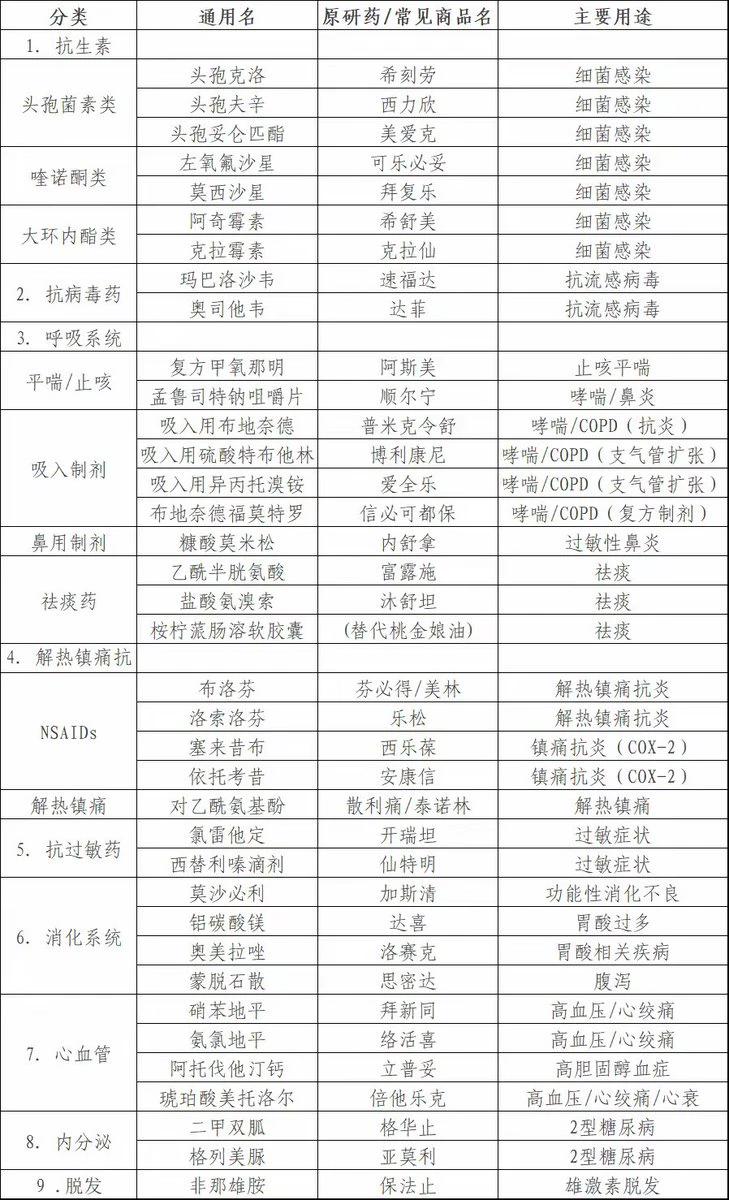
List of Originator Drugs and Their Primary Uses
post-image
It doesn't do much damage, but it's incredibly insulting🤣
post-image
Nvidia$NVDA flash-crashes 14%! Did blowout earnings become a death knell?

Once all the good news is priced in, it becomes bad news. Even the top AI player fears scrutiny.

The one-hour chart has broken below all key levels, with severe short-term oversold conditions. The outflows are even more painful: 229 million flowed out in one day and 785 million in seven days. Selling just won't stop.

Despite earnings beating expectations, rumors of an SEC investigation and news of Jensen Huang's resignation sent the stock crashing—a classic emotional sell-off.

Mr. Zhang's view: There could be a reco
NVDA-0.35%
  • 2
  • 1
“Why sell at this price?”
“I still have 5.”
post-image
An article I wrote in May. At its peak, my position was close to $50 million, but unfortunately, I no longer hold it. One wrong step led to another; I experienced both FOMO and FUD in a single round trip, even though I should have strictly avoided them. Druckenmiller said it’s really important not to hold a position when you don’t understand it.
Let's apply for Cookie's social farming 🤣
I remember getting one VOOI from farming Cookie last year; after that, it was basically all garbage
After the farming ended, those who staked were probably the worst off. $cookie 's
link;
post-image
COOKIE-2.21%
VOOI+2.96%
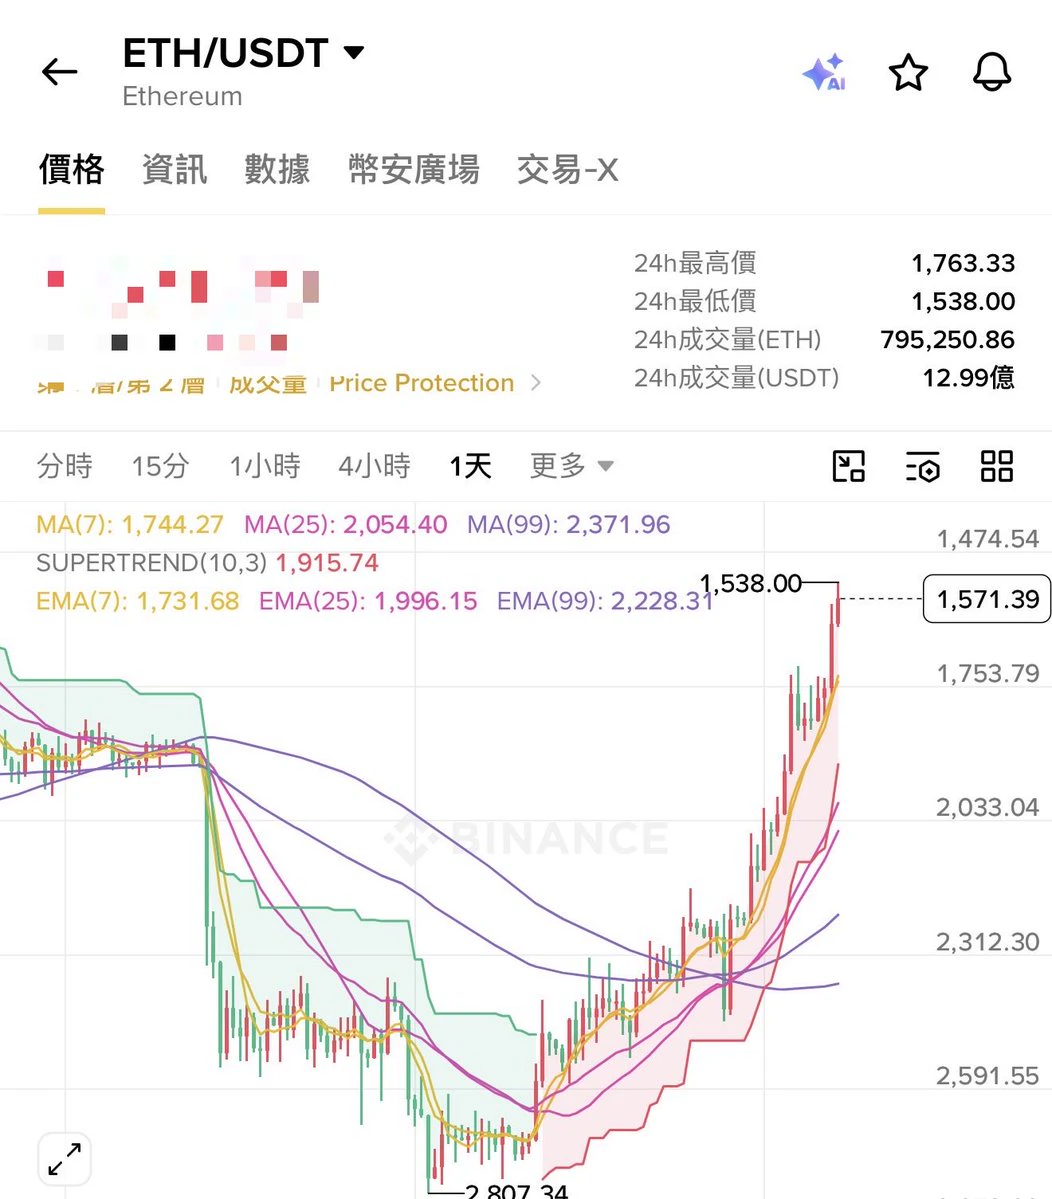
$ETH This downturn wasn’t driven by retail investors selling off.

On November 19, BTC spot funds saw $582 million in outflows in a single day. The largest one alone saw $541 million flow out—the biggest daily outflow since its launch. Ethereum funds saw cumulative outflows of $970 million in November.

Looking further upstream, US producer prices rose 6.5% year over year in October, the highest in more than four years, and expectations for a December rate hike have risen again.

US Treasuries yield 5%, while staking Ethereum yields just 2.5%. Institutions sell non-yielding assets first—it’s s
post-image
ETH-1.23%
BTC-0.65%
AKE+6.39%
  • 1
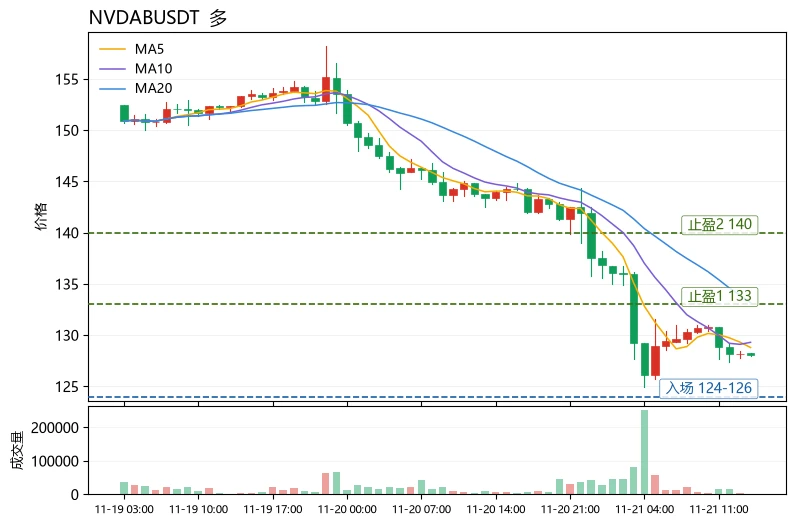
$NVDAB Current price: 128.1. Short-term resistance above is at MA5 128.8 and MA20 133.16, while the lower Bollinger Band at 122.25 is the last line of daily-chart support. Down 10.84% over 24h, with a trading volume of 106.6M, and the Fear & Greed Index at just 12 (extreme fear), the price is hugging the lower Bollinger Band. RSI at 25.9 has entered oversold territory, but the MACD histogram has turned positive at +0.099, indicating that bearish momentum is fading and bulls are beginning to cautiously buy.
From a flow perspective, this downturn looks more like passive position reductions by l
post-image
NVDAB
NVDABNVDAB
Pump.Fun
MC:$3.5KHolders:1
4.36%
RARE-0.89%
Load More

Join 40 M users in our growing community

⚡️ Join 40 M users in the crypto craze discussion

💬 Engage with your favorite top creators

👍 See what interests you

Trending Topics

BTCBreaksBelow60K

2.1M Views29.1K Discussing

BTC fell below $60,000 on November 20 for the first time since July, alongside a tech stock selloff and broader pressure on risk assets. Will $60K become resistance, or can BTC quickly reclaim it? What price or volume signals would convince you that selling pressure is easing?

GateDirectIPOPhase3ANTAllocates92100Shares

739.5K Views4.8K Discussing

NvidiaDropsNearly14Percent

310.5K Views7.5K Discussing

View More