Square
Following
Hot
News
Notifications
Profile
Share your thoughts
placeholder
Article
Believe in something
$BTC
post-image
BTC-0.67%
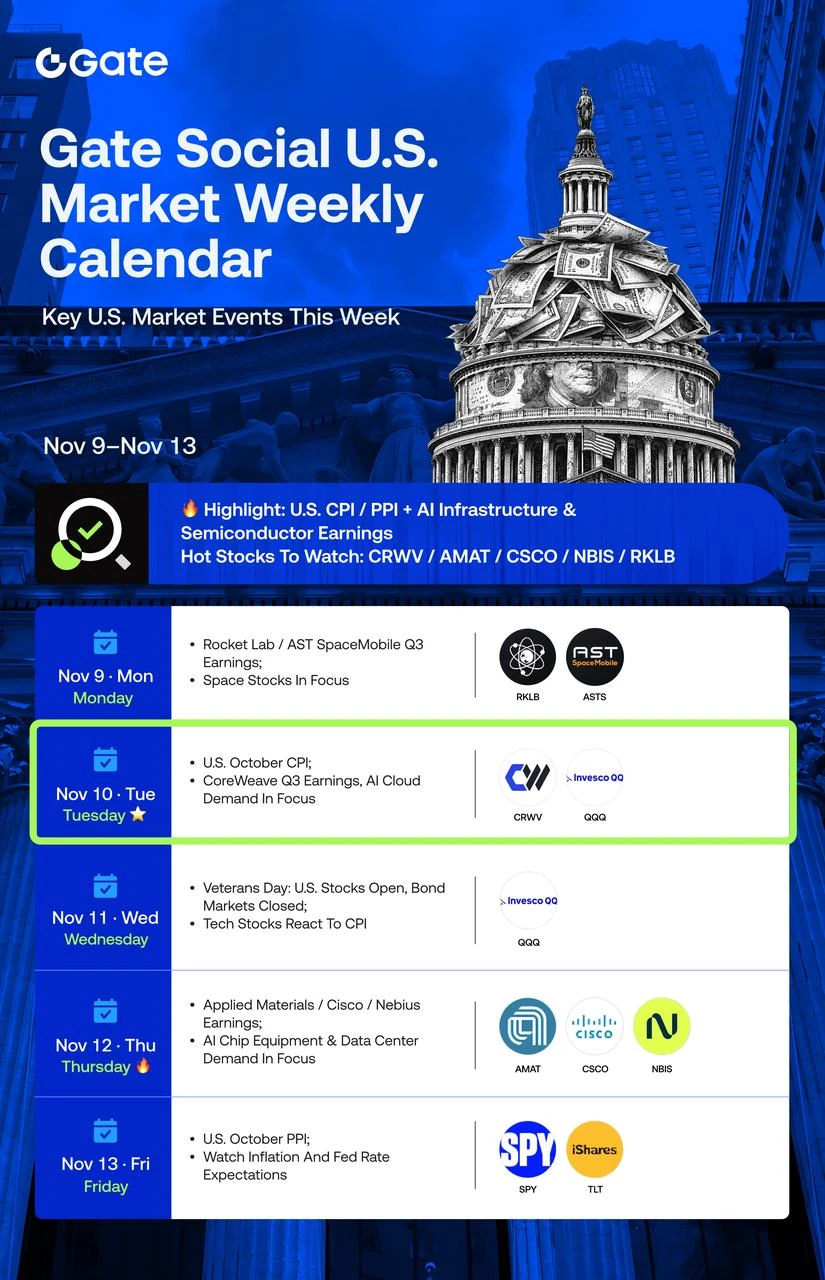
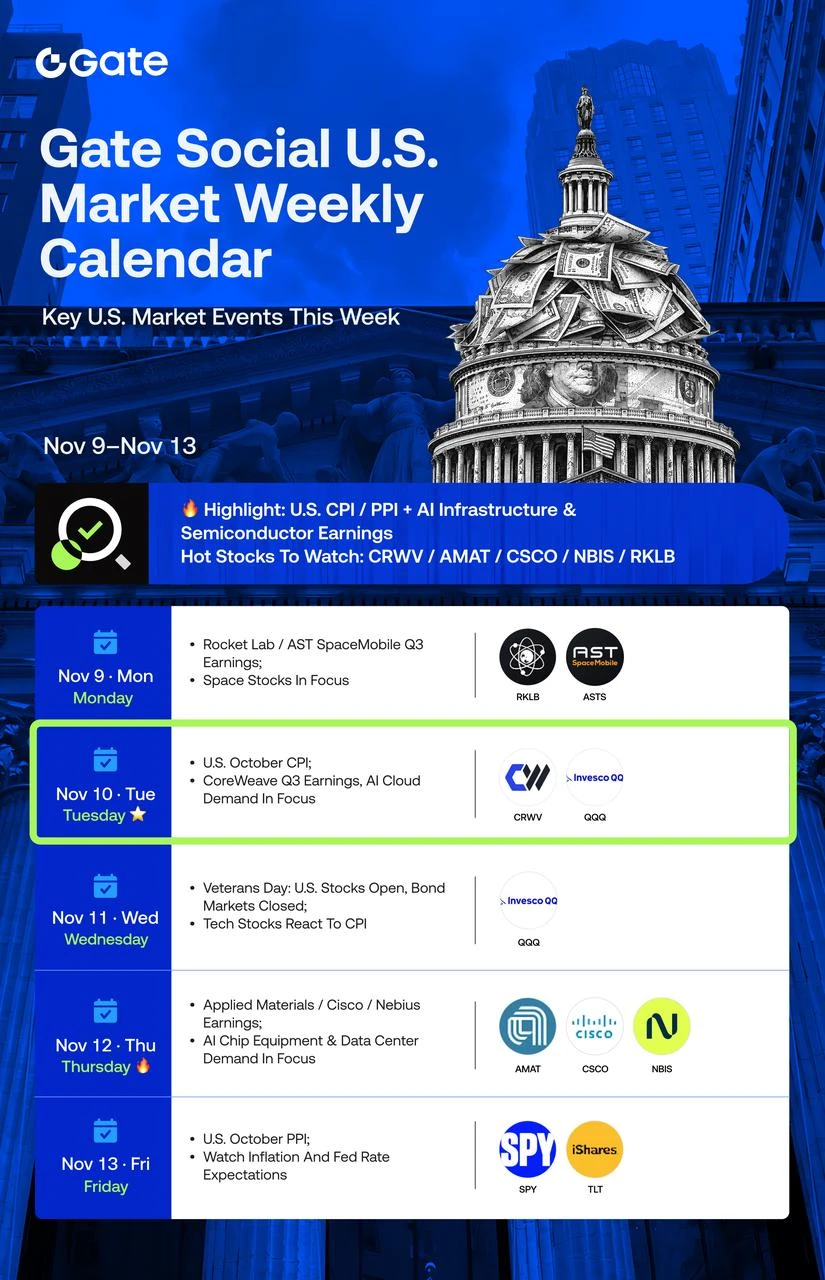
📈 Another busy week in the U.S. market 👀
CPI / PPI + AI & chip earnings
Will inflation data shake up rate-cut expectations?
And can earnings from CoreWeave, Applied Materials, and Nebius keep the AI hype alive?
🍿 What are you watching more closely: inflation data or AI earnings?
Drop your pick. Little G will bring your questions to the hosts 🔴
Save the calendar. See you in the front row.
https://www.gate.com/live
‍#GateLive #USStocks #CPI #AI

post-image
GateLive
📈 Another busy week in the U.S. market 👀
CPI / PPI + AI & chip earnings
Will inflation data shake up rate-cut expectations?
And can earnings from CoreWeave, Applied Materials, and Nebius keep the AI hype alive?
🍿 What are you watching more closely: inflation data or AI earnings?
Drop your pick. Little G will bring your questions to the hosts 🔴
Save the calendar. See you in the front row.
https://www.gate.com/live
‍#GateLive #USStocks #CPI #AI
repost-content-media
CRWV+5.69%
AMAT+11.39%
Trenches
牛逼
牛
bade
b
牛逼
0x96...7777
Market Cap
$.
Change
.
24h Vol
$.
Holders
.
STONK
S
bade
b
STONK
6GmA...UNgx
Market Cap
$.
Change
.
24h Vol
$.
Holders
.
BTC
B
bade
b
BTC
C5xp...pump
Market Cap
$.
Change
.
24h Vol
$.
Holders
.
PIEVERSE
P
bade
b
PIEVERSE
0x0e...25a9
Market Cap
$.
Change
.
24h Vol
$.
Holders
.
ON
O
bade
b
ON
0x0e...1d48
Market Cap
$.
Change
.
24h Vol
$.
Holders
.
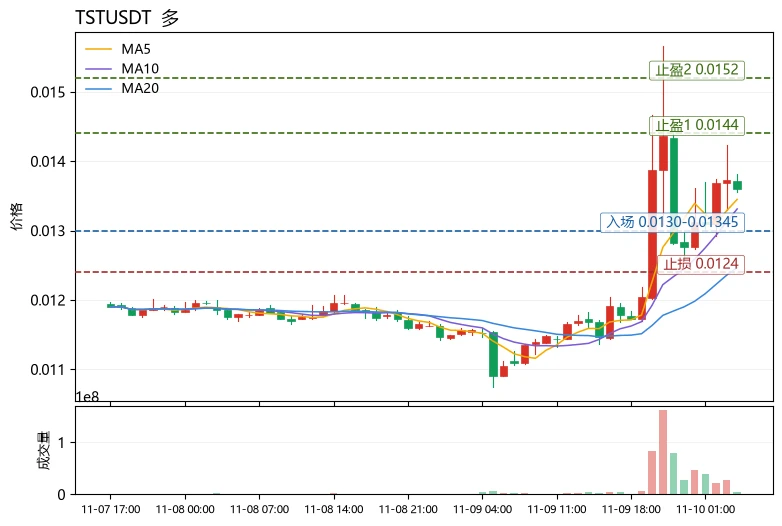
$TST Current price: 0.0136. Key short-term levels: 0.0144 above (upper Bollinger Band), 0.01345 below (MA5), and 0.01247 (MA20). The price is above both moving averages and the MACD histogram is positive, but the RSI at 63.5 is nearing overbought territory. The range across 30 candles is about 36%, and volatility is high, making the risk-reward ratio for chasing a long position unattractive right now. The funding rate of -0.6339% means shorts are paying, suggesting potential short-squeeze momentum, but the Fear and Greed Index is only 29, indicating cautious market sentiment. Avoid placing a h
post-image
TST
TSTTestToken
Pump.Fun
MC:$2.41KHolders:2
26.08%
LINK-0.18%
$SOXL This plunge clearly hasn't bottomed yet.
Some are crying so hard they could be memes, while others stare blankly at the +18.53% gain—the market is this divided. Don't rush to buy the dip or sell at a loss; first check the volume and buying support. Risk warning: The above is only a personal review record and does not constitute investment advice. Contract trading carries extremely high risks, so please participate with caution.
post-image
SOXL-1.16%
nobody has to know that am a millionaire
my money my business 😤😤
ily @solflare 💛🖤
post-image
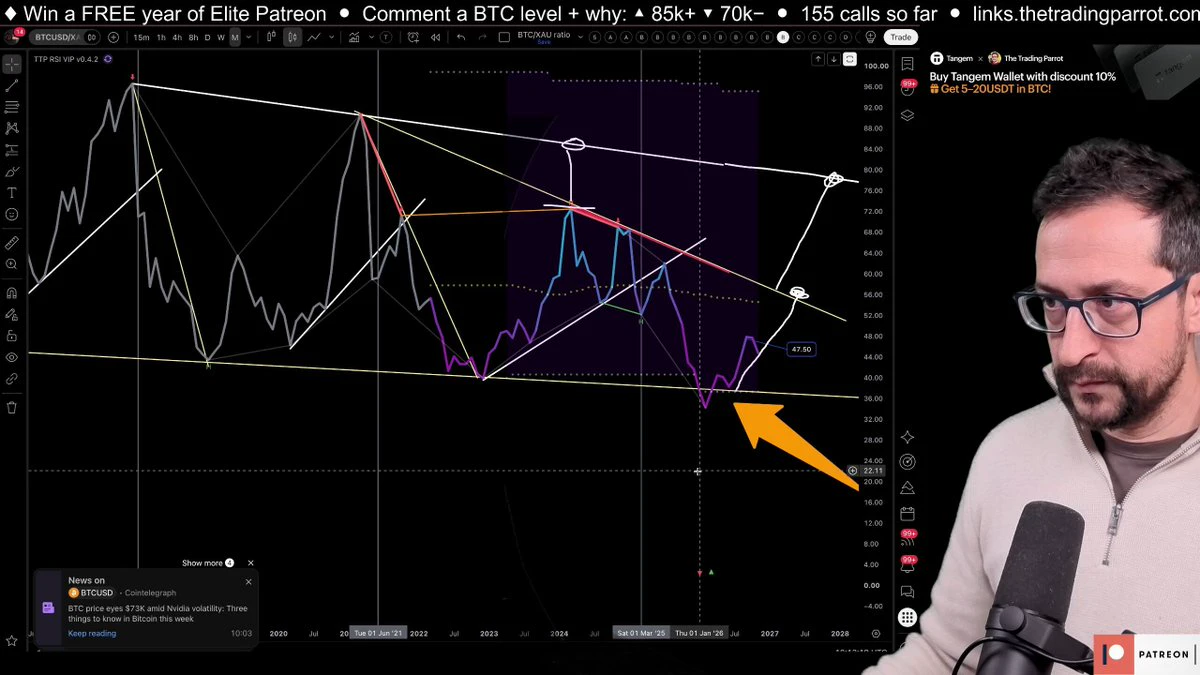
Bitcoin is being squashed by gold. Not just diminishing returns — an acceleration into diminishing returns. The trend line points at 55 RSI and we're only at 48. This changes the entire bull market thesis. See it at 1:23:41.
#Bitcoin #Gold #BTC #Crypto #Trading
post-image
BTC-0.67%
RITUAL Launches CandyDrop, Offering 5,000,000 RITUAL

https://www.gate.com/share/act/3fac150d
post-image
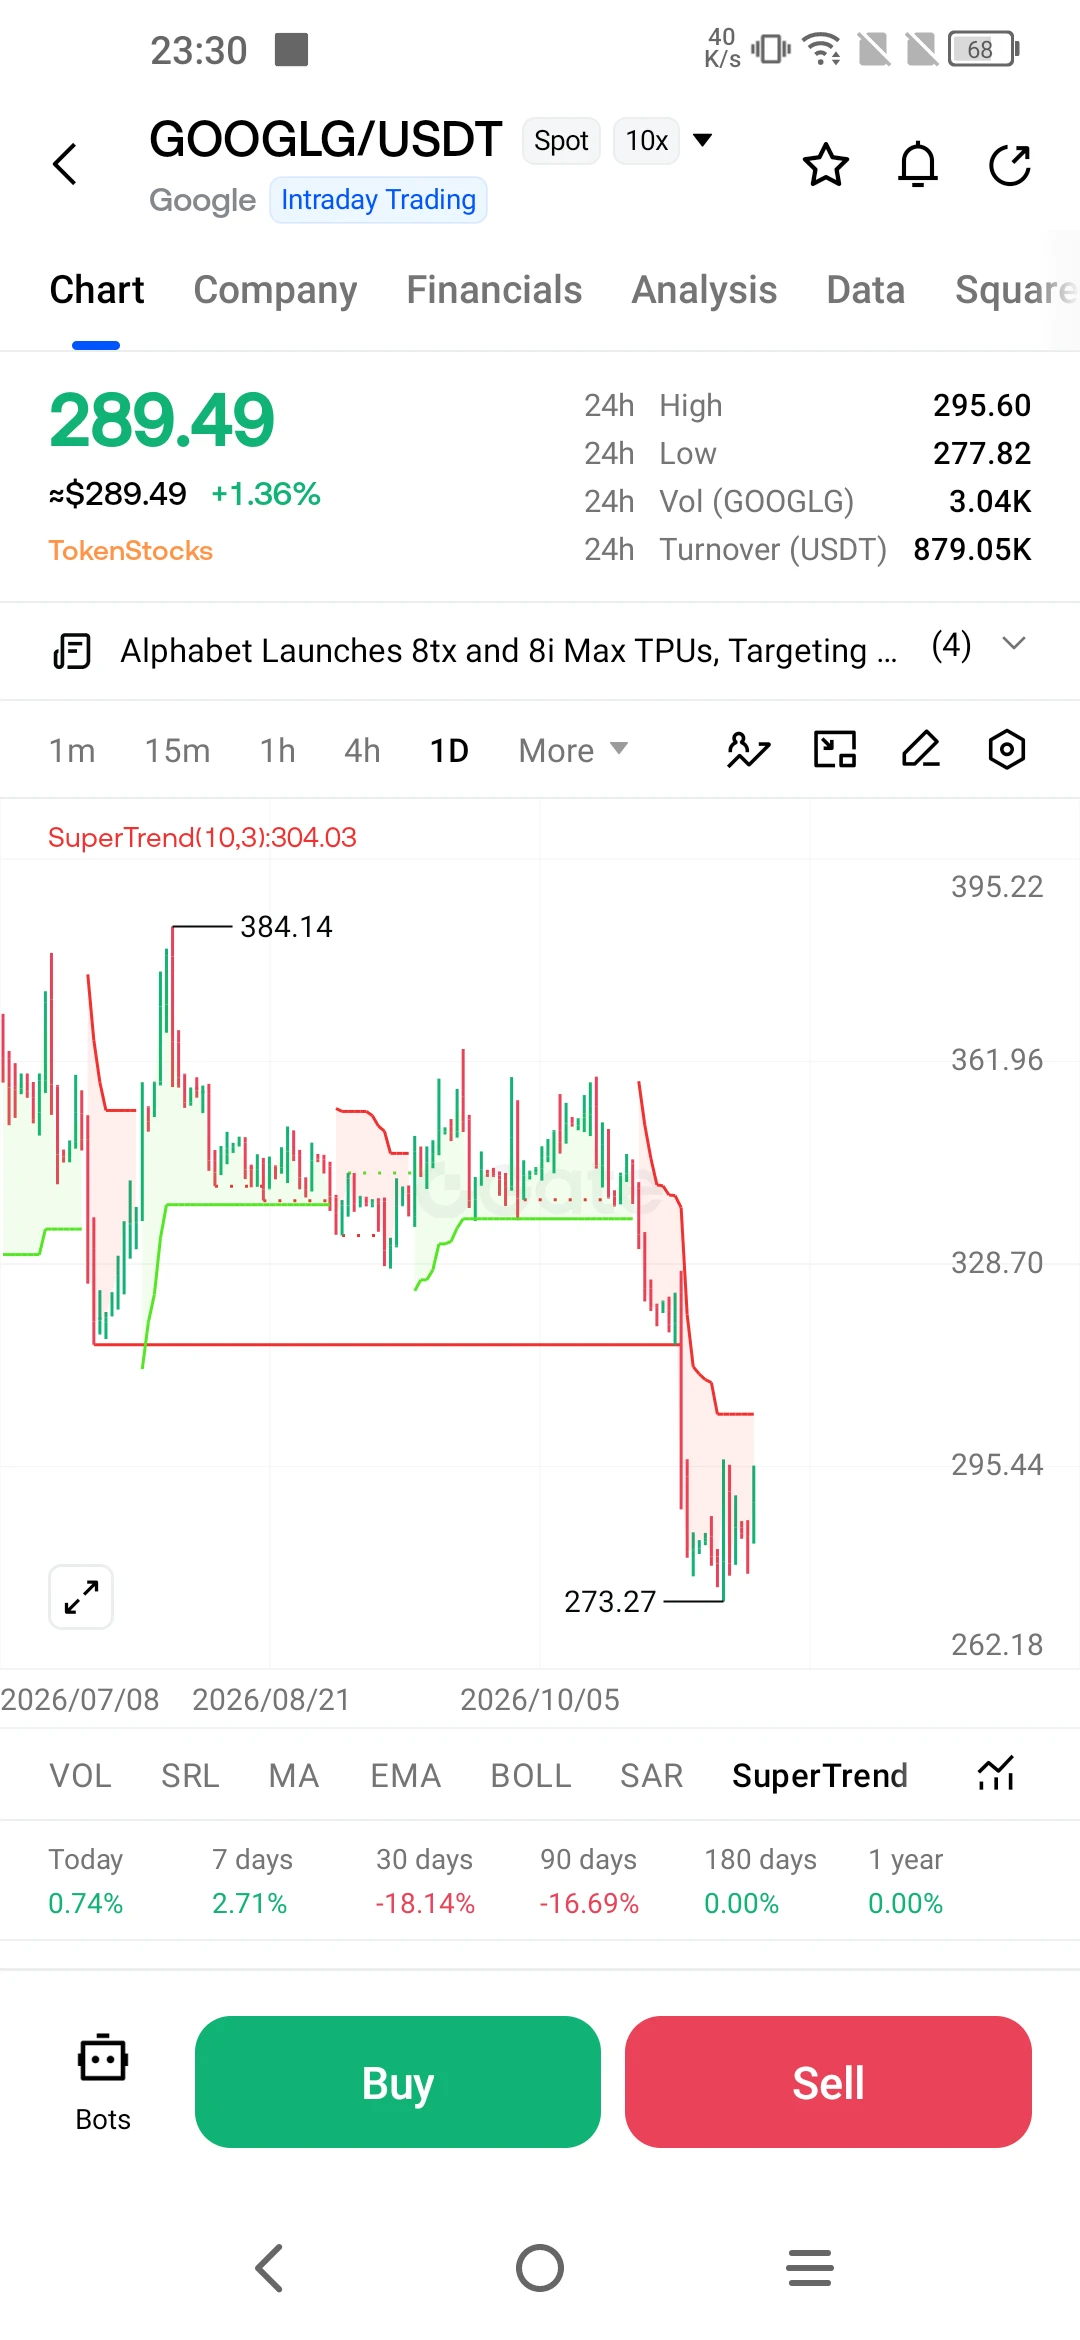
Sometimes, the market presents such peculiar moments—a stock hits rock bottom just as the company unveils a breakthrough in new technology. This is precisely what happened with GOOGL/USDT. The chart shows a sharp decline from $384 to $273, followed by an attempt at recovery. At first glance, one might attribute this drop to the new artificial intelligence chips introduced on November 9. In reality, however, the situation is more nuanced; the decline wasn’t caused by the chips themselves, but rather by Google paying the price for its own success.

The catalyst for the collapse was the earnings
post-image
GOOGLG+0.09%
GOOGL+0.11%
GOOGL+1.21%
GOOGL+1.74%
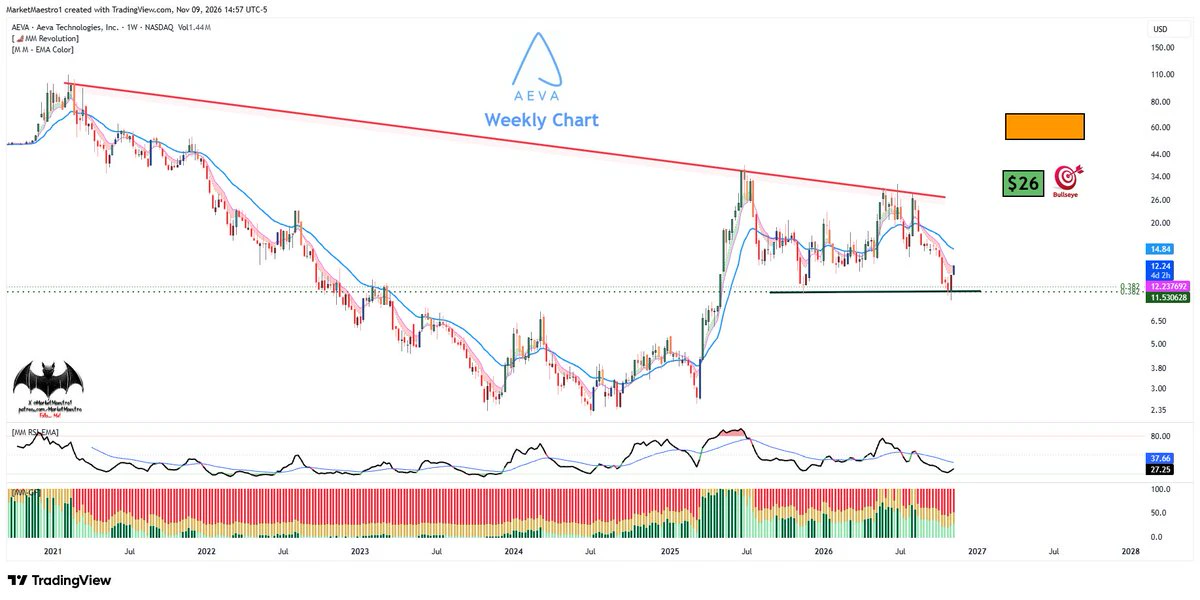
$AEVA
It could make another run at the red diagonal resistance line
post-image
AEVA+11.93%
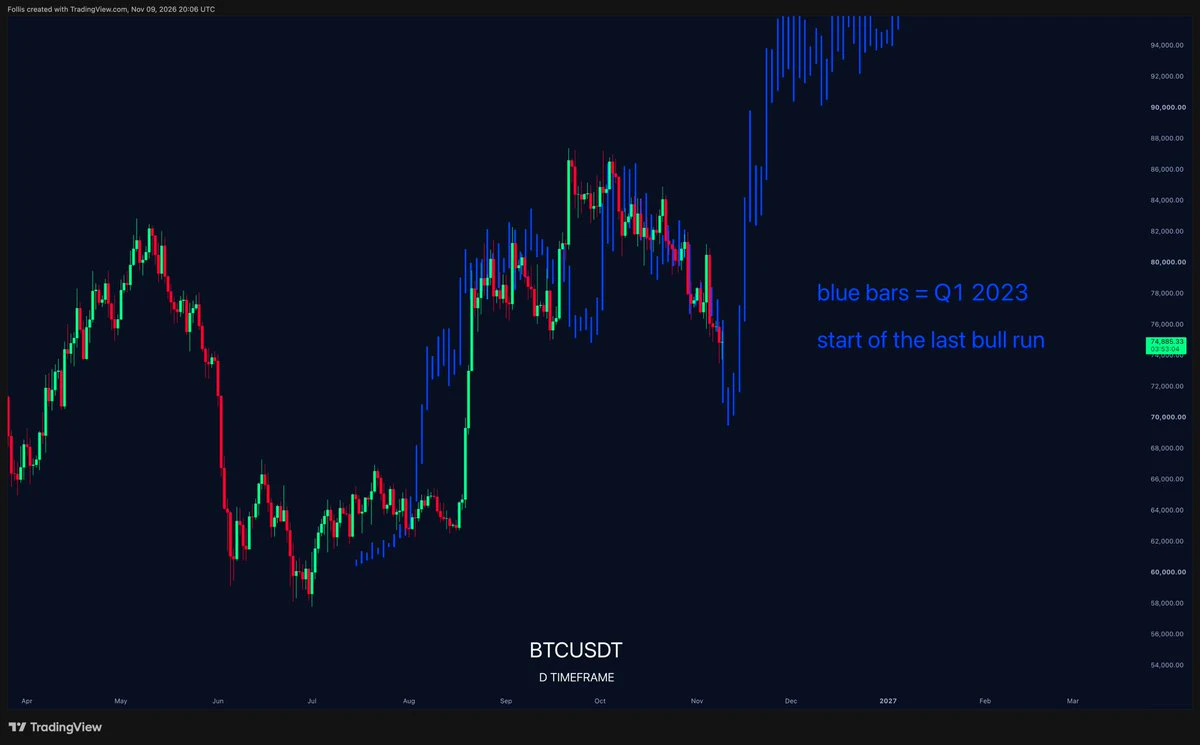
What stands out most about this market move isn't the strength of the rebound, but the waves of dip-buying bulls getting pinned halfway up the mountain. People rushed in to buy BTC at 82000, 79000, and 76000, but the price didn't care at all—their positions were left underwater first. ETH is following the same script: dip-buying longs are lining up to enter, and most are now stuck sitting on unrealized losses.
Judging by market sentiment, it's quite difficult for prices to make a smooth recovery in the short term and bail out the trapped longs. My personal view leans toward the underlying logi
post-image
BTC-0.67%
ETH-1.26%
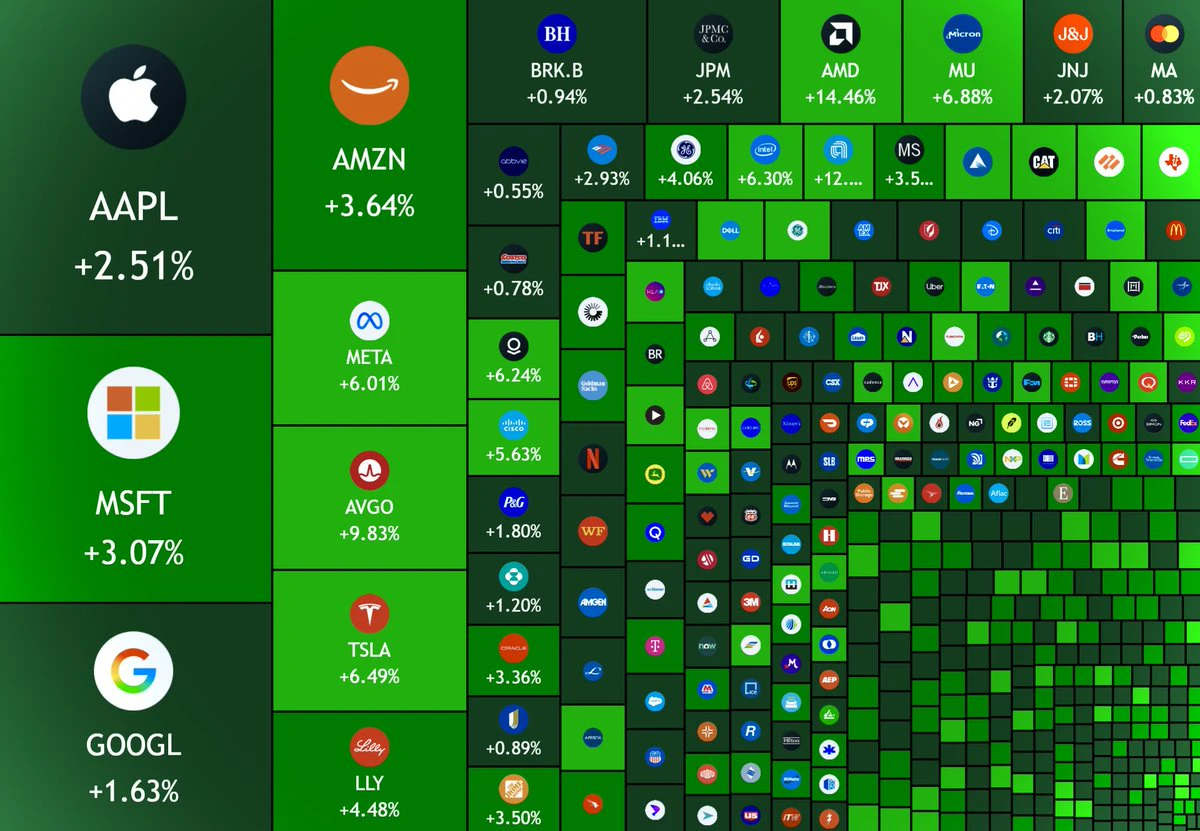
JUST IN: 🇺🇸 $2 trillion added to the US stock market today.
post-image
MARKET UPDATE
live-cover
LIVE65
Crypto Market update
live-cover
LIVE581
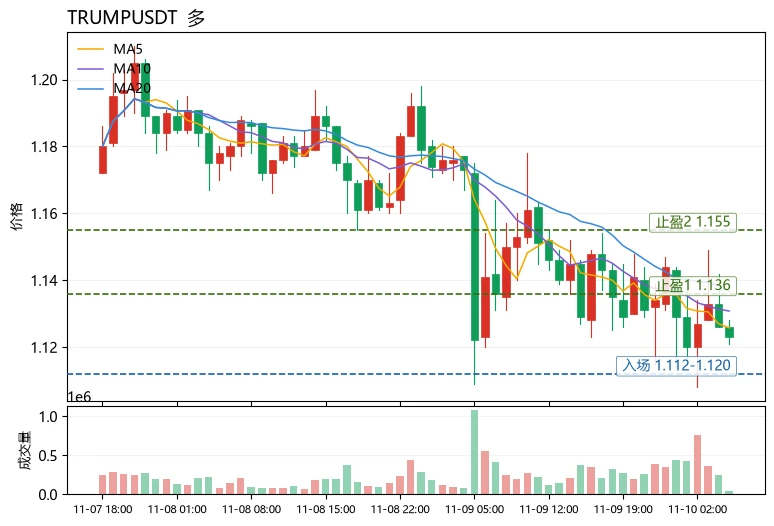
$TRUMP Short-term outlook is bullish, with the funding rate as the key signal. The current price is 1.123, down 3.94% over 24h, while the funding rate is -0.0253%. Shorts are continuously paying to hold their positions, indicating that the decline is driven by both long position reductions and shorts chasing the move, rather than being led by new short positions. The price is above the Bollinger lower band at 1.116. Although MA5 at 1.1258 is below MA20 at 1.1368, the MACD histogram has turned positive, RSI at 41.8 is approaching oversold territory, and the Fear and Greed Index is at 29, in fe
post-image
TRUMP-0.95%
XPL-0.60%
UNI+3.05%
Looking at the Zcash chart, we are witnessing a cooling-off period following the strong rally seen since the beginning of 2026. The price has pulled back from its peak of $1,695 and settled into the $1,170 range. The SuperTrend indicator is flashing red at the $1,464 level, signaling a downward trend in the short term.

This is not a collapse that warrants panic, nor is it a situation to be ignored as if everything is perfectly fine. The market is currently seeking a balance—weighing the strong narrative that has persisted since the start of the year against short-term profit-taking and a loss
ZEC+1.29%
Hopefully it stops acting up... emmm, the longs already had a rough enough time last week.
Let's just call a truce...
$ONE Get to work, there's no time, friend. Finish up and run😎✋.$TAG
$JCT
post-image
ONE-1.19%
TAG-8.18%
JCT-3.26%
$BTC US stocks have all rebounded; buy the dip on all altcoins
BTC-0.67%
bitcoin:native
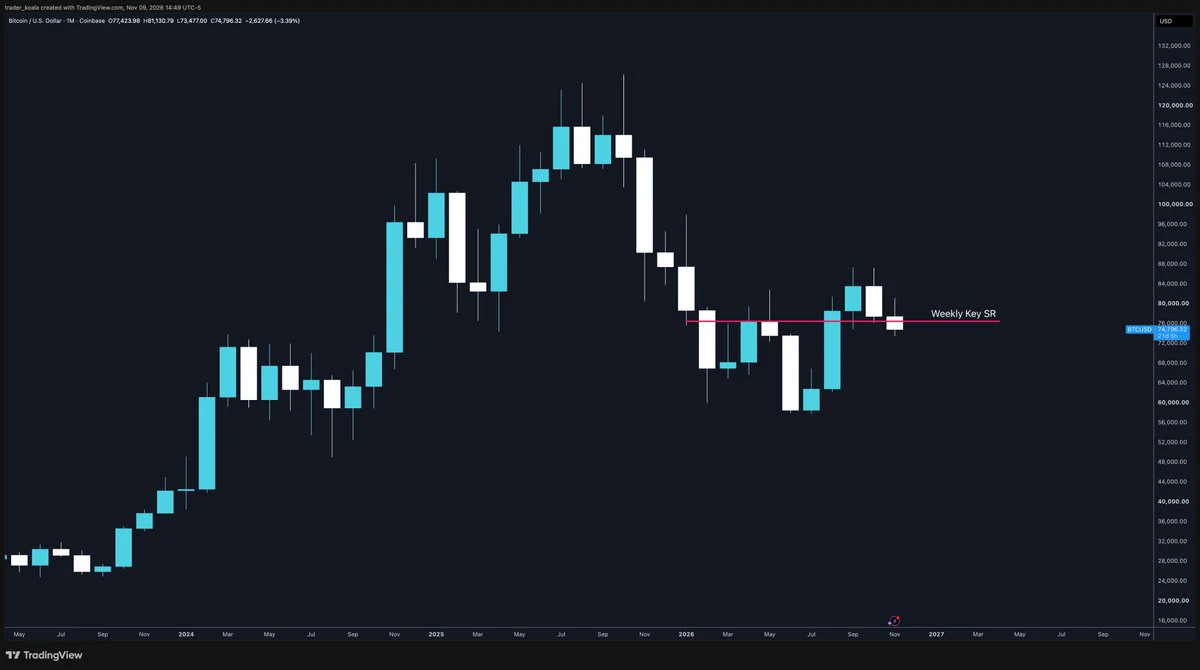
Poor weekly close and there is no real upside momentum.
Does it change the HTF picture?
Not even a little bit.
The 40k callers are coming out of the woodwork because apparently they've never seen something called a line-chart.
Right now, I think the market is simply digesting the news across the board.
A monthly close below $73.5k, and we can start talking about new lows.
Until then, nothing has changed with the bull market.
I expect these prices, or somewhere around them, to form the monthly wick before the Santa Rally.
post-image
BTC-0.67%
Load More

Join 40 M users in our growing community

⚡️ Join 40 M users in the crypto craze discussion

💬 Engage with your favorite top creators

👍 See what interests you

Trending Topics

USCPIDataIncoming

44.29k Views2.03k Discussing

The U.S. October CPI report will be released on November 10 at 8:30 a.m. ET. September CPI came in at 3.7% year over year, and markets will be watching closely for signs that inflation is cooling, especially in core CPI. A softer-than-expected reading could strengthen rate-cut expectations, while hotter inflation may pressure risk assets through higher Treasury yields and a stronger dollar. How do you think this CPI print will move $BTC, U.S. stocks and gold?

RedBullDoublePodiumInBrazil

9.98k Views30.59k Discussing

BTCFlashCrash

220.49k Views66.6k Discussing

View More