
Square
Following
Hot
News
Profile
Share your thoughts
placeholder
Article
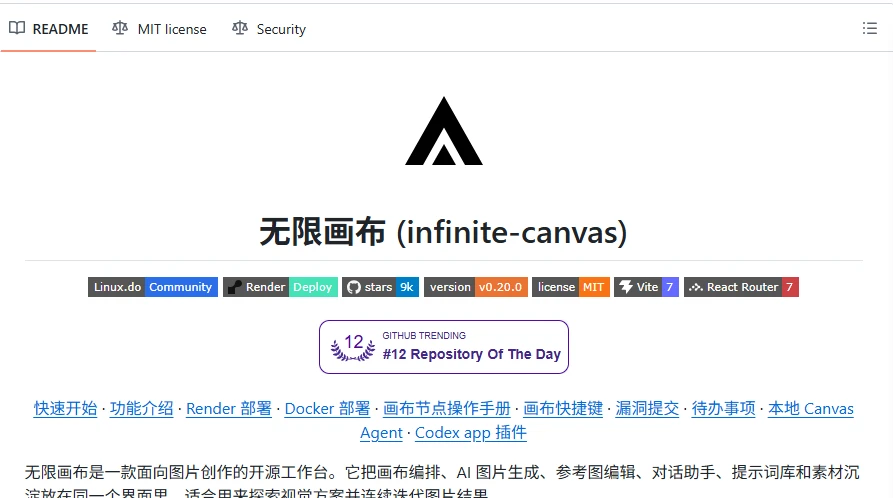
Even if something I make doesn’t make money, I still feel pretty happy as long as people use it often.
I’m increasingly able to understand those open-source programmers.
post-image
I’ve been using Qulian VPN for quite some time; global affiliate commissions are as high as 50%.
Stable enough for personal use, with prompt affiliate payouts.
Affiliate application center:
Website address:
post-image
Trenches
AGT
A
bade
b
AGT
0x5d...e274
Market Cap
$.
Change
.
24h Vol
$
Holders
.
CNPY
C
bade
b
CNPY
0xc6...ddd2
Market Cap
$.
Change
.
24h Vol
$.
Holders
.
FOLIO
F
bade
b
FOLIO
0x5f...e411
Market Cap
$.
Change
.
24h Vol
$.
Holders
.
FTR
F
bade
b
FTR
DFMt...pump
Market Cap
$.
Change
.
24h Vol
$.
Holders
.
DOPE
D
bade
b
DOPE
0xf9...8899
Market Cap
$.
Change
.
24h Vol
$.
Holders
.
Saturday’s Top Posted #Altcoins 🎗️
1️⃣ $TIA
2️⃣ $STRK
3️⃣ $PRL
4️⃣ $ZRO
5️⃣ $NEAR
6️⃣ $XRP
7️⃣ $QNT
8️⃣ $LIT
9️⃣ $QTC
🔟 $SOL
1️⃣1️⃣ $PROPS
1️⃣2️⃣ $ENA
Runner ups: $PONS, $MON, $ZEC, $SUI, $SEI
#Altseason2026 #Altcoins $DDY
post-image
TIA-4.85%
STRK-7.37%
PRL-3.54%
ZRO-12.70%
XRP-3.05%
Gate holdings data draws attention: Why have Hynix and SanDisk become trading hotspots?
As Japanese and South Korean stock markets saw sharp declines, the memory chip sector unexpectedly became a hot topic among traders. The Nikkei 225 fell 4.90%, while South Korea's KOSPI fell 7.56%, and market volatility quickly intensified. For investors following the semiconductor industry, the performance of SK Hynix and SanDisk is undoubtedly worth monitoring.
Odaily reported that CoinGlass data shows SK Hynix holdings on Gate account for 15.8% of the total across all platforms, ranking second; SanDisk h
EURUSD+0.15%
ETH at $2,430—have you cut your losses?
ETF outflows continue, the Fed raises rates by 25 basis points, CPI at 3.7% comes in above expectations, and everyone online is calling ETH useless—but it just won’t break below $2,400. Is this the last chance to get out, or the darkest night before dawn?
First, the surface picture: bad news is piling up, but the price is holding.
ETH is currently trading around $2,430, with a 24-hour range of $2,390-$2,490. It has pulled back 13% from its late-September high of $2,800, but has already rebounded from the recent low of $2,320-$2,350. BTC is also under pre
post-image
BTC-0.95%
ETH-1.74%
SOL-1.97%
$DOGE /monthly 🔥
#Dogecoin is back on the same long-term trendline that launched it twice before.
❇️ 2017 touch → 3 years later, 2020 touch
❇️ 2020 touch → 6 years later, 2026 touch
Both times, price bounced off the line and surged.
Price is sitting right below it again. Discount prices won't last long—this zone gets sold out fast 🚀
Are you loading up? 👇
post-image
DOGE-2.74%
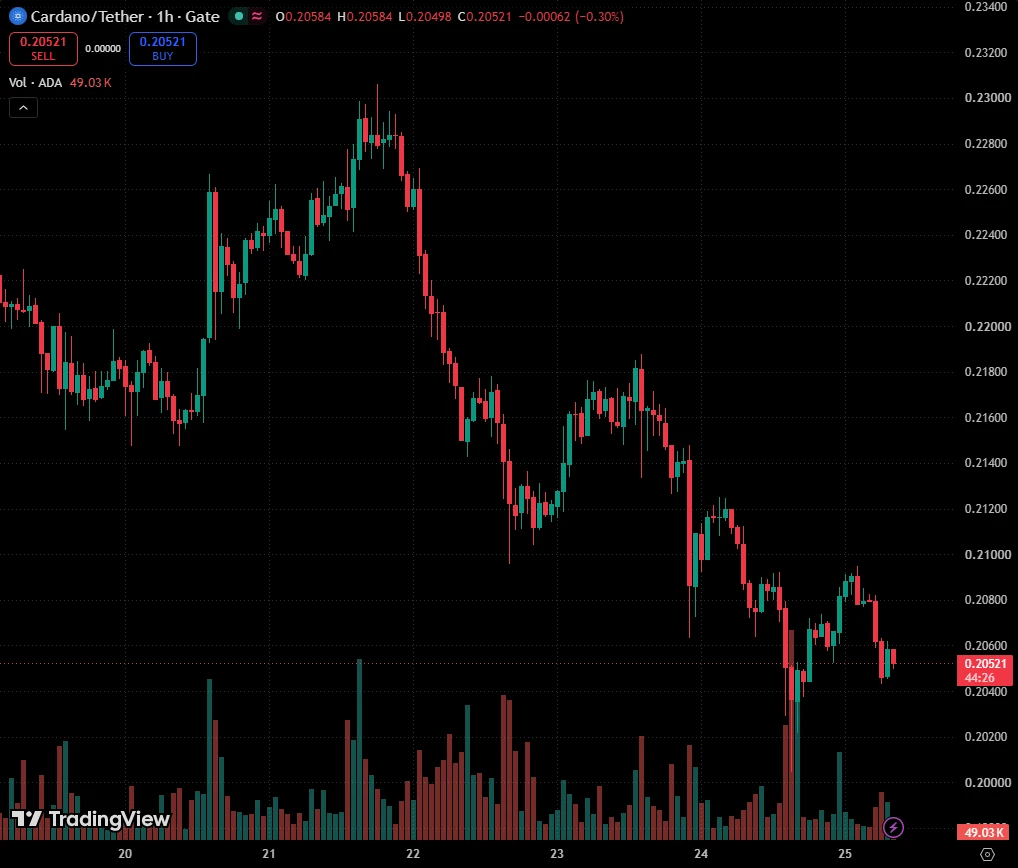
Cardano traders cut leverage harder than anyone on our board in the 24 hours to Oct 17. Open bets on $ADA moved -6.62% with price at -3.76%, and shorts were paying longs a -0.01% funding fee to stay in.
ADA-3.72%
#Gamdom100kRound2
@SirGamby & @ChizDroid Eradicate the Perpetrator Who Leaked the GAMDOM Server and Fix It!
Gamdom: Rezii09
Thank you for watching and supporting🙏✨
@stevewilldoit @kingadukes @JJChizzy @Romer @yungreal69 @gamdom @Itsrosebro
$BTC Evening outlook: 10.17.
The consolidation zone marked by the red box above has broken down. Repeated rebounds failed to break above the 82614 resistance and hold there; a failed attempt to break resistance inevitably leads to a pullback.
The pullback then broke below the 81788 support. After that, there were several attempts to reclaim and trade above 81788 resistance, as indicated by the white arrow above, but they failed. Is there any problem with opening a short here?
No, because it meets the conditions for a short. Which conditions are those?
First, the current trend is down, because
BTC-1.00%
gm,
is a good day to have a good day. and to do something ridiculous.
🐸
post-image
🔐 ONEA NETWORK—Without trust, no amount of connection matters.
Imagine a future where digital payments can cross geographical boundaries, different services can work together seamlessly, and digital assets can become part of everyday life.
But before any of this happens, one question must first be taken seriously:
Can people trust the systems they use?
Speed matters, convenience matters, and connectivity matters.
But security, transparency, and reliability are just as essential.
🌐 The foundation of an interconnected digital economy
As digital interactions continue to increase, users need to
post-image
  • 1
$NEAR INTENTS VOLUME IS ONLY THE START OF THE TOKEN STORY
The number I care about comes after the swap: how much revenue does the protocol retain?
Intents fees are shared with ecosystem participants. Revenue-share payouts are denominated in $NEAR, and product revenue has already funded token buybacks.
That creates a connection between usage and the token, but gross trading volume alone doesn’t tell us how strong it is.
My focus is retained revenue, actual buybacks and their size relative to new issuance.
For $NEAR, growing usage becomes more compelling when the economics grow alongside it.
post-image
NEAR-3.87%
$BR I nearly paid for another lesson on this 16-point move. I cut 30k U near 0.29 the day before yesterday. Today, I watched it surge to 0.494 and then get slammed back to 0.4046, with $159 million in trading volume—that kind of volume isn't generated by retail traders.
On-chain data shows heavy turnover by major players in the 0.38–0.40 range. The 24-hour price range is nearly 70%, a classic retest after a shakeout.
Sentiment is split: those who chased the rally are stuck above 0.48, while those who bought the dip couldn't hold on at 0.30. At the current 0.4046, 0.38 is the dividing line betw
BR+14.92%
#BitcoinTops$82K
#ShareWeekly
**BTC Market Analysis: Inflation Shock, the $80K Test, and the Next Move**
Bitcoin has spent the past week trading in a tight, nervous range, and the reason is inflation. Hotter-than-expected US CPI data on Wednesday (October 14) pushed traders to price in a higher-for-longer Fed. BTC rose to about $84,000 right before the print, then sold off. It briefly dipped below $80,000 as rate-hike fears and a global tech selloff hit risk assets. It then rebounded toward $82,000 on Friday, October 16, helped by easing Treasury yields and softer oil. Even so, BTC was still
BTC-0.95%
  • 2
Current price 1301.92, down 5.09% in 24h, trading volume 36.2M USDT; MA5=1300.92 is below MA20=1304.94, RSI=36.9 is nearing oversold territory, the MACD histogram at +2.42 has turned bullish, Bollinger range [1280.22,1329.66], 30-candle amplitude 9.35%, and the Fear and Greed Index at 55 remains in greed territory. Price is hugging the lower Bollinger Band, short-term moving averages are flattening, and initial signs of bullish MACD divergence indicate bearish momentum is fading. However, greed has not been flushed out, so a rebound is more likely to be short covering than a trend reversal; m
post-image
SNDKB
SNDKBSNDKB
Four.meme
MC:$3.87KHolders:1
0%
SUI-5.05%
Jensen Huang: Current market turmoil will pass, AI will bring change
live-cover
LIVE2,463
10.16 Friday strategy review (reposted)
The market sharply reversed downward yesterday. I stayed up late watching the charts, so I’m posting today’s review now. I had already said to prioritize the short strategy.
Strategy results, current market analysis and trading recommendations:
Strategy review:
$BTC Short entered at 828; the second target at 812 has been reached
BTC long position: the third target at 828 has been reached
$ETH Short entered at 2460; the third target near 2380 has been reached
ETH long position: the second target at 2440 has been reached
$ZEC Short entered at 1240-1260;
BTC-1.00%
ETH-1.79%
ZEC-5.32%
CRYPTO MARKET OVERVIEW
live-cover
LIVE994
$ETH ‌ is looking a bit weak here.
• Lost the $2,550 level
• Trading back below the April highs
• $2,450 is now the key level to watch
If Ethereum fails to close the week above $2,450, another flush could be on the table.
Watching the weekly close closely. 👀
#USSeptemberPPIBeatsExpectations
#GateWCTCS9GlobalTradingCompetition
#GateBTCAndETHFuturesVolumeRanksTop3
post-image
ETH-1.74%
Can you always chase longs when the moving averages are in a bullish alignment? No—the key is the price’s position relative to the upper Bollinger Band and the direction of the funding rate.
$SAND is a textbook example. MA5=0.060036 has crossed above MA20=0.056368, confirming a bullish moving-average structure; however, the current price of 0.0623 is above the upper Bollinger Band at 0.0615327, and RSI=73.7 is in overbought territory, making this a “healthy trend, but elevated price” in the short term. The right move here is not to chase at market, but to wait for a pullback to the moving-ave
post-image
MSTRB
MSTRBMSTRB
Four.meme
MC:$3.29KHolders:4
0.07%
SAND+12.77%
AMP+6.05%
Load More

Join 40 M users in our growing community

⚡️ Join 40 M users in the crypto craze discussion

💬 Engage with your favorite top creators

👍 See what interests you

Trending Topics

USSeptemberPPIBeatsExpectations

91.35k Views1.92k Discussing

US September PPI came in at 6.3% YoY, well above the 5.3% market expectation, pointing to renewed producer-side inflation pressure. Weekly jobless claims were 199K, broadly in line with forecasts. Could hotter inflation further reduce room for rate cuts, and what does it mean for $BTC, US stocks, and gold?

GateWCTCS9GlobalTradingCompetition

37.87k Views6.62k Discussing

GateBTCAndETHFuturesVolumeRanksTop3

53.8k Views1.77k Discussing

View More