
Square
Following
Hot
News
Profile
Share your thoughts
placeholder
Article
[New Streamer] Whales Moves in Sync!
live-cover
LIVE2,479
yo @grok and @bot ain’t she awesome
#bmw #bmwe36
post-image
Trenches
ZIG
Z
bade
b
ZIG
0x8c...1145
Market Cap
$.
Change
.
24h Vol
$.
Holders
.
uni
u
bade
b
uni
jM9r...pump
Market Cap
$.
Change
.
24h Vol
$.
Holders
.
Anakin
A
bade
b
Anakin
Exxz...pump
Market Cap
$.
Change
.
24h Vol
$.
Holders
.
IDOL
I
bade
b
IDOL
0x3b...ab07
Market Cap
$.
Change
.
24h Vol
$.
Holders
BTC
B
bade
b
BTC
C5xp...pump
Market Cap
$.
Change
.
24h Vol
$.
Holders
.
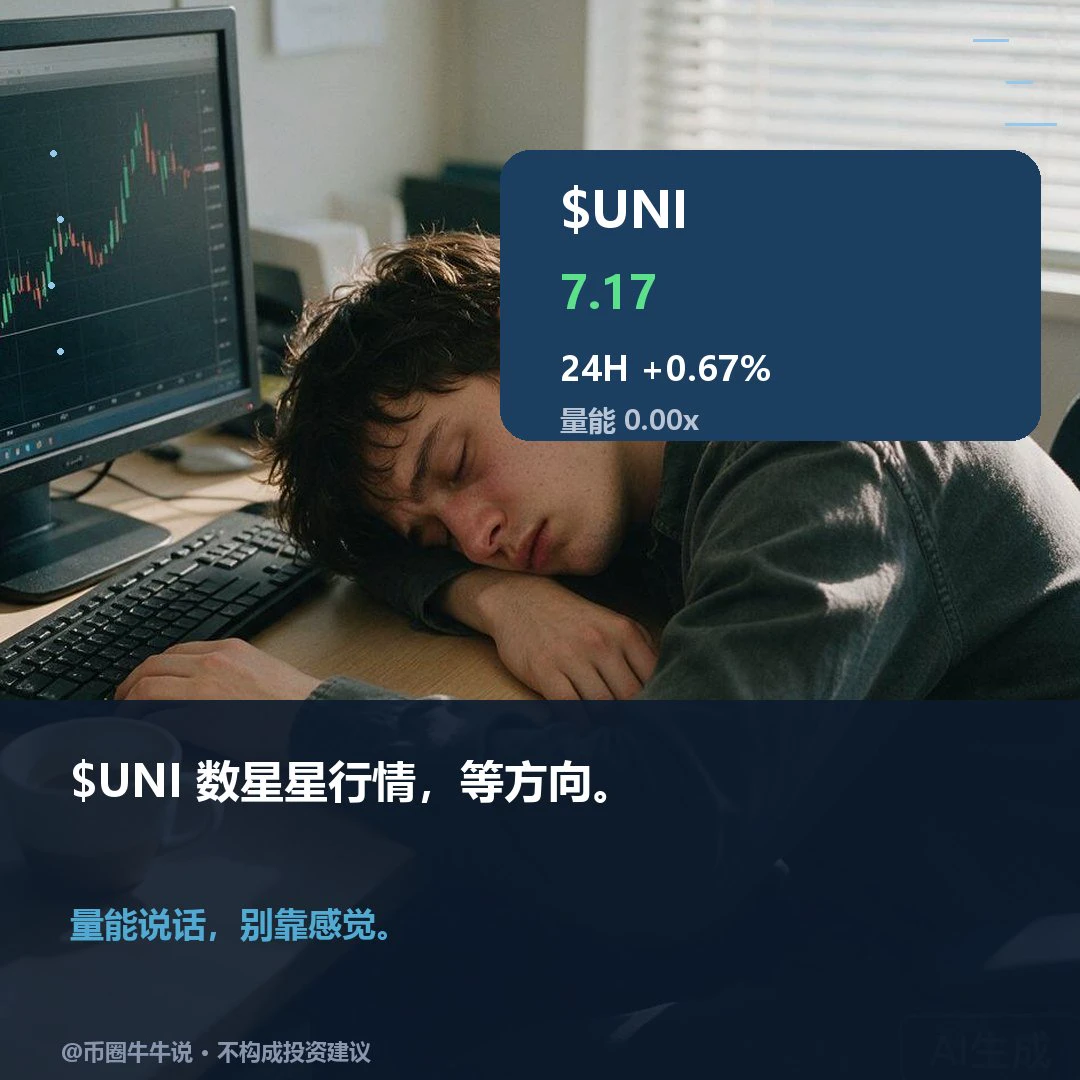
$UNI is currently at 7.17, up 0.67% over 24H. The 1H chart is weak (RSI 42.1), while the 4H chart is strong (RSI 59.8), indicating a divergence. If it holds above the 7.4 resistance, a rebound may be worth watching; if it breaks below the 7.021 support, it may move lower. In the follow-up review, watch whether it can hold above resistance and recover after losing support. With the two time frames diverging, short-term moves should not be taken directly as a trend reversal. Market volatility is high; for observation only.
post-image
UNI+3.05%
[New Streamer] Market Prediction
live-cover
LIVE1,387
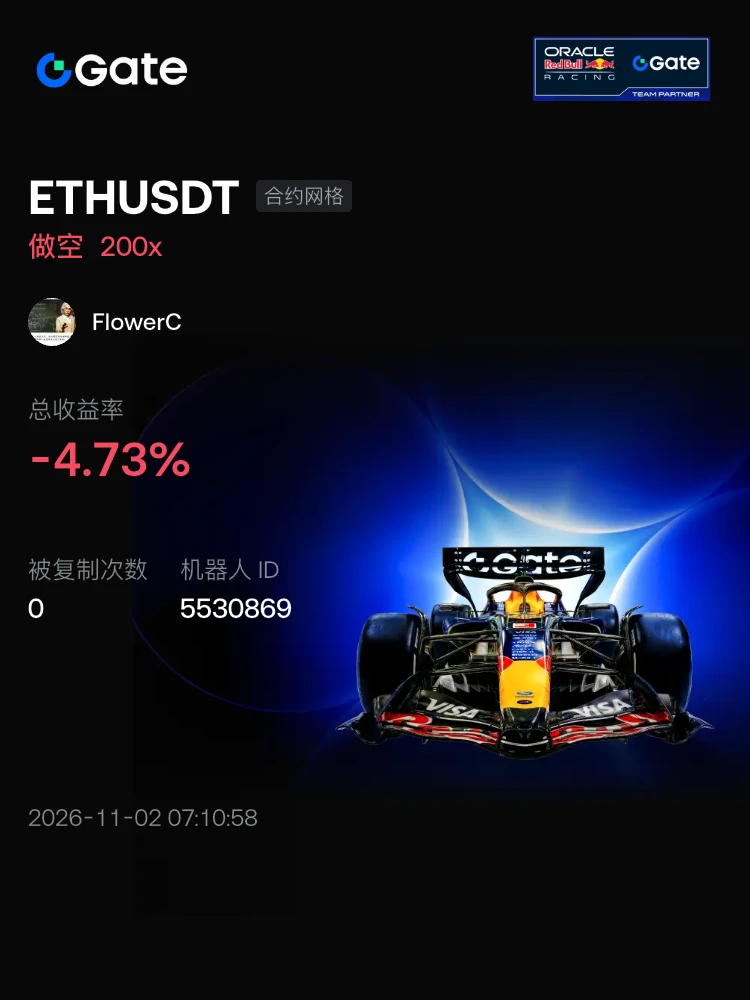
#交易机器人 Follow the major trend, go against the minor trend. Short ETH and get in on the gains~#ETH回落
post-image
ETH-1.23%
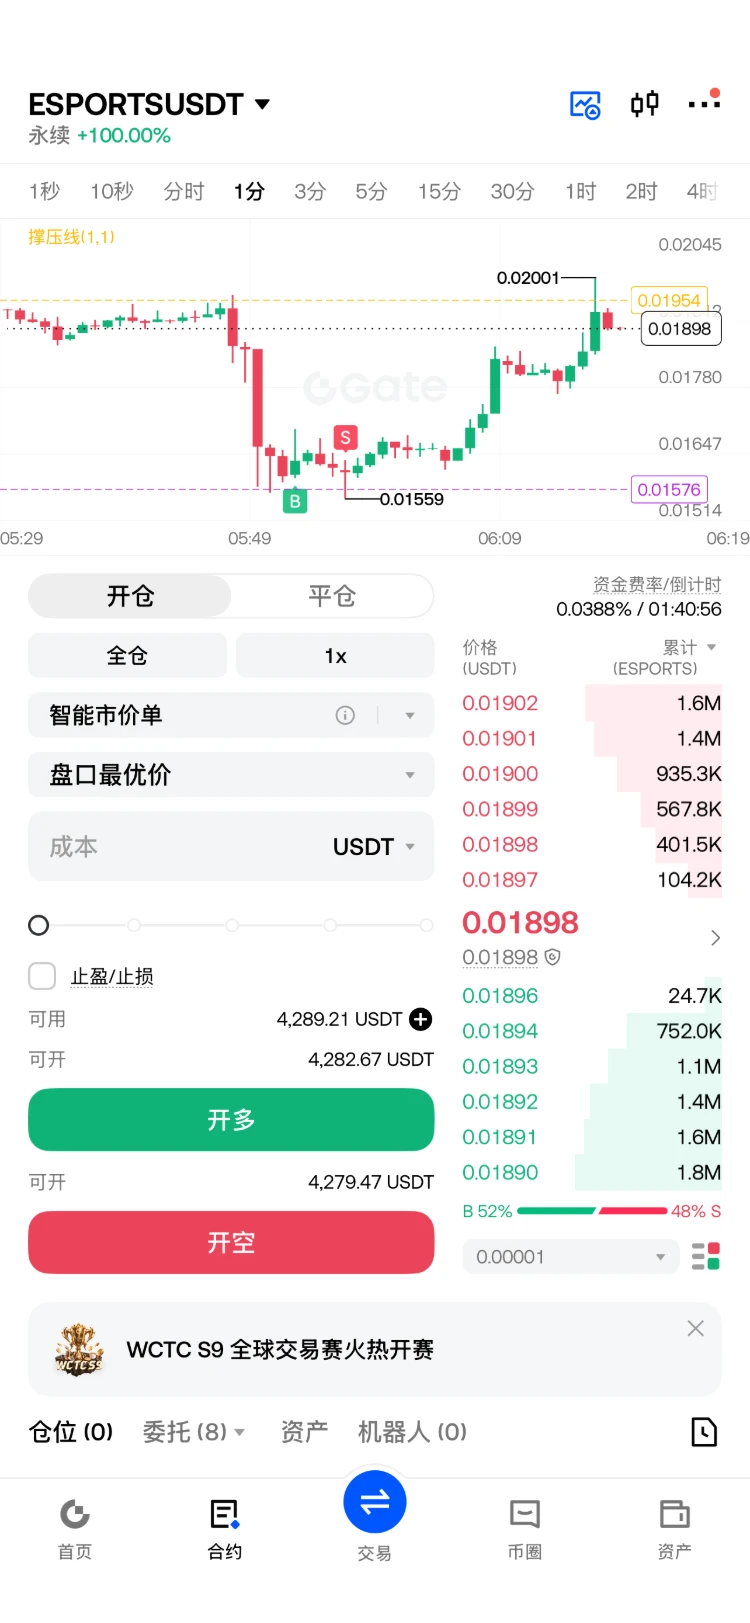
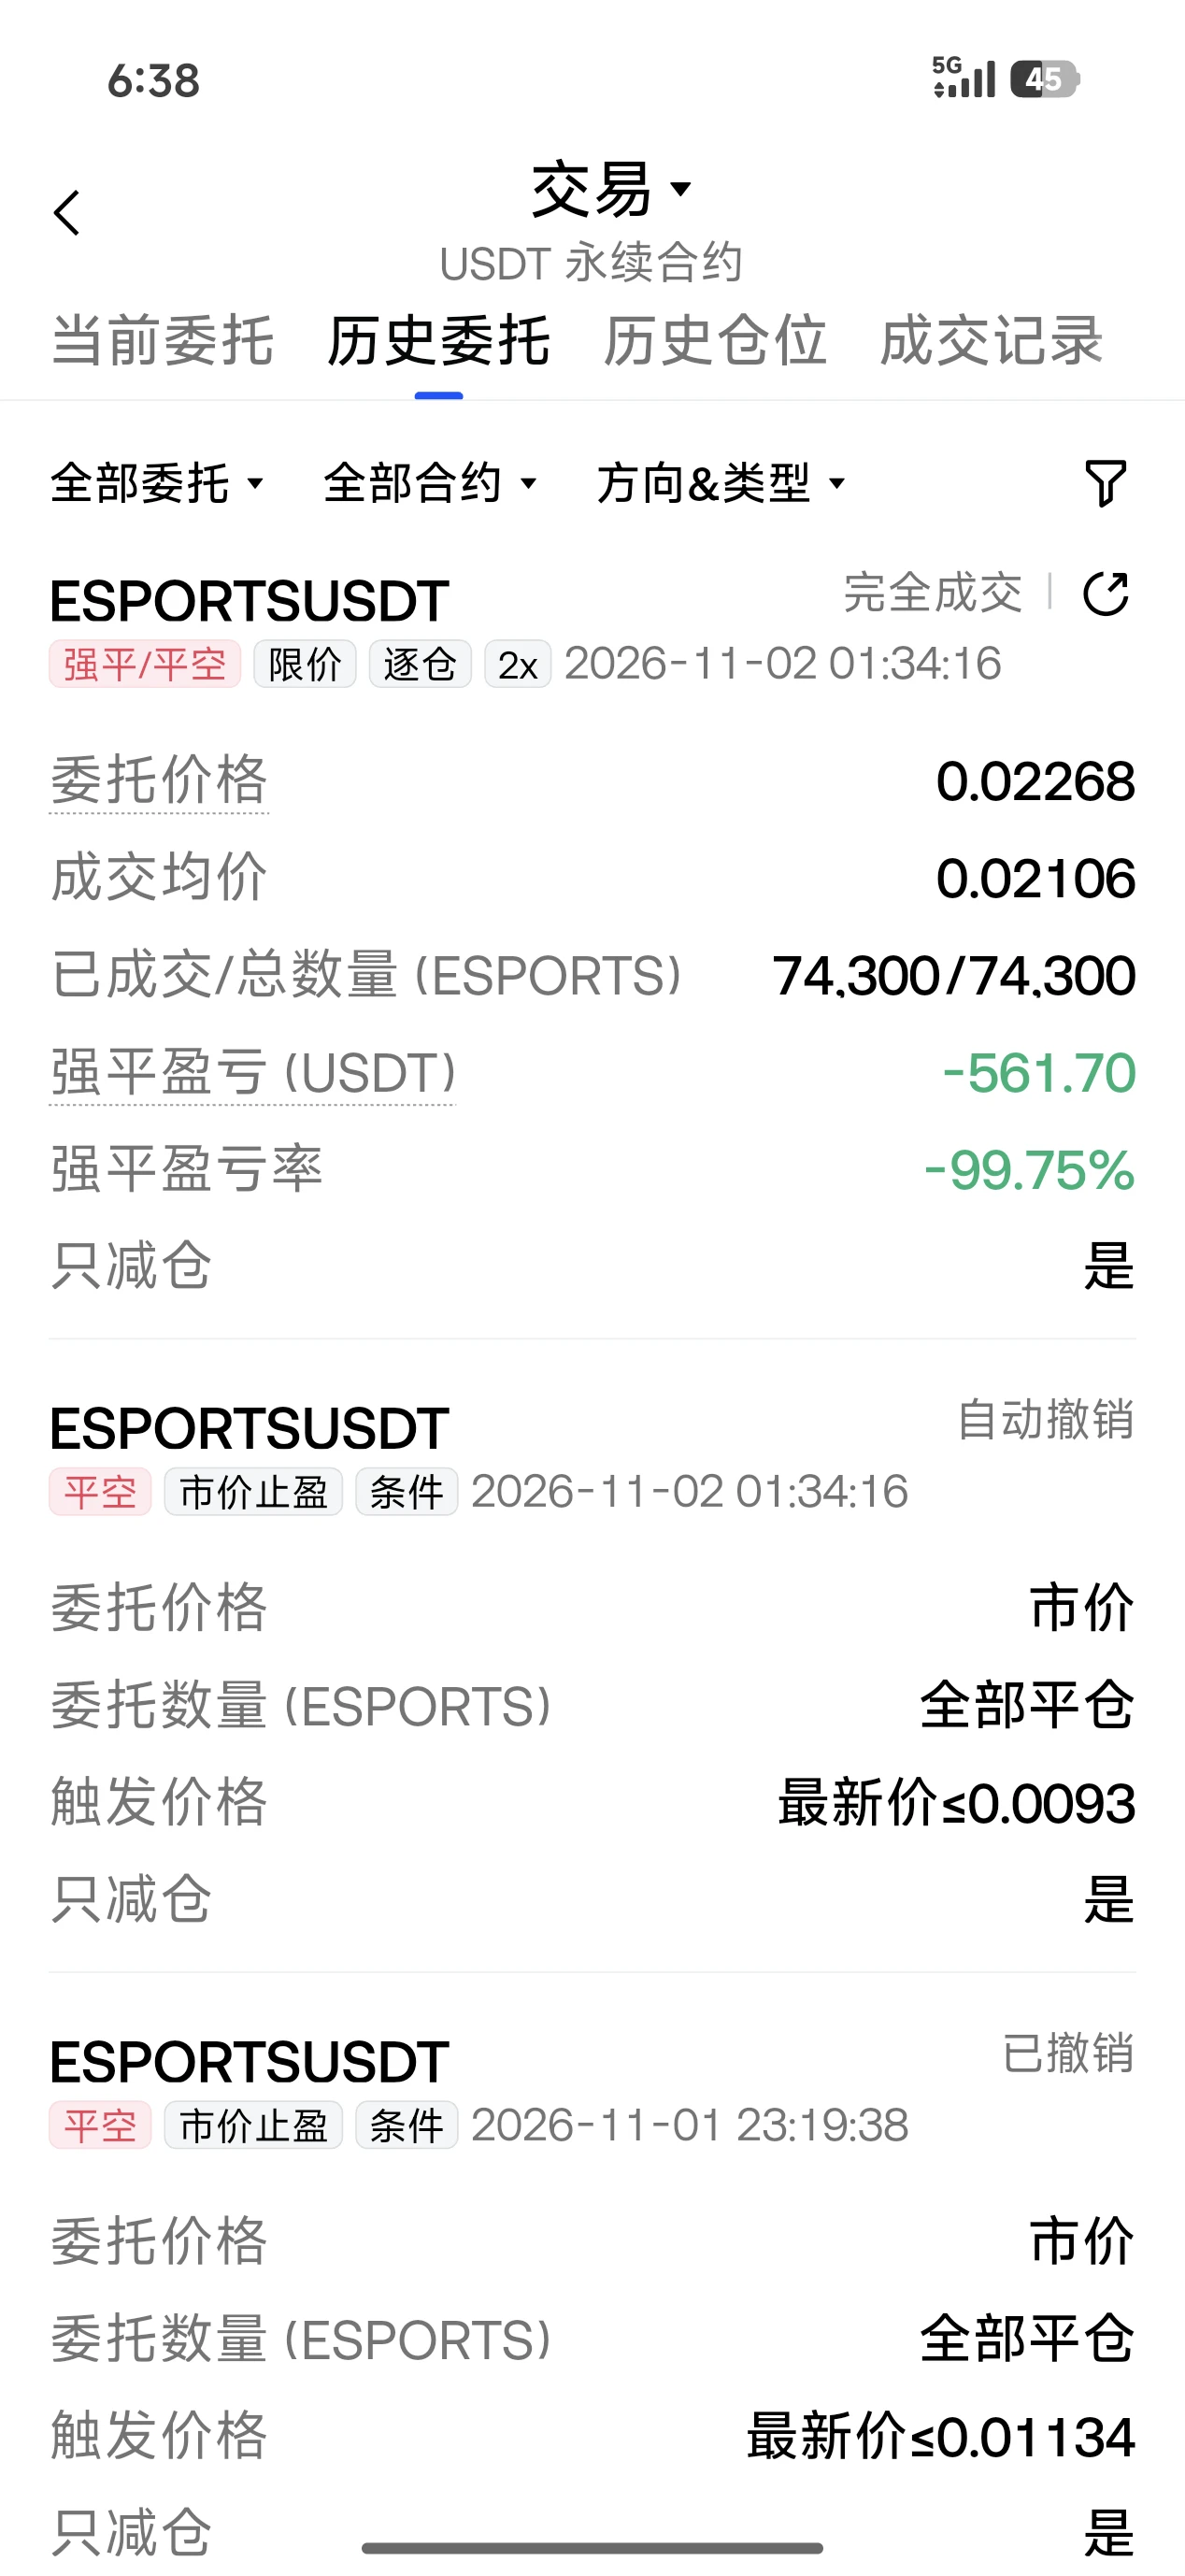
I went long on ESPORTS. Should’ve known better than to set a stop-loss—I got stopped out with pinpoint precision🤣
post-image
ESPORTS-4.77%
  • 4
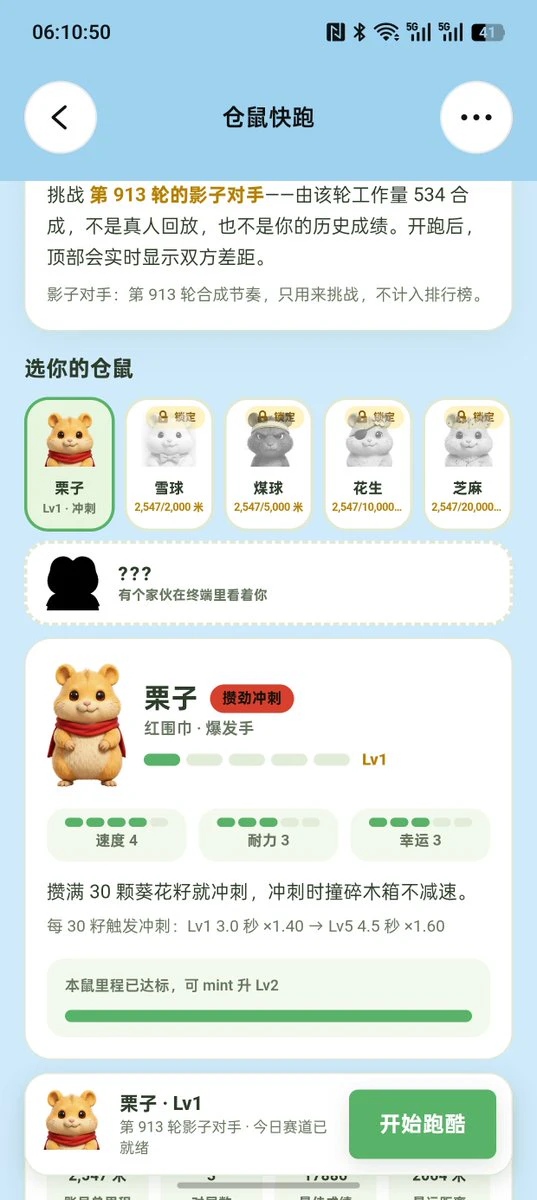
Developing games with AI is really fun
Hahahaha
I finally understand the joy of being a game developer
Poor people play with cars, rich people play with dicks, and the ultra-rich play Hamster Run
post-image
Markets bad, gonna cope and buy some packs on app.
What should I get?
post-image
  • 1
Many people see “funding rates turn positive and chase longs.” This is precisely the easiest trap to fall into in a weak market: a positive rate only means longs are paying, not that there is buying support for the price. The current Fear & Greed Index is 34, and the market remains in fear territory, so comparing relative strength within the same sector is more meaningful.
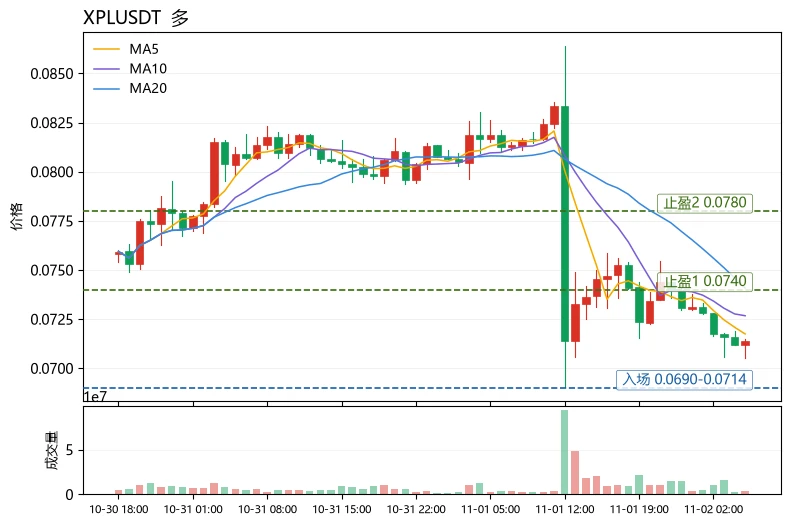
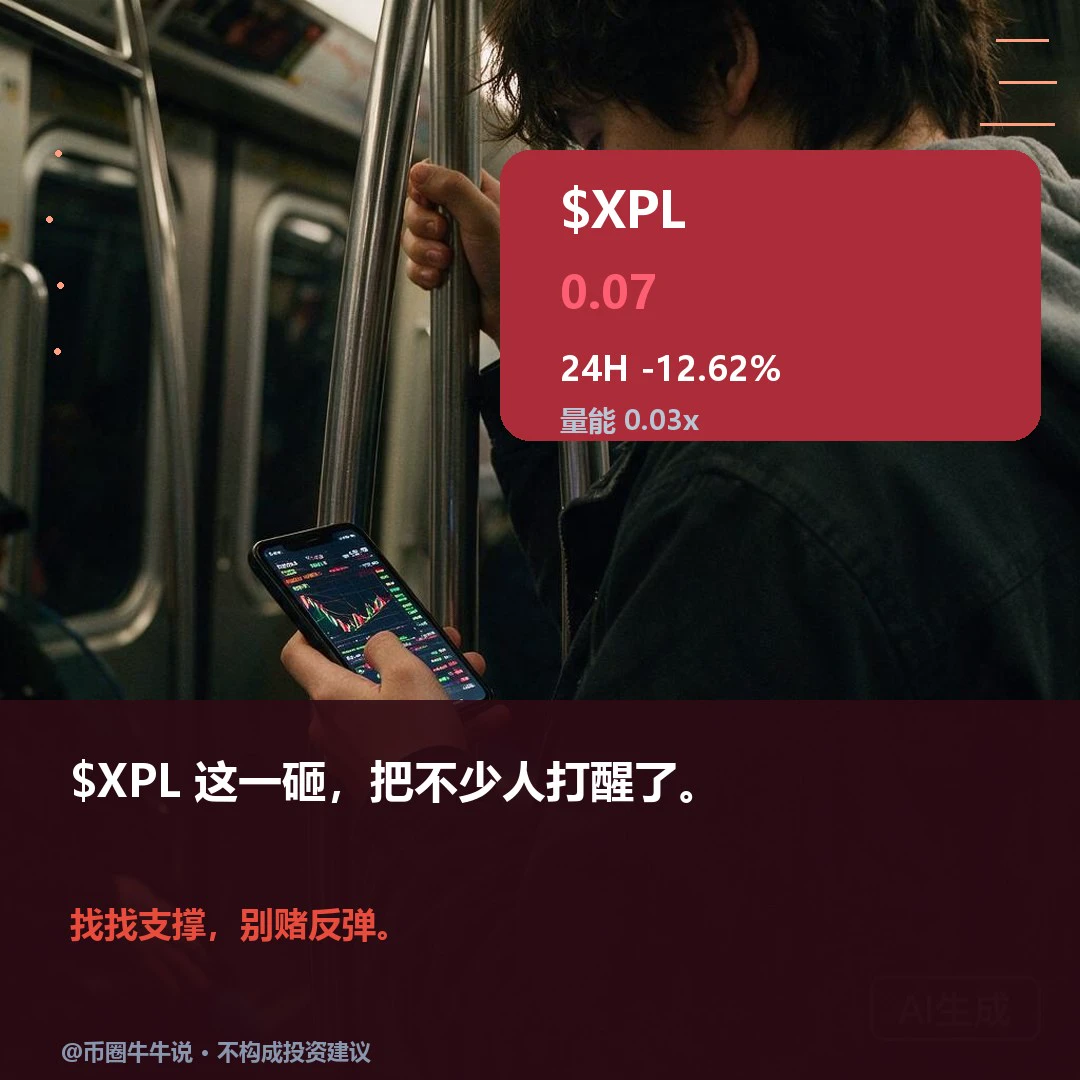
$XPL is down 12.72% over 24 hours, between LINK at -4.28% and LSK at -15.02%, but its 30-candle range is 24.31%, far more volatile than LINK’s 5.5%, making it a high-beta laggard. Technically, MA5=0.071746 is below MA20=0.0
post-image
XPL-0.60%
LSK-5.22%
The U.S. Treasury is set to spend $10 billion next week buying back its own debt, while China and Japan are still trimming their holdings. This money is there to put a floor under the bond market. With holdings piled this high, any liquidity trouble could trigger a market reversal—don’t ask why. We’ll see next week whether the bond market can catch its breath. Follow if you’re keeping an eye on it.
post-image
  • 7
  • 2
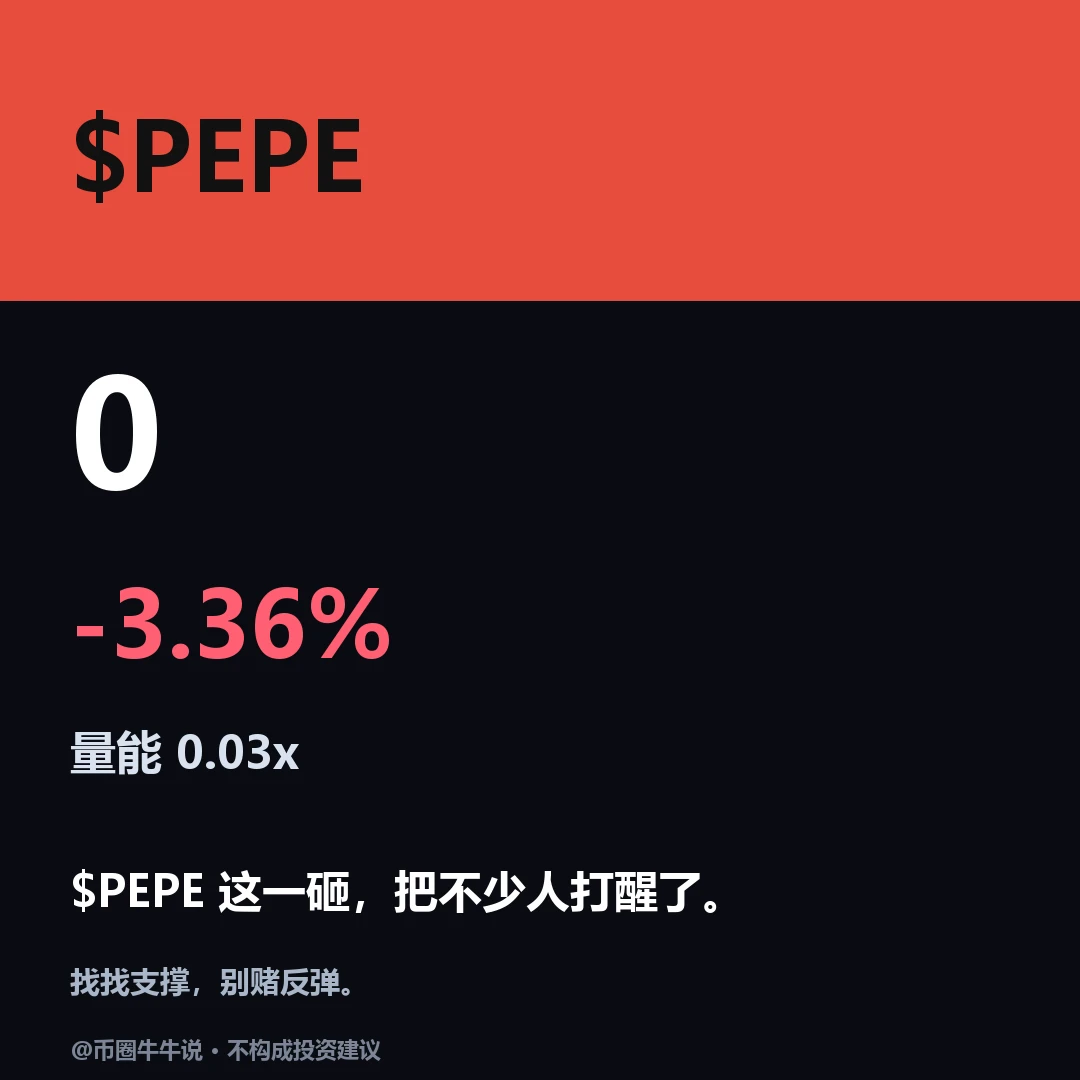
Weak, with $PEPE currently at 0.00000489, down 3.36% over 24 hours, but trading volume is only 3.3% of average. This low-volume decline looks more like a lack of buying support than selling pressure taking the lead. The one-hour and four-hour trends are both weak, but such low trading participation undermines the credibility of this decline. If bears are really in control, why is volume not even 20% of average? A break below 0.0000048 would confirm weakness; reclaiming and holding above intraday resistance would warrant reassessing the outlook. A decline without volume confirmation looks more
post-image
PEPE+0.97%
$ESPORTS Holy shit, it actually liquidated me. It hit the liquidation price exactly
post-image
ESPORTS-5.30%
  • 3
Weak. $XPL is currently at 0.07108. Although the 1-hour RSI has entered oversold territory, trading volume is only 2.7% of the average, making this oversold condition look more like a pause in the decline than a reversal signal. If oversold automatically meant a bottom, why is the price still hugging the 1-hour moving average and continuing to weaken? A genuine halt in the decline needs volume confirmation, not just an oversold indicator. A break below 0.06903 would confirm weakness; reclaiming and holding above intraday resistance would make it worth reassessing the outlook. Oversold only ind
post-image
XPL-0.60%
Dipping toes into the 4.27s dip for a clean relief bounce back to the MA! 🚀New long position on $NEAR .Opening Zone: 4.240 - 4.273Take Profit 1: 4.456Take Profit 2: 4.616Defense Level: 4.113You can trade here.
‍$BTC plus $BEAMX are on my watchlist.
post-image
NEAR+1.17%
BTC-0.67%
BEAMX+5.82%
The weather’s getting cooler.
Let’s have something to warm our stomachs. Same as always, X friends, you eat first 👋.
Once you’ve finished, I have a question for you.
Guess where this breakfast is from 👀?
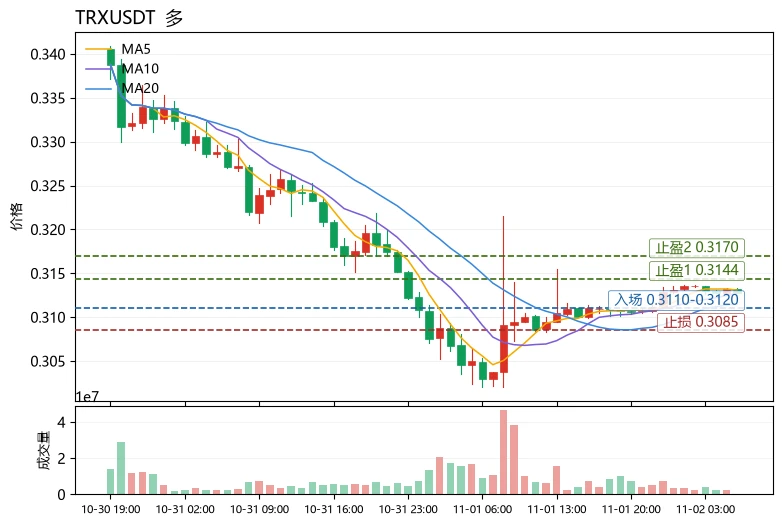
$TRX The most unusual detail in today's market isn't the gain, but the funding rate: up 3.17% in 24h, while the perpetual funding rate is -0.0161%. The price is rising while shorts are still paying to hold their positions, indicating this rally isn't driven by crowded leveraged longs, so the risk of chasing the price is relatively limited. Viewed through a moving-average framework, this is a reusable way to assess the market: a healthy trend isn't defined by how far the price is from the moving averages, but by whether the short-term averages hold above the long-term averages and pullbacks st
post-image
TRX+0.42%
AAVE-1.22%
XRP-1.15%
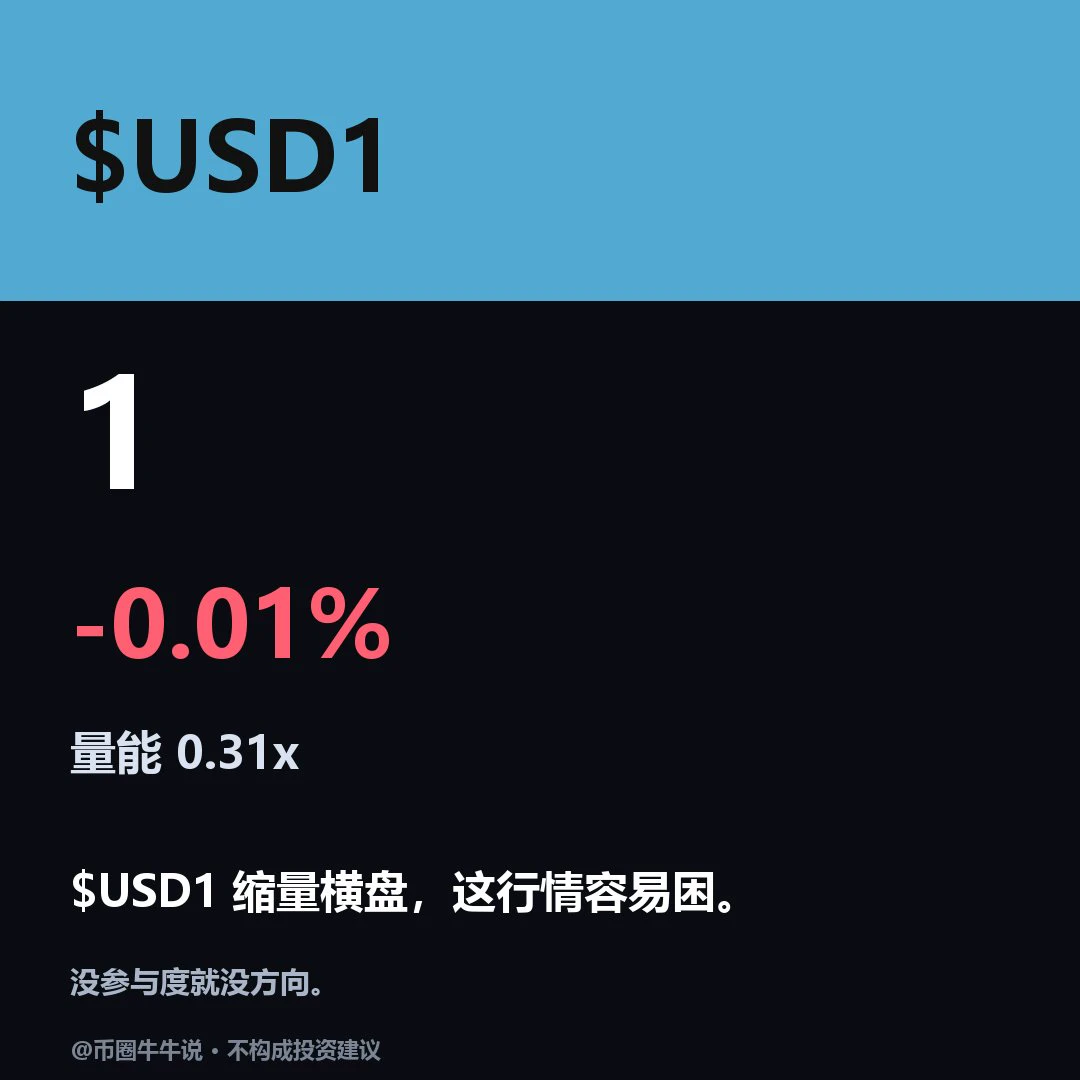
$USD1 is currently trading at 0.99908, down 0.006% over 24H. The 1H is relatively strong (RSI 61.2), while the 4H is relatively weak (RSI 51.6), showing a divergence. If it holds above resistance at 0.99947, a rebound may be possible. If it breaks below support at 0.99868, it may move lower. In the follow-up review, watch whether it can hold above resistance and recover after losing support. With divergence between the two timeframes, short-term moves should not be taken as a trend reversal. Market volatility is high; for observation only.
post-image
USD1+0.00%
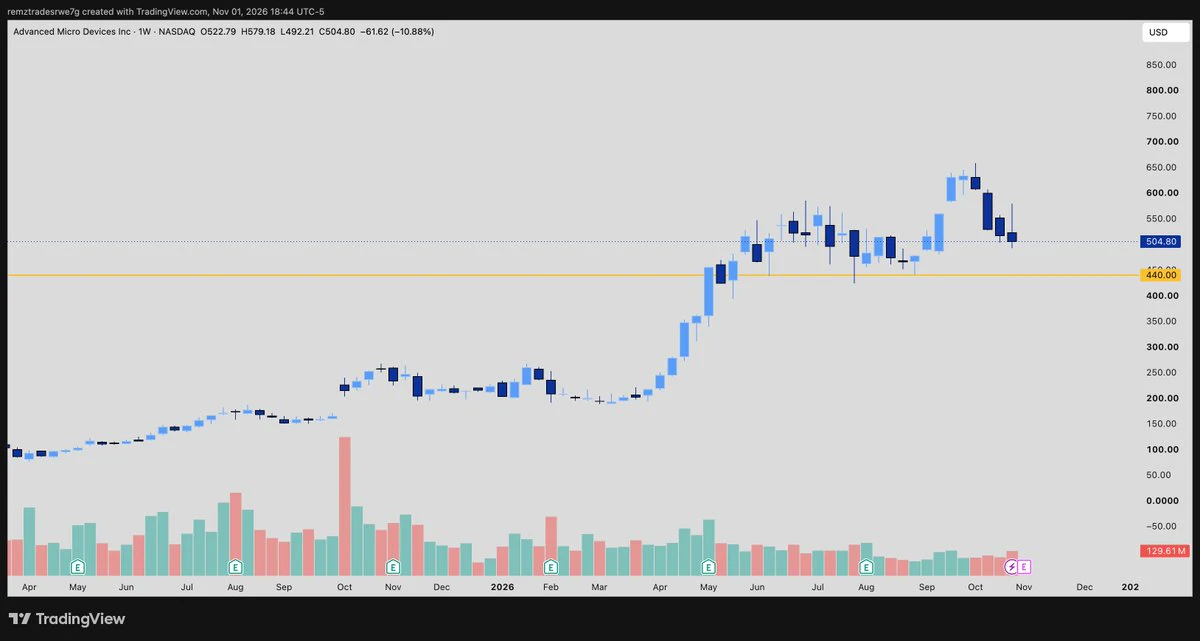
$AMD
Holding above $500 heading into earnings. This is pretty much a make or break moment for this name.
If $500 fails to hold, we could see $440 next.
post-image
AMD-10.81%
Most Users Don’t Care Whether Your App Is Built On Crypto Rails Or Not. Most Users Care About The Value Your App Brings To Them.
post-image
Buy $MAGMA . The plan remains simple: entry price 0.44841–0.45357, take profit at 0.4780, then 0.500; stop loss at 0.43496. The magma is cooling—get ready for the next eruption, brothers. Put on your heat-resistant suits; we're going to test 0.48! Note: Low volume and declining open interest could lead to a further retest of lower support. Brothers, don't go all-in. Manage your position size based on your account.
post-image
MAGMA-0.57%
Load More

Join 40 M users in our growing community

⚡️ Join 40 M users in the crypto craze discussion

💬 Engage with your favorite top creators

👍 See what interests you

Trending Topics

BTC大跌

537.51k Views39.94k Discussing

$BTC briefly fell below $77,000 and remains under pressure around the $77K zone, with its 24-hour decline still above 4%. With risk appetite weakening and Fed uncertainty rising, where is the next key support after losing $80K?

IntelBeatsEarningsButStockPlunges

50.9k Views1.1k Discussing

StrategySTRCNears100ParValue

59.57k Views4.23k Discussing

View More