Square
Following
Hot
News
Profile
Share your thoughts
placeholder
Article
Does launching a testnet mean the product is ready?
When researching a blockchain project, if I see the words “network launch,” I first check what exactly went live: the testnet or the mainnet?
That directly affects how I interpret the data that follows.
Transaction counts, participating addresses, and performance in a test environment can help assess feature testing, but they cannot be taken as evidence that the finished product has attracted the same level of real demand. Test token balances also can’t be valued at mainnet asset prices.
In my notes, I keep the stages separate: which features
post-image
Rewards have stopped—how many people stayed?
When an on-chain app suddenly gets busy, I’ll check whether it just happens to be giving out rewards.
It’s no surprise that funds and participants are willing to come in when there are rewards. What I’d rather keep watching is how many addresses are still using it after the campaign ends, whether the funds stay, and whether those remaining funds have any real use.
For example, if deposits in a lending app increase, I’ll also check whether borrowing demand has kept up. If people are only parking their money there to claim incentives, that means somet
post-image
Trenches
BNCB
B
bade
b
BNCB
0x49...ec3f
Market Cap
$.
Change
.
24h Vol
$.
Holders
.
ENA
E
bade
b
ENA
0x57...6061
Market Cap
$.
Change
.
24h Vol
$.
Holders
.
PEPE
P
bade
b
PEPE
0x69...1933
Market Cap
$.
Change
.
24h Vol
$.
Holders
.
GTA6
G
bade
b
GTA6
4kjr...zDnz
Market Cap
$.
Change
.
24h Vol
$.
Holders
.
XDP
X
bade
b
XDP
0x07...91d0
Market Cap
$.
Change
.
24h Vol
$.
Holders
.
With the same pullback, why has $BTC fallen the least? The answer lies in relative strength: BTC is currently at 78486.5, down just 1.80% over 24h, while SOXLB fell 12.21% and INTCB fell 23.39%. Panic selling has been concentrated in high-volatility assets, while BTC has instead become a defensive anchor within the sector.
Technically, the price is above MA5 (78198.5), though still below MA20 (79366.7). RSI is just 42.2, not yet in oversold territory, and the MACD histogram at -60.93 indicates mild bearish momentum. The Bollinger lower band at 76455.7 provides structural support. The funding r
post-image
INTCB
INTCBINTEL
Four.meme
MC:$3.22KHolders:4
0.16%
BTC-0.65%
#HYPE逆市大涨 #GateSquar🌕✨
Hyperliquid’s Growing Wall Street Appeal: A Landmark Step Toward Institutional Integration and On-Chain Futures Expansion
Wall Street’s interest in Hyperliquid technology is accelerating rapidly, marking one of the most significant validations yet for a leading decentralized perpetual futures platform. Intercontinental Exchange, the parent company of the New York Stock Exchange, has signed a definitive agreement with Trade[XYZ] to develop regulated perpetual futures markets in the United States built on Hyperliquid’s infrastructure. This development sent HYPE, the nati
  • 6
Bitcoin Falls to $77,000: Is This a Market Correction or the Start of a Deeper Decline?
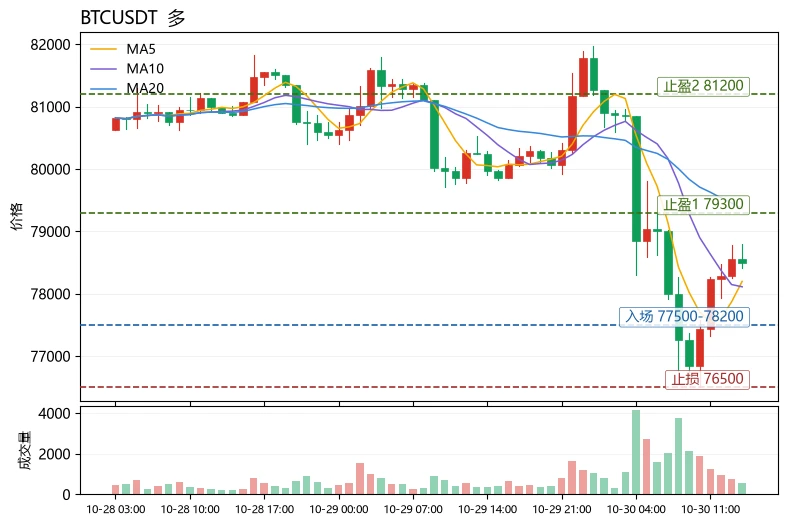
Bitcoin's drop below $80,000 has changed the short-term market picture. After trading around $81,700–$82,000, BTC moved sharply lower toward the $76,600–$78,000 region. This decline has put traders under pressure and raised an important question: Is Bitcoin preparing for a recovery, or could sellers push the price even lower?
My view is that this is a critical moment for Bitcoin. I am not treating the recent decline as an automatic buying opportunity. I want to understand what is happening beneath the price
BTC-0.67%
$XPL ‌ MARKET WATCH: BULLISH STRUCTURE, BUT NO ACTIVE TRADE YET! 📊
Plasma (XPL) is showing a Bullish structure within a Trending Market (Uptrend), currently sitting in an Accumulation phase. However, the overall status is Neutral, meaning the price is just chopping sideways right now.
Because the system shows No Active Setup (Position: None), we have to be patient. But if you want to prepare for the next move, here is the conditional LONG setup to watch:
🎯 Conditional Trade Setup (LONG):
· Entry Zone: $0.0736 - $0.0745 (Buy the support bounce).
· Take Profit 1: $0.0795 (Just below resistanc
XPL-0.60%
A loss of over 80% across the board: These “near-zero” altcoins are draining retail investors’ pockets dry 🩸
Folks, today’s market sell-off is already depressing enough, but I have to pour cold water on things again—don’t touch those altcoins at the bottom! Take a look at this screenshot of the so-called “promising coin screener.” I don’t think it should be called a screener at all; “retail investor harvesting list” would be more accurate.
💡 Why is buying the dip just giving your money away? Plenty of newcomers see a coin down 90% and start thinking, “It’s fallen this much already—how much l
post-image
BTC-0.67%
ETH-1.26%
GLDX-0.40%
PAXG+0.37%
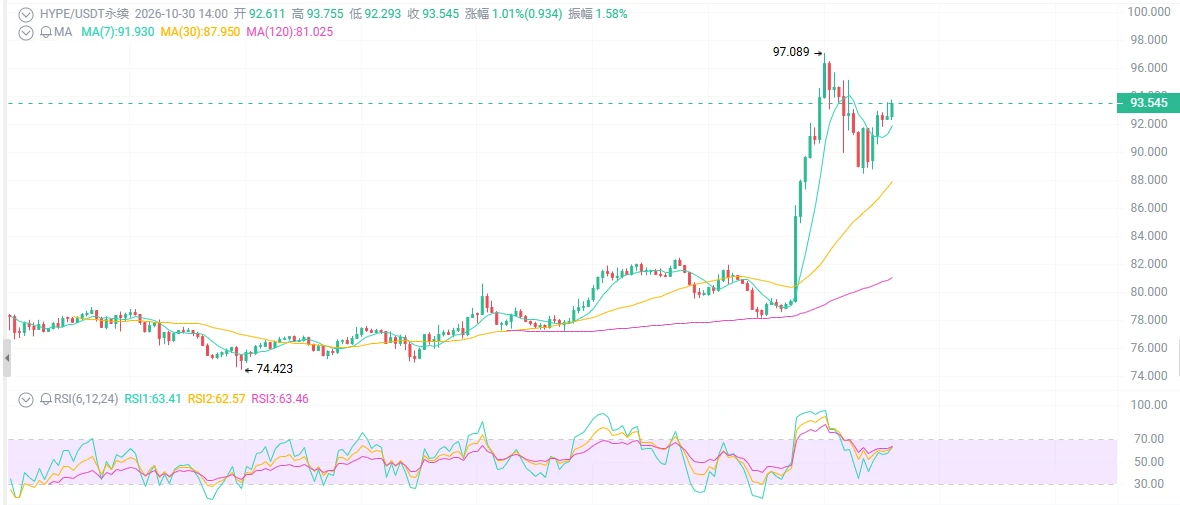
HYPE at $93.5—are you chasing it?
The broader market is bleeding, yet HYPE has surged 18% against the trend, with volume hitting $3 billion and its all-time high just 4% away. Everyone is asking: jump in now and make a profit, or get stuck holding the bag?
Up 16–18% in 24 hours
Volume above $3 billion, several times the usual level
Market cap of $22–23.6 billion, climbing into 9th–10th place
Just 4–5% below its ATH of 97.9–98
The candlestick chart tells the story: a violent 24-hour rally from a low of 78.5 to around 97, followed by a pullback to consolidate at 93.5. A classic news-driven break
post-image
BTC-0.67%
ETH-1.26%
HYPE+0.24%
Is it enough to study only coins that went up?
When summarizing a sector, if I only pick a few projects that performed well afterward, it’s easy to reach an overly simplistic conclusion: buying into this sector at the time was the right move.
But the options available at the time usually weren’t limited to those few. There were also projects that stayed flat for a long time, became increasingly illiquid, or even later exited the trading market.
So when I track them, I try to preserve the candidate list as it stood at the time, rather than deleting the names that performed poorly after the resu
post-image
Why are the billboards at the airport in Thailand only in Chinese? 🫣
post-image
One person's lunch✌️
Boiled egg, chicken ham slices, raisin bread with milk
What did everyone have for lunch?
post-image
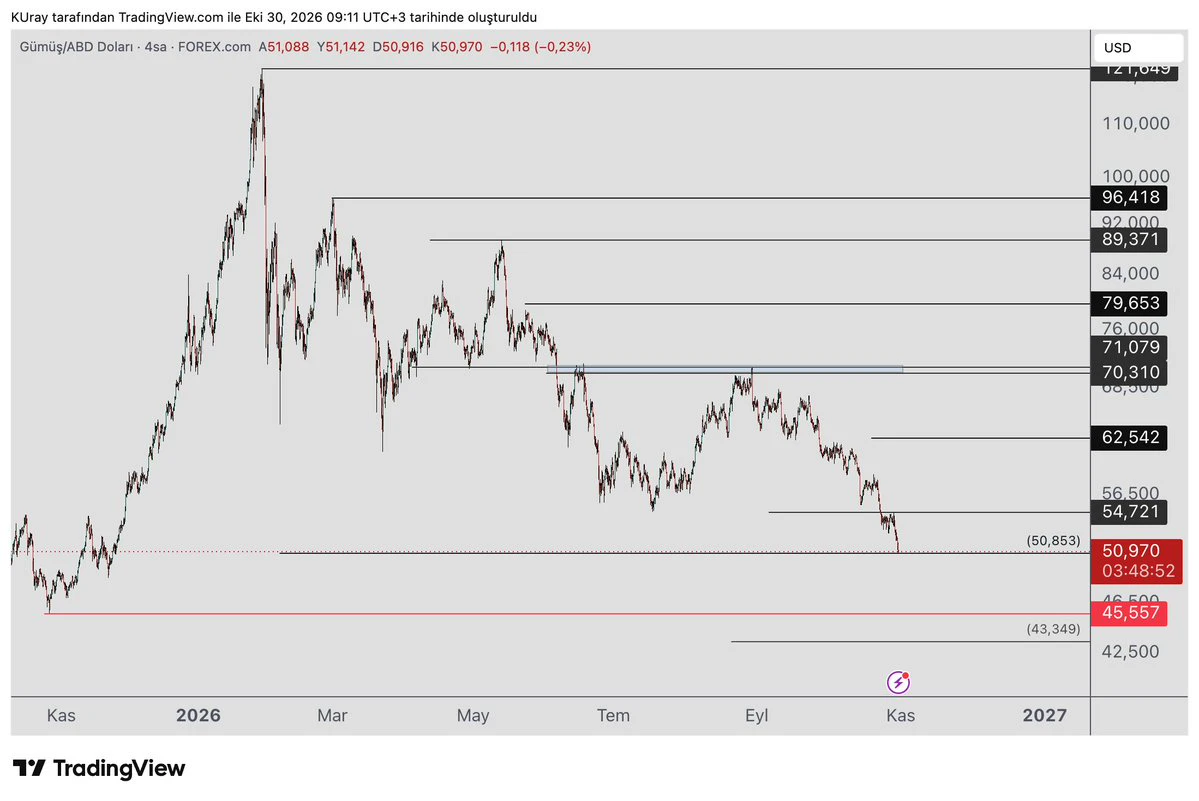
#xag #Gümüş continued to decline and has now reached the support at 50.8. As it fell to this area, it showed RSI divergence on the 4-hour chart and also entered oversold territory on the daily chart. Being at support and showing RSI divergences are signs that we may be in an area where buyers could step in.
Buyers are not strong right now, but if candles with long lower wicks start appearing during the day, a rally could follow.
If the price closes above 54.7 during the rally, further upside is expected. It could test 62 and the 70-71 area. A daily and weekly close above this area would provi
post-image
XAG+0.47%
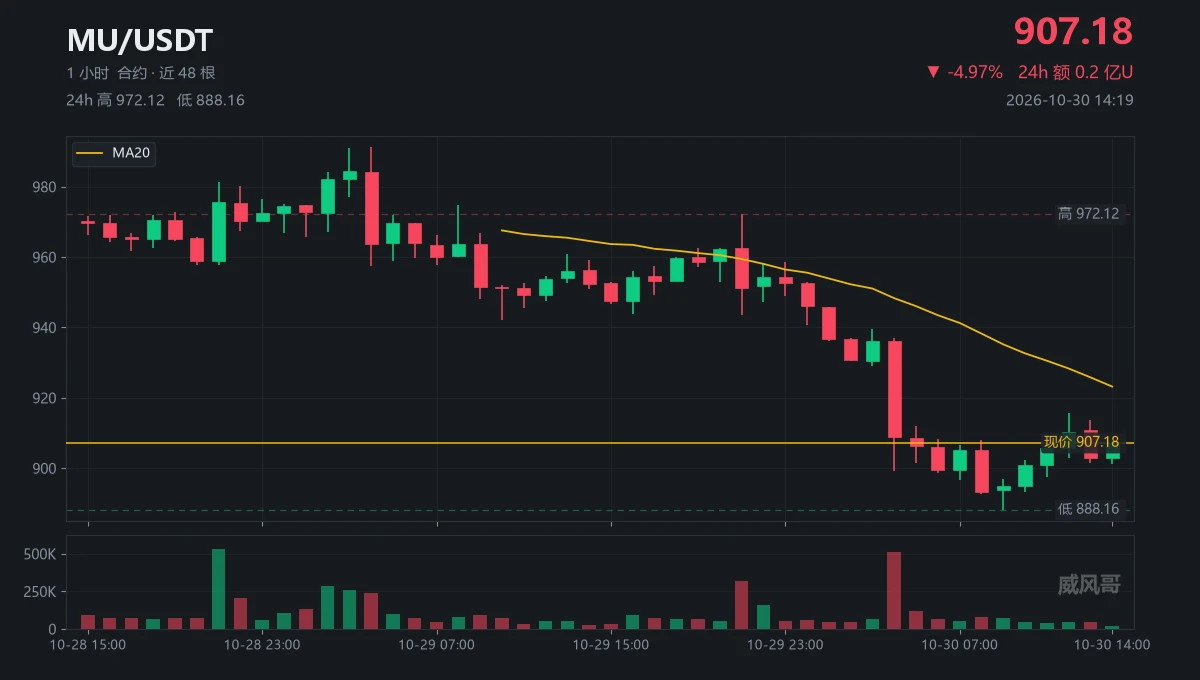
At 04:00, one candle saw volume of 509,000, while the first four totaled 219,000.
It opened at 936.08 and closed at 908.77, dropping 27 bucks in a single candle.
05:00: 906, 06:00: 899, 08:00: 893.
At 09:00, it hit 888.16, with volume down to just 76,000.
From 09:00 to 13:00, it took four candles just to climb back to 910.18.
It took one candle to dump, but four to recover—a fourfold difference in efficiency.
Now $MU 907.18, with MA20 at 923.20, still weighing on it by 16 bucks.
The 24-hour range is 972.12 to 888.16, a 9% swing.
It's 2 a.m. ET in Beijing right now, and the U.S. stock market is
post-image
MU-0.63%
[ NEW MARKET UPDATE]
live-cover
LIVE1,885
In 6 hours, 8 liquidations, and only $1.5 left in the account—that’s no joke, it’s Machi Big Brother’s actual track record. All his positions were wiped out, and the balance couldn’t even buy a cup of milk tea. Honestly, I froze for several seconds when I saw that number.
What does getting liquidated 8 times in a row mean? It’s not bad luck; he simply didn’t set a stop-loss. And he likely kept depositing and opening new trades, refusing to give up and trying to win it back, only to be knocked down every time by the downtrend. The market doesn’t care who you are or how much money used to be in
post-image
According to U.S. media reports, a banned AI ran on U.S. military networks for about two months before it was discovered. An Accenture contractor reportedly connected personal Claude Code to military systems, where the AI agent wrote and deployed code and allegedly sent credentials, passwords, and network architecture information to a third-party website that NIST had flagged as high risk.
Reportedly, it ran on Defense Department networks for two months despite being banned; an employee wanted AI to automate tasks but also handed over administrator privileges—the more convenient the tool, the
post-image
ACN+1.35%
BTC-0.67%
Intel beat earnings expectations but shares were hammered! What is really keeping Wall Street up at night is a $20 billion-a-year spending plan?
Intel’s problem this time isn’t poor results, but cash-flow anxiety.
Third-quarter results were indeed strong, with revenue up 21% year over year and adjusted earnings per share beating expectations. But what investors are really worried about is the costly, long-term investment the company is making to expand its chip manufacturing capacity.
Intel plans to spend about $20 billion on capital expenditures this year, but management says it won’t achieve
INTC-3.60%
  • 31
btc breaks below $75k btc hits a six weeek low as etf falls to a two month low how much longer will
live-cover
LIVE2,358
$BTC
Strategy’s Bitcoin money printer is about to start up again
STRC hits $99.95 for the first time in 165 days
Damn
Guys
There’s one number from Strategy this time that’s especially worth watching
$99.95
October 29
STRC, Strategy’s perpetual preferred stock, briefly rose to $99.95
The first time it has returned to this level in 165 days
Just 5 cents below its $100 par value
Don’t be fooled by how small that gap is
For Strategy
It means quite a lot
First, to explain
STRC is not ordinary MSTR stock
Nor is it a spot BTC ETF
It is a floating-dividend perpetual preferred stock issued by Strategy
post-image
BTC-0.65%
Load More

Join 40 M users in our growing community

⚡️ Join 40 M users in the crypto craze discussion

💬 Engage with your favorite top creators

👍 See what interests you

Trending Topics

BTCDropsToward77000

61.01k Views39.19k Discussing

$BTC briefly fell below $77,000 and remains under pressure around the $77K zone, with its 24-hour decline still above 4%. With risk appetite weakening and Fed uncertainty rising, where is the next key support after losing $80K?

IntelBeatsEarningsButStockPlunges

3.68k Views581 Discussing

StrategySTRCNears100ParValue

4.72k Views3.97k Discussing

View More