Square
Following
Hot
News
Profile
Share your thoughts
placeholder
Article
BTC MARKET UPDATES
live-cover
LIVE1,702
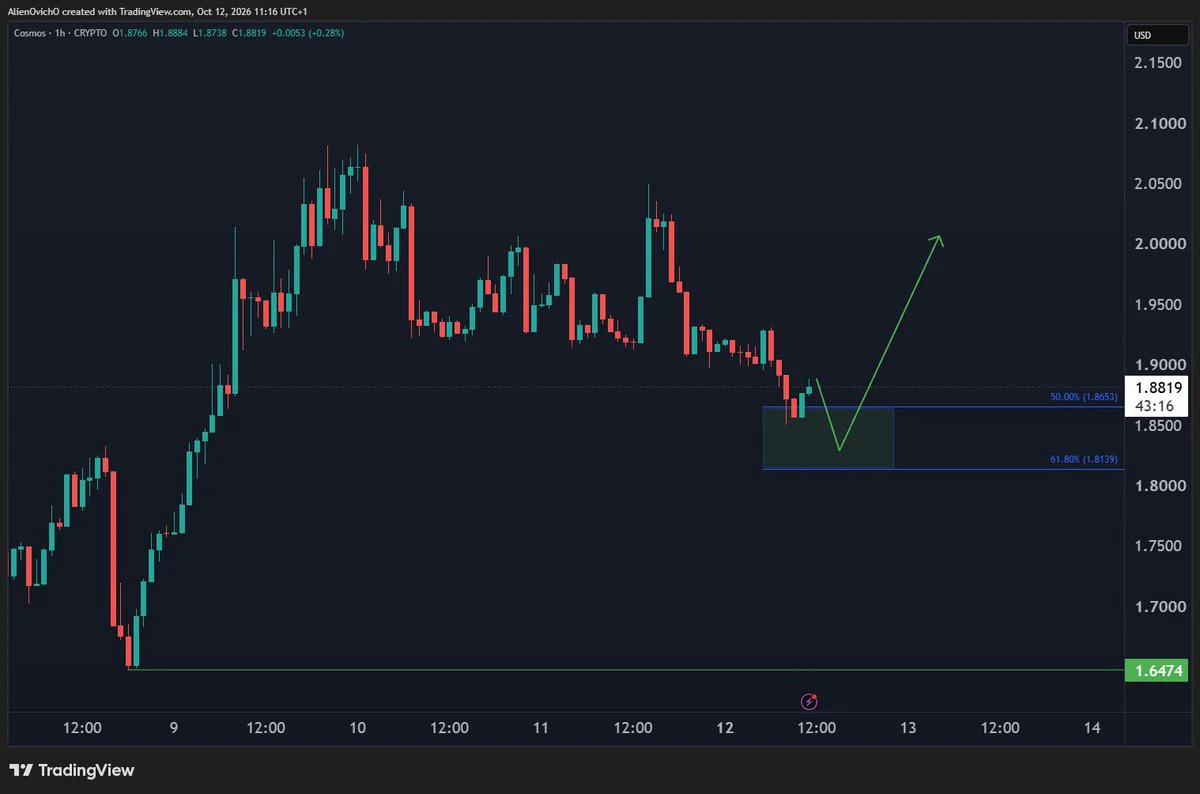
#COSMOS cosmos:native is ending a 3 waves pullback into the buying zone 1.86 - $1.81.
Bulls are getting ready to resume the rally looking for new highs with next target at 2.15.
post-image
ATOM-1.66%
BIG week for Bitcoin
Here's what could move crypto this week:
Tue: JPMorgan, Goldman, Citi and Wells Fargo kick off bank earnings
Wed: US CPI
Thu: PPI, retail sales, and jobless claims + Fed Chair Kevin Warsh speaks at the IMF
Fri: MSCI ruling that could EXCLUDE Strategy and Metaplanet from its indices + $1.28B $BTC options expiry
What it means:
Hot CPI/PPI: December rate HIKE bets firm up, and BTC could fall below $83K
Soft data: hike odds fade, giving BTC room for relief & reclaim $86K
Warsh: his last big remarks before the Oct Fed meeting. Any hawkish signal locks in the hike narrative
post-image
BTC+0.60%
MSTR+0.94%
Korean stocks suddenly plunge, with Samsung and SK hynix leading the decline: Is buying the dip now a bargain or catching a falling knife?
Korean stocks fell sharply, with Samsung Electronics and SK hynix both under pressure, dragging down market sentiment as well. For investors, the most difficult question is here: Is this simply a normal pullback during an uptrend, or a signal that the market is weakening? The more practical question is whether buying the dip now can actually uncover an opportunity.
My view is to remain cautious in the short term, focus on the underlying logic over the mediu
MU-0.69%
  • 2
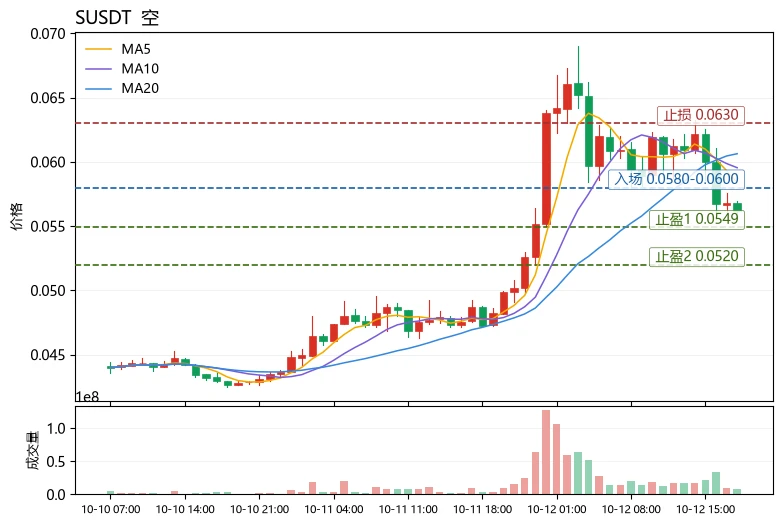
$S Current price is 0.05614, up 17.52% over 24h, with a trading volume of 46.9M USDT, but the moving averages remain bearishly aligned: MA5=0.05836 is below MA20=0.06063, the MACD histogram at -0.001081 has not turned positive, and RSI is only 47.3. This is a typical “price rebound, indicators not yet recovered” structure, with the risk of chasing higher outweighing the opportunity.
Here is a reusable method: to determine whether a rebound is healthy, look at three points—whether the price can rise above MA5, whether MA5 can cross above MA20, and whether the MACD histogram continues to narrow
post-image
RLC-8.89%
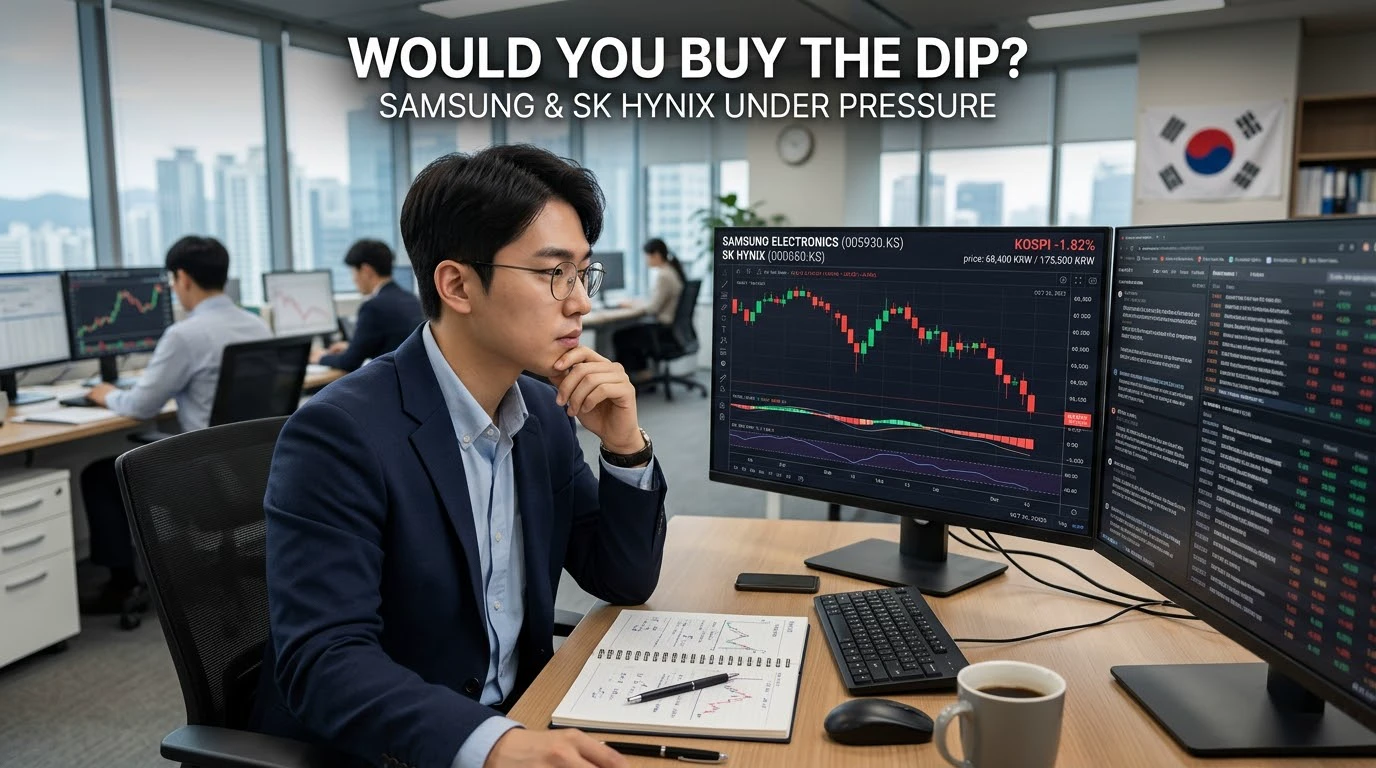
Would You Buy the Dip in Korean Stocks? 🇰🇷
Samsung and SK Hynix have come under selling pressure, raising an important question: is this a buying opportunity or a sign of more downside ahead?
A price drop alone doesn't make a stock a good investment. I would look at the reasons behind the decline, company fundamentals, market sentiment, and whether the price reflects the risks.
For me, patience and research matter more than rushing into a dip. Sometimes a correction creates an opportunity, but sometimes waiting for more clarity is the smarter approach.
What do you think? Would you buy the di
post-image
SK Hynix-4.52%
🚨 BIG NEWS 🚨
Coinbase CEO Brian Armstrong backs the SEC’s push to open private markets to more Americans.
His vision? Let people qualify through merit, skills, and financial expertise — not just wealth.
post-image
COIN+4.30%
$CL (Crude Oil) Reverses Hard From the Spike High Breakdown Short
Pair: $CL /USDT
Direction: SHORT
Entry Zone: 89.84 – 90.04
Take Profit:
- TP1: 89.22 0.80%
- TP2: 88.74 1.33%
- TP3: 88.03 2.12%
Stop Loss: 90.90
Chart Structure:
- CL had been range-bound for days between ~89-91, then broke out sharply to a spike high near 92 but that breakout failed almost immediately, with a large red candle slicing straight back through MA25 and the Bollinger midline
- Price is now trading below MA25 (90.94) with the band structure rolling over, confirming the spike was a failed breakout / blow-off to
CL+0.68%
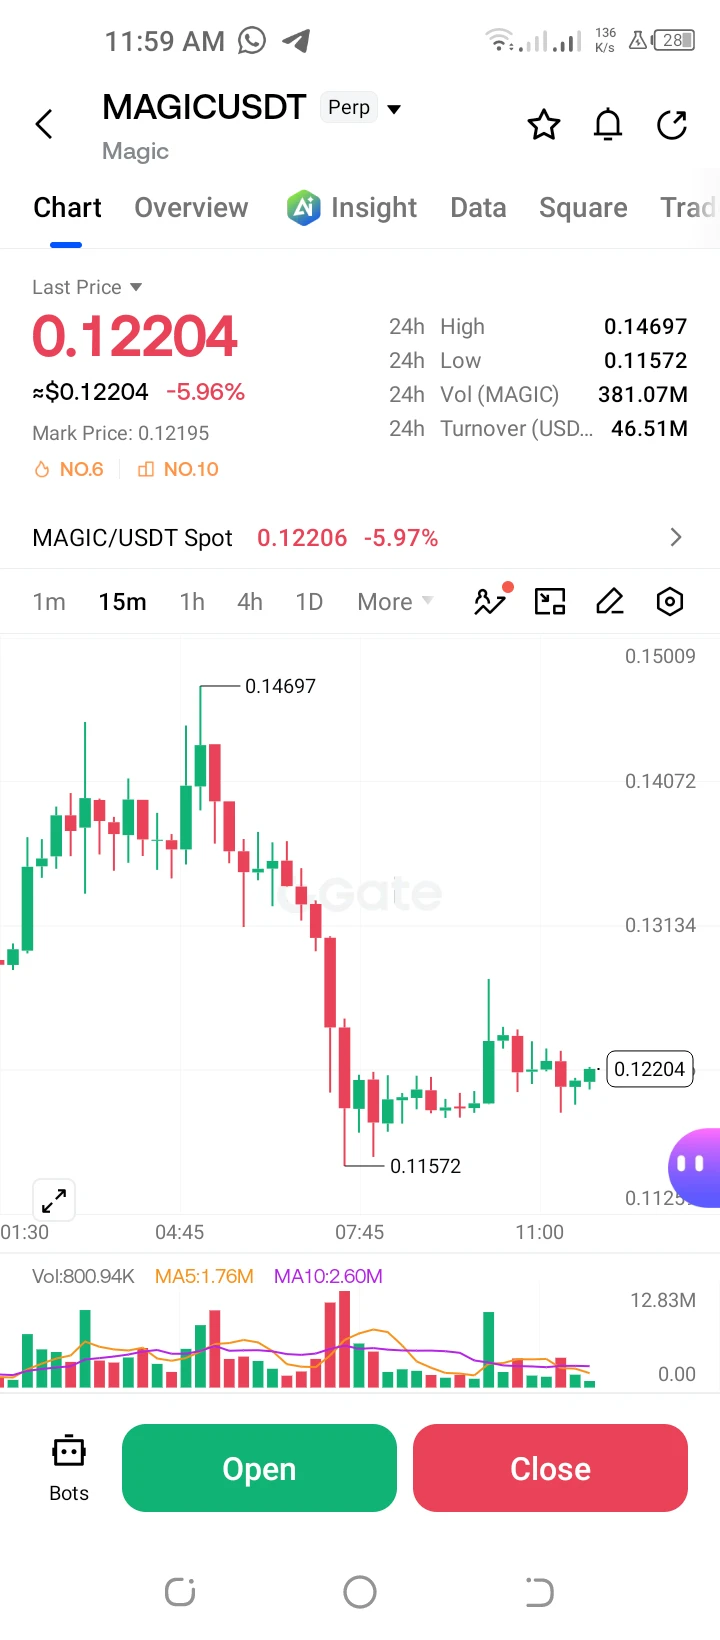
**$MAGIC /USDT Perp – "Sharp Rejection – Short"**
Trading Plan Short $MAGIC
Entry: 0.12600
SL: 0.13134
TP1: 0.11572
TP2: 0.11250
MAGIC is down -5.96% after a sharp rejection from the 0.14697 high. MACD is negative; targeting the 0.11572 low.
post-image
MAGIC+0.91%
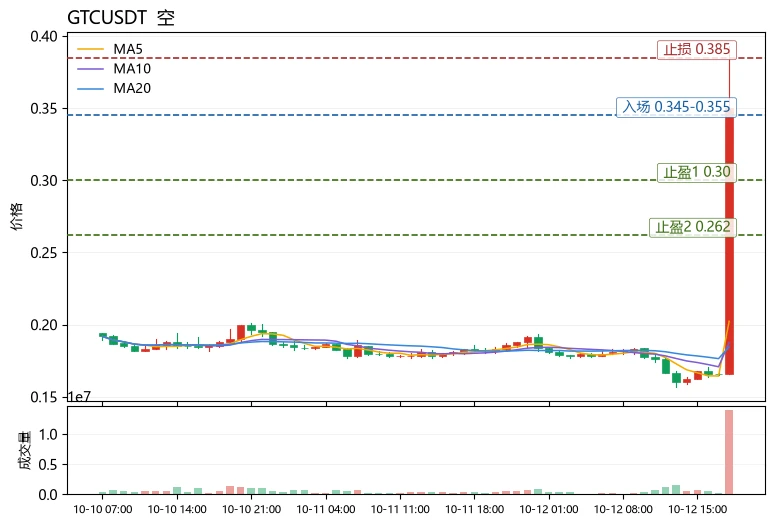
$GTC Current price is 0.34961. The first resistance above is the extension level at 0.38 after breaking through the upper Bollinger Band at 0.262125; the first support below is the previous-high-turned-support level at 0.30, with MA5 at 0.2023 as the next level if it breaks.
The price surged 89.62% in 24h, with RSI as high as 89.4, indicating severe overbought conditions; the price is already far above the upper Bollinger Band at 0.262125, representing a typical spike-like rally. The funding rate is -0.4995%, with shorts being squeezed on a large scale, but the negative rate also means that t
post-image
RENDER+11.22%
📊 Crypto Daily | October 12 Evening: BTC Breaks Above $84k in the Afternoon! Deep V-Shaped Oil Rally Ignites the Market

Guys, the afternoon action is here! BTC broke above $84k (high of 84,352, currently around 83,500, 24h +0.5%), while ETH and SOL followed across the board with gains of 2%+. The trigger was straightforward: international oil prices staged a deep V-shaped rally, with Brent crude breaking above $104, risk appetite recovered, and crypto followed along for the ride.

Market status:

1. Post-leverage-cleansing recovery: OI fell to a yearly low of 625k BTC, selling pressure ha
post-image
BTC+0.62%
ETH+2.34%
SOL+2.14%
  • 1
After Korean stocks plunged, I choose to watch rather than buy first: Bottom-fishing is not about having more courage, but whether the conditions are right
Samsung Electronics and SK hynix led the decline, sending Korean stocks sharply lower, while investors’ emotions felt like riding a roller coaster without a seat belt. Some believe a major plunge creates a golden opportunity, while others worry the market has not yet bottomed. Both views have merit, but I care more about one question: Do we have sufficient grounds to determine whether this correction is nearing its end?
My strategy leans to
NVDA-0.52%
  • 2
$QQQ /USDT REJECTING MOVING AVERAGE RESISTANCE ARE BEARS TARGETING $750.19 NEXT?
Pair: $QQQ /USDT
Direction: SHORT
Entry Price: 754.46
Target Levels (Take Profit)
TP 1: 752.86 0.21%
TP 2: 751.79 0.35%
TP 3: 750.19 0.57%
Stop Loss
SL: 756.59
Technical Breakdown
QQQ ($754.49) staged a tight range consolidation following a pullback from local highs, printing consecutive small candles that struggle to reclaim overhead resistance near $755.00–$756.00. This price action confirms persistent seller defense and sets up a clean breakdown expansion toward TP 3.
Price action is capped directly belo
QQQ-0.05%
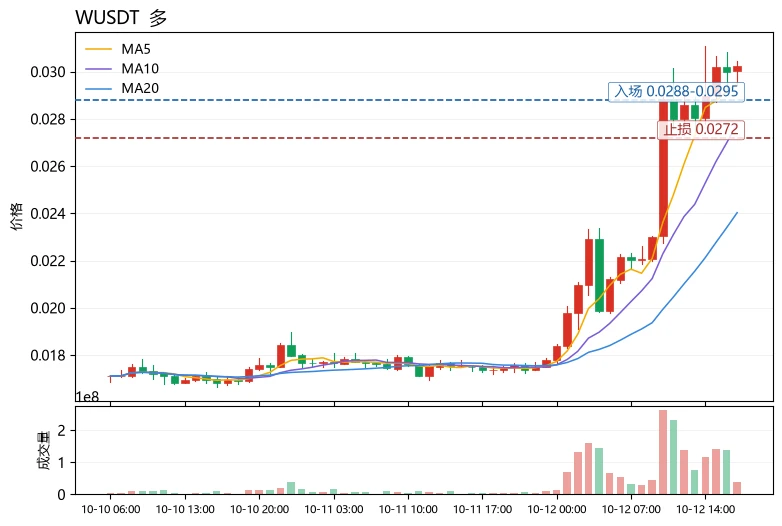
$W has already risen 73%; is chasing a long position now just providing exit liquidity? The answer is: not blindly chasing, but waiting for a pullback confirmation—the technical structure remains bullish, but the short term is overheated, so only buy dips, not highs.
First, the structure. $W is currently at 0.03027, with MA5=0.029488 clearly above MA20=0.0240255. The moving averages are bullishly aligned and diverging, so the medium-term trend remains intact. However, RSI=78.2 has entered the overbought zone. Although the MACD histogram at +0.0006301 remains bullish, its slope has begun to s
post-image
AERO-5.65%
$HYPE — nice bounce forming, but $80 probably gets tested again 🎯
If longs were taken on the earlier dips, stop should already be at breakeven. No reason to risk giving back a clean entry.
Price is moving inside an ascending channel, and it's starting to look like a breakdown out of it could happen if the broader market keeps sliding. For that scenario, watching $70 as the level to catch it. From there, building new longs and adding to spot as well.
Same thesis as always with this one, still believe in the project long term, still buying every meaningful dip rather than chasing green candles
post-image
HYPE+2.23%
HYPE+2.19%
BTC+0.60%
Btc market
live-cover
LIVE1,375
$FIL Pulls Back After a Parabolic Spike Early Short, Momentum Not Yet Confirmed
Pair: $FIL /USDT
Direction: SHORT
Entry Zone: 1.2269
Take Profit:
- TP1: 1.1628 +5.2%
- TP2: 1.12 +8.7%
- TP3: 1.0559 +13.9%
Stop Loss: 1.3124
Chart Structure:
- FIL exploded from ~1.10 to a high near 1.28 in a near-vertical move, then printed one large red candle pulling back to entry the first real sign of a reaction after the spike
- Price remains well above MA7, MA25, and MA99, all of which are still far below this is a pullback within an extreme move, not a breakdown of structure
- ⚠️ RSI(14) spiked
FIL+13.53%
I’ve been having fun in Chengdu these past two days and played League of Legends with friends all afternoon. I’ll start streaming at 9 p.m. tonight.
Is Bitcoin's movement leaving you confused?
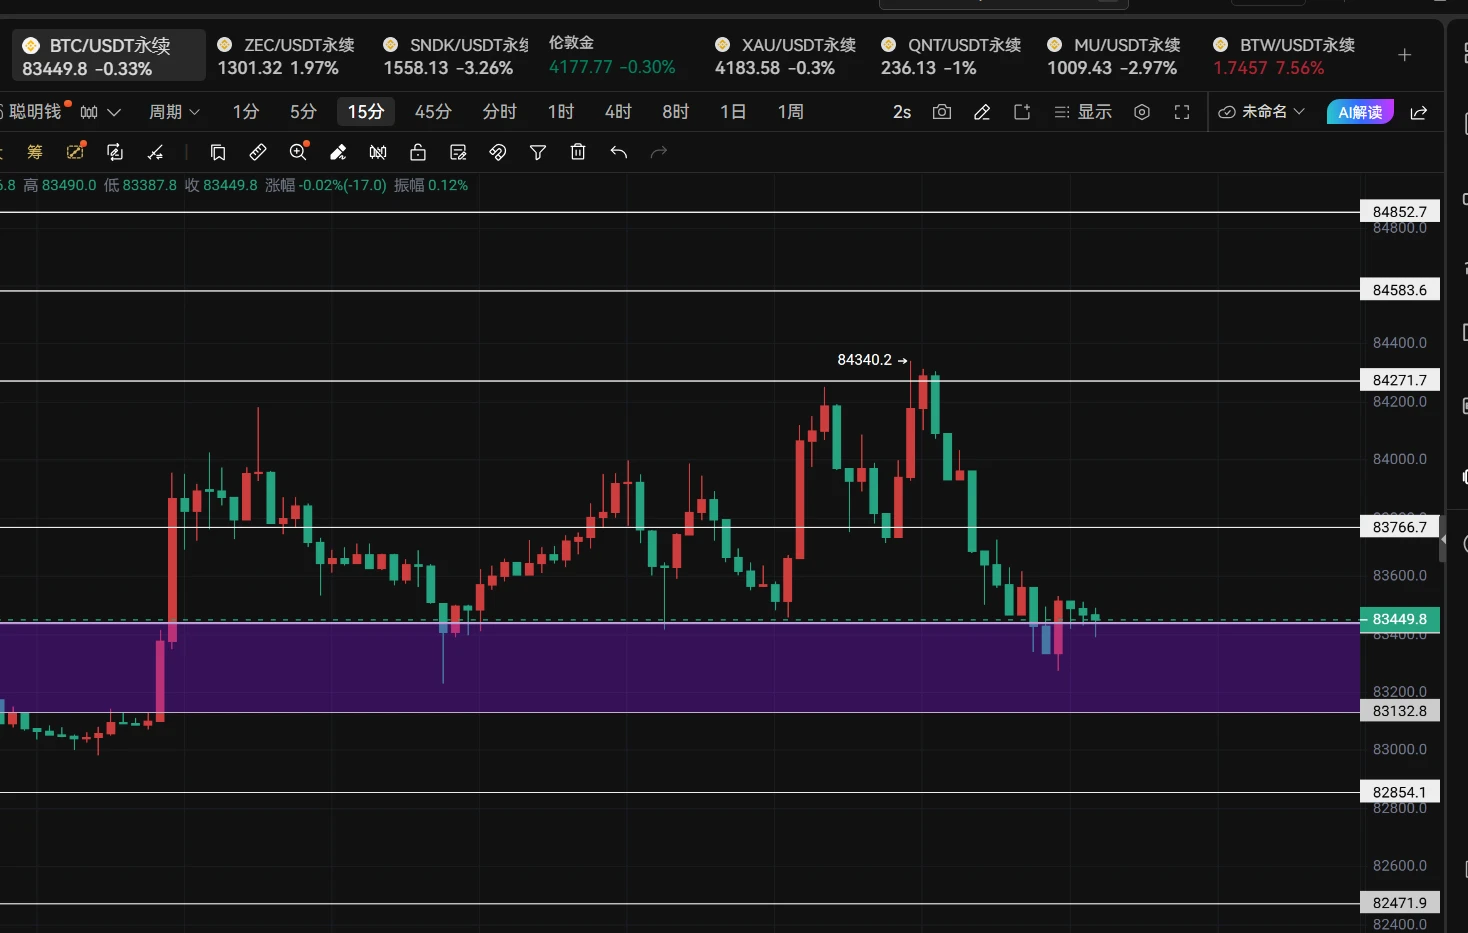
Let me give you a brief analysis, starting with the pullback to 80300! Remember, it was the pullback to 80300. When it was on the verge of starting with a 7, Bitcoin began to rebound, directly breaking through the key resistance zone in one move and trading above it. These past few days have also seen repeated moves, unable to rise or fall. Moreover, today saw a clear upward trend directly broken, with resistance encountered at 84271.
What we need to focus on now is where the pullback can stop the bleeding.
From the intraday movement, the structure h
post-image
BTC+0.62%
Load More

Join 40 M users in our growing community

⚡️ Join 40 M users in the crypto craze discussion

💬 Engage with your favorite top creators

👍 See what interests you

Trending Topics

GateWCTCS9GlobalTradingCompetition

35.05k Views5.32k Discussing

Gate WCTC S9 Global Trading Competition is officially live, crossing asset boundaries across crypto, stocks, and CFDs with an 8M USDT total prize pool. The Lucky Launchpad guarantees a win every time, new users get a 20 USDT futures voucher upon registration, and the Event Contract PK tournament features a prize pool of up to 400,000 USDT.[👉 Read announcement](https://www.gate.com/announcements/article/102133)

GateXRedBullWinsSingaporeGP

173.01k Views6.44k Discussing

WillYouBuyDipInKoreanStocks

61.44k Views1.78k Discussing

View More