






Square
Following
Hot
News
Notifications
Profile
Share your thoughts
placeholder
Article
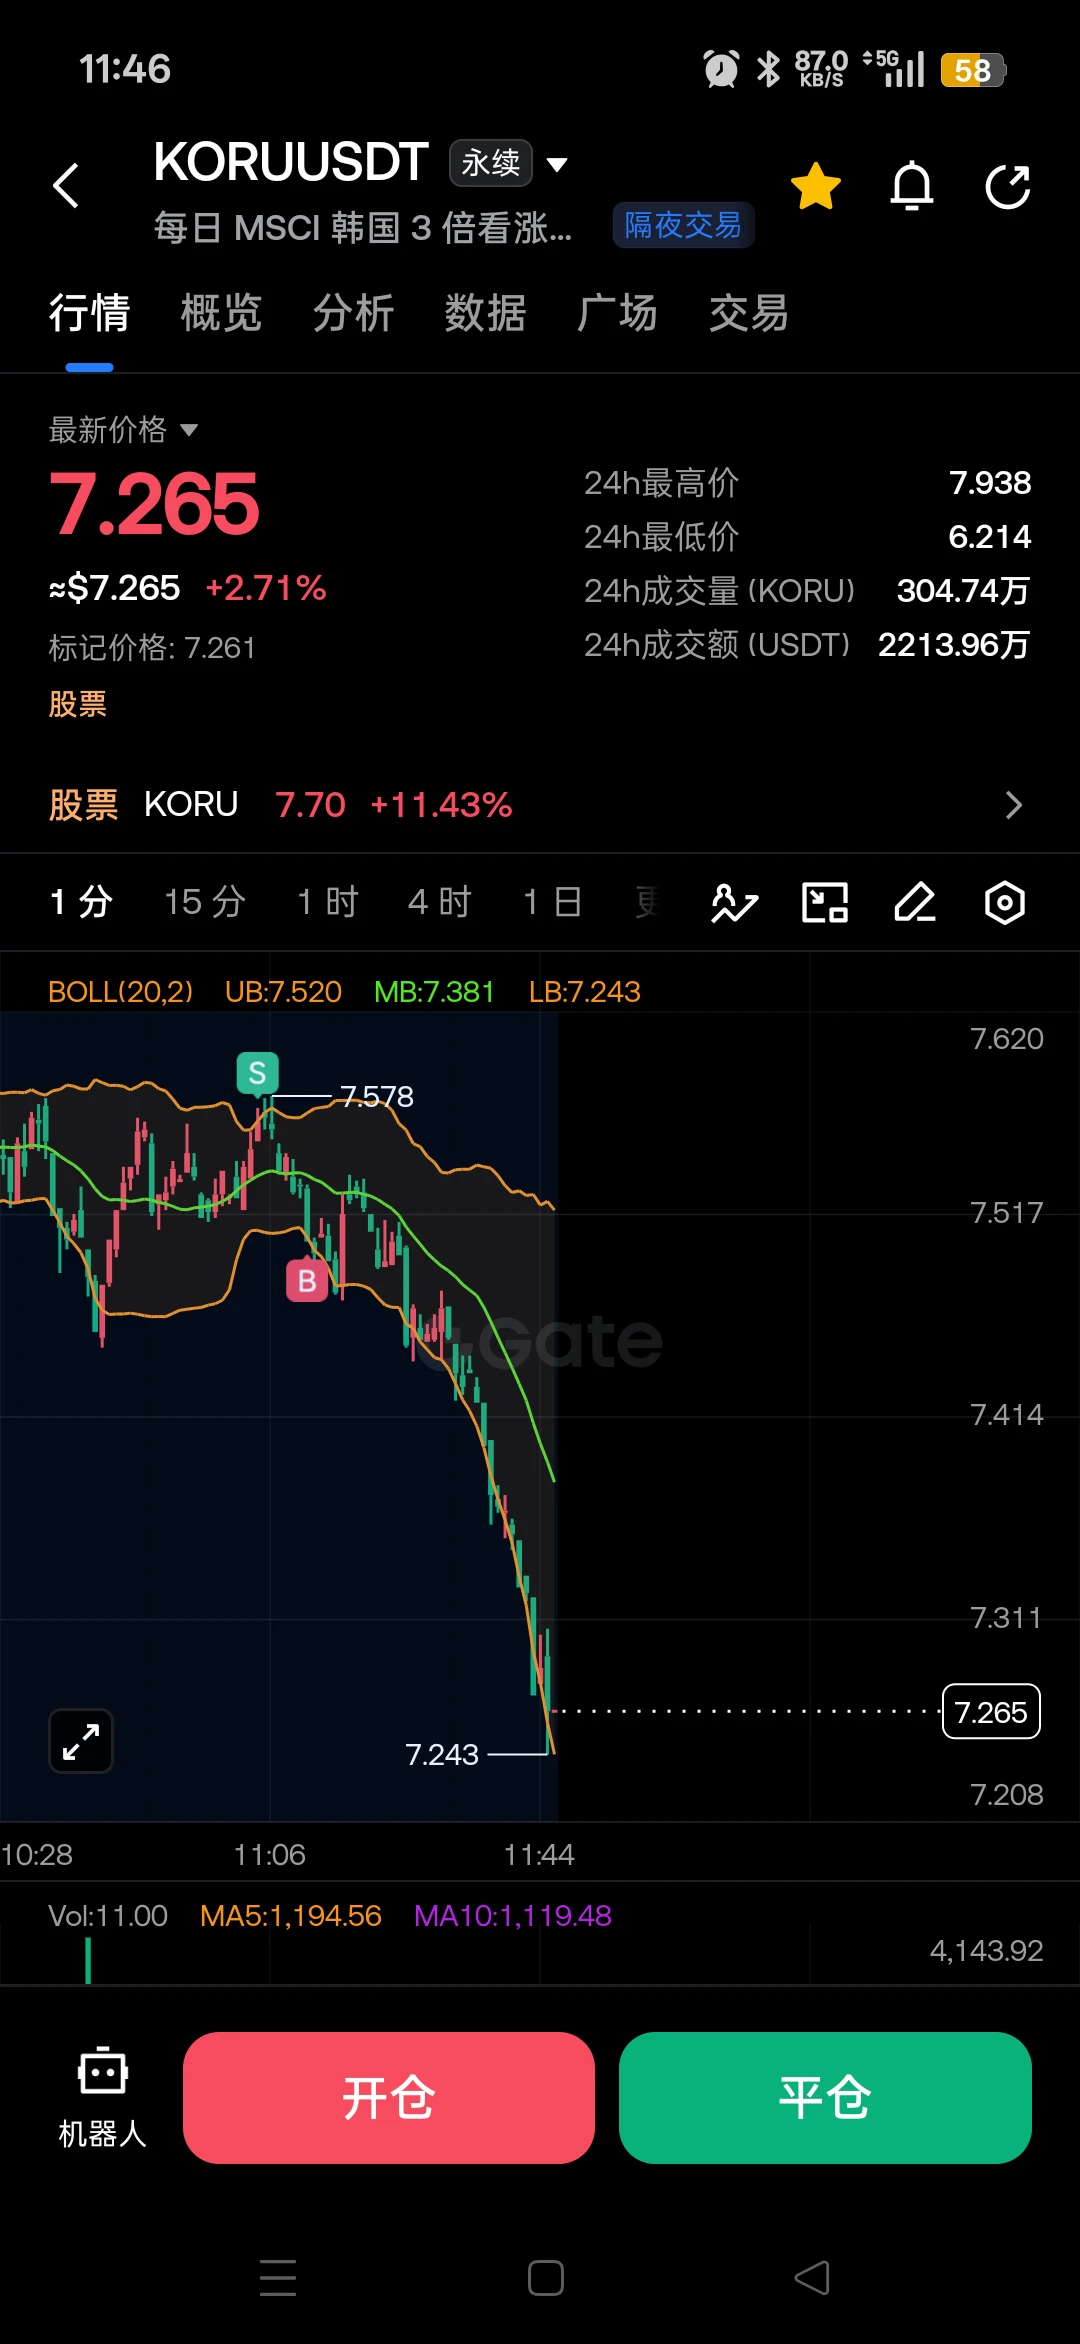
$KORU I sold too early; my mindset still isn't good enough. This stock is much more fun than altcoins—no random wicks, clear levels. Still need to work on my mindset.🤣
post-image
KORU-1.22%
  • 1
Trenches
牛逼
牛
bade
b
牛逼
0x96...7777
Market Cap
$.
Change
.
24h Vol
$.
Holders
.
PIEVERSE
P
bade
b
PIEVERSE
0x0e...25a9
Market Cap
$.
Change
.
24h Vol
$.
Holders
.
STONK
S
bade
b
STONK
6GmA...UNgx
Market Cap
$.
Change
.
24h Vol
$.
Holders
.
ON
O
bade
b
ON
0x0e...1d48
Market Cap
$.
Change
.
24h Vol
$.
Holders
.
FLOAT
F
bade
b
FLOAT
Bv1a...BMmr
Market Cap
$.
Change
.
24h Vol
$.
Holders
.
How much further can AVAX rise? A key question lies behind the positive news, and many investors may be overlooking it!

AVAX rose about 6.4% in a short time, and news that an NYSE-affiliated platform is adopting Avalanche technology certainly gave the market a boost.
But if you think this means all future transactions on the platform will use the AVAX token, you may be overlooking the most important detail.
The core of this partnership is Avalanche serving as the underlying ledger technology for a clearing organization, not official confirmation that all securities transactions must be settle
AMD+13.35%
  • 13
What Is the Bid-Ask Spread? Why Can a Wider Spread Mean Higher Hidden Costs for Frequent Trading?

In crypto trading, many people focus only on fees and overlook the gap between the buy and sell prices. Even if an exchange displays very low fees, a wide bid-ask spread can impose additional costs when traders enter and exit positions.

First, what is the bid-ask spread?

The bid-ask spread is the difference between the current best ask and best bid. For example, if a coin’s best bid is 99.9 USDT and its best ask is 100.1 USDT, the spread is 0.2 USDT. Relative to the midpoint of 100 USDT, the sp
post-image
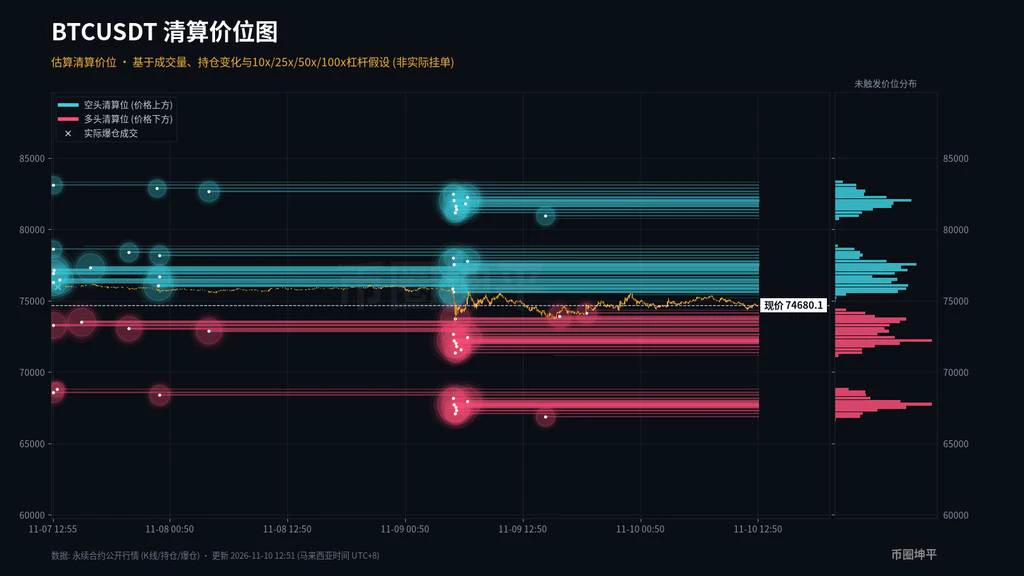
$BTC Still grinding below 75000, with several pushes higher getting stuck near 75400 before pulling back. The current price is around 74700, and today's low touched 73740. Estimated long liquidation levels are densely packed around 72000-73800 below. Above, 75800-78500 is the estimated short liquidation zone, with the largest cluster around 77500. If it can reclaim and hold 75800, I’ll be looking toward 77500; if it breaks below 73700, don’t rush to buy the dip. Which side are you leaning toward here? Share your thoughts.
post-image
BTC-0.67%
$EDGE Up 20% in a day, with 24h trading volume of $106 million—this isn’t small-time activity; real money is changing hands. I’m a live trader, so first, my position: current price 0.4037, my cost is around 0.36, unrealized gains are about 12%, and my position is 30%—not heavy, but comfortable.
Let’s start with the data. The 24h range is 0.3291 to 0.4472, with a swing of nearly 36%. That kind of volatility shows a major divide between bulls and bears, but the closing price is above 0.40, which shows buyers are stepping in on pullbacks. Volume of $106 million at this market cap level means turn
EDGE-7.65%
I announce that the plan to buy Ethereum in batches is steadily progressing in an orderly manner.
post-image
ETH-1.26%
First-round screenshots from Dabao's livestream
Jensen Huang
Guess what gift I'm giving you.
post-image
🚨 BREAKING: NVIDIA & CEO Jensen Huang SUED by shareholders
💼 Allegation: Concealing ties to Alice Huang (alleged Chinese intelligence asset at Megaspeed)
🔍 NVIDIA launches independent investigation
⚠️ Note: These are still allegations; awaiting the court’s ruling
#NVDA #NVIDIA #JensenHuang #StockNews
post-image
NVDA-4.34%
🔥 What are we discussing today? Gate Square trending topics have been updated!

🔹 #美国10月CPI即将公布
Will inflation continue to cool, or will it disrupt rate-cut expectations again?

🔹 #标普500创7个月最大涨幅
U.S. stocks have rebounded strongly. Is this a technical recovery, or are AI and tech stocks taking the lead again?

🔹 #美伊谈判出现新进展
Geopolitical tensions are showing signs of easing, crude oil is retreating, and risk assets are rebounding. How long can this last?

Quality content can receive traffic support + featured recommendations.

💰 Have an opinion? Come join the discussion:
https://www.gate
GateSquare
🔥 What are we discussing today? Gate Square trending topics have been updated!

🔹 #美国10月CPI即将公布
Will inflation continue to cool, or will it disrupt rate-cut expectations again?

🔹 #标普500创7个月最大涨幅
U.S. stocks have rebounded strongly. Is this a technical recovery, or are AI and tech stocks taking the lead again?

🔹 #美伊谈判出现新进展
Geopolitical tensions are showing signs of easing, crude oil is retreating, and risk assets are rebounding. How long can this last?

Quality content can receive traffic support + featured recommendations.

💰 Have an opinion? Come join the discussion:
https://www.gate.com/post/topic

repost-content-media
SPYX+0.01%
What Is Slippage? Why Might the Stop-Loss Price Differ from the Actual Execution Price?

In cryptocurrency trading, many people believe that setting a stop-loss will keep losses within a predetermined range. But in real markets, the stop-loss trigger price may differ from the final execution price. This difference is called slippage.

First, what is slippage?

Slippage is the difference between the expected execution price and the actual execution price. For a buy order, an actual execution price higher than expected may result in unfavorable slippage; for a sell order, an actual execution pri
🔥 What’s worth talking about today? Gate Square trending topics are live!

🔹 #USOctoberCPIComingSoon
Will inflation keep cooling, or shake up rate-cut expectations again?

🔹 #SP500PostsBiggestGainIn7Months
U.S. stocks rebounded sharply. Is this just a technical bounce, or are AI and tech stocks taking the lead again?

🔹 #USIranTalksShowNewProgress
Geopolitical tensions are easing, oil is falling and risk assets are rebounding. Can the move continue?

Quality content can get traffic support + Featured placement.

💰 Got a view? Share it:
https://www.gate.com/post/topic

post-image
  • 3
  • 2
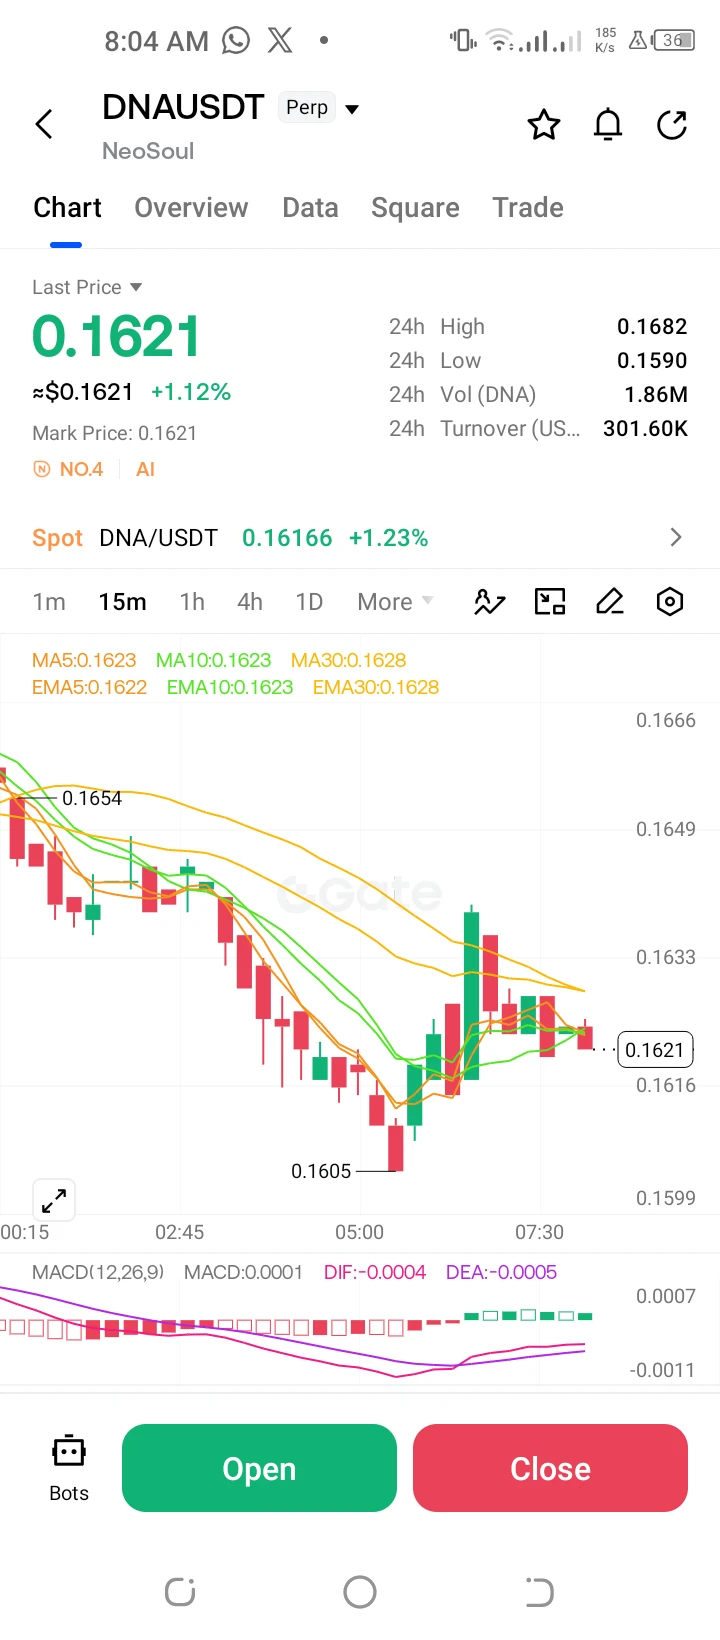
**$DNA /USDT Perp – "Bottom Reversal – Long"**
Trading Plan Long $DNA
Entry: 0.1621
SL: 0.1599
TP1: 0.1633
TP2: 0.1654
DNA is up +1.12% and recovering from the 0.1605 low. MACD histogram is turning positive; targeting the 0.1633 MA resistance.
post-image
DNA-3.48%
8848 diamond-encrusted phone
post-image
New streamer bts market
live-cover
LIVE1,091
AKE, which staged a violent rebound a few days ago, is now the top loser. I warned back then not to FOMO-buy volatile coins at their highs while they were in a choppy distribution phase. AKE and BTW are already yesterday’s news; now it’s PIEVERSE’s world. $PIEVERSE $AKE $BTW
post-image
PIEVERSE+0.58%
AKE+6.07%
BTW-7.42%
  • 1
The three major U.S. stock indexes all rose last night, with the S&P 500 up 2.3%, the Nasdaq up 2.7%, and the Dow Jones up 2.2%. The S&P 500 also posted its strongest single-day performance in seven months. Based on their usual correlation, a rebound in risk appetite of this magnitude should have prompted some reaction from crypto, but in reality, $BTC is currently stuck around 74900, up just 1.5% from this cycle's low; Ethereum, meanwhile, is hovering around 2120 and is actually down 1.3% on the day. Traditional and crypto markets are clearly going their separate ways this time.

First, let'
post-image
BTC-0.67%
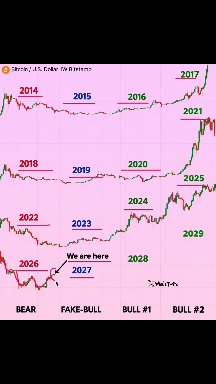
#BITCOIN'S 4-YEAR CYCLE IS BACK — IS 2027 THE TURNING POINT? 👀🔥
📊 LOOK AT THIS REPEATING PATTERN…
🔻 2014 → BEAR MARKET
🔄 2015 → RECOVERY
🐂 2016 → FIRST BULL PHASE
🚀 2017 → EXPLOSIVE RALLY
🔻 2018 → BEAR MARKET
🔄 2019 → RECOVERY
🐂 2020 → FIRST BULL PHASE
🚀 2021 → EXPLOSIVE RALLY
🔻 2022 → BEAR MARKET
🔄 2023 → RECOVERY
🐂 2024 → FIRST BULL PHASE
🏆 2025 → CYCLE TOP
🔻 2026 → BEAR MARKET?
🔄 2027 → RECOVERY?
🐂 2028 → FIRST BULL PHASE?
🚀 2029 → NEW CYCLE TOP?
⚠️ FOUR CYCLES. A SIMILAR FOUR-YEAR STRUCTURE.
🇺🇸 Here's the interesting part…
Every bear-market year shown here lines up wit
BTC-0.65%
Load More

Join 40 M users in our growing community

⚡️ Join 40 M users in the crypto craze discussion

💬 Engage with your favorite top creators

👍 See what interests you

Trending Topics

USCPIDataIncoming

49.63k Views2.2k Discussing

The U.S. October CPI report will be released on November 10 at 8:30 a.m. ET. September CPI came in at 3.7% year over year, and markets will be watching closely for signs that inflation is cooling, especially in core CPI. A softer-than-expected reading could strengthen rate-cut expectations, while hotter inflation may pressure risk assets through higher Treasury yields and a stronger dollar. How do you think this CPI print will move $BTC, U.S. stocks and gold?

USIranTalksShowNewProgress

6.14k Views1.24k Discussing

KoreanStocksJumpOver5%

1.69k Views4.83k Discussing

View More