Square
Following
Hot
News
Notifications
Profile
Share your thoughts
placeholder
Article
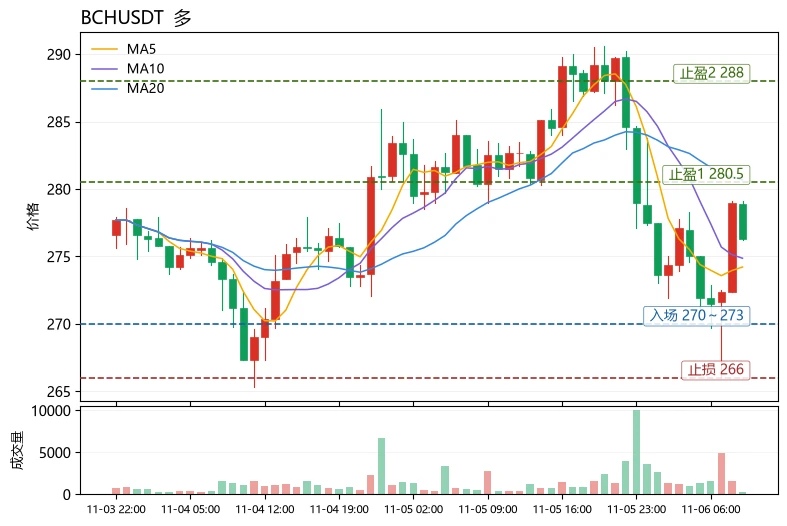
$BCH is currently in a weak consolidation phase, which does not yet constitute a healthy trend. In the short term, focus on buying dips near the range lows and exiting quickly; avoid chasing longs.
First, the method: To judge whether a trend is healthy, look at two things. First, the moving average alignment: the relationship between MA5 and MA20 determines the direction of short-term momentum. Second, price’s position within the Bollinger Bands combined with RSI: if price is near the lower band while RSI remains above 30, it is usually a low-volume pullback rather than a trend breakdown. BCH
post-image
BCH+1.05%
XTZ-2.61%
ENA+8.04%
Liquid Network Restores Full Bitcoin Backing After $320M Exploit
The Liquid Federation says the Liquid Network’s Bitcoin reserves have been fully restored, reestablishing 1:1 backing for all LBTC. This comes two months after self-described white-hat hackers drained most of those reserves.
The federation announced on Monday that it had reestablished 1:1 Bitcoin backing for all LBTC, the token representing Bitcoin on Liquid. The milestone follows the restoration of BTC-to-LBTC swaps at a 1:1 rate through participating providers, which the federation said had been completed several weeks ago.
⚠️
post-image
BTC-0.67%
Trenches
fxUSD
f
bade
b
fxUSD
0x08...d8f6
Market Cap
$.
Change
.
24h Vol
$.
Holders
.
ZIG
Z
bade
b
ZIG
0x8c...1145
Market Cap
$.
Change
.
24h Vol
$.
Holders
.
BTC
B
bade
b
BTC
C5xp...pump
Market Cap
$.
Change
.
24h Vol
$.
Holders
.
CORLA
C
bade
b
CORLA
0xba...7777
Market Cap
$.
Change
.
24h Vol
$.
Holders
.
STONK
S
bade
b
STONK
6GmA...UNgx
Market Cap
$.
Change
.
24h Vol
$.
Holders
.
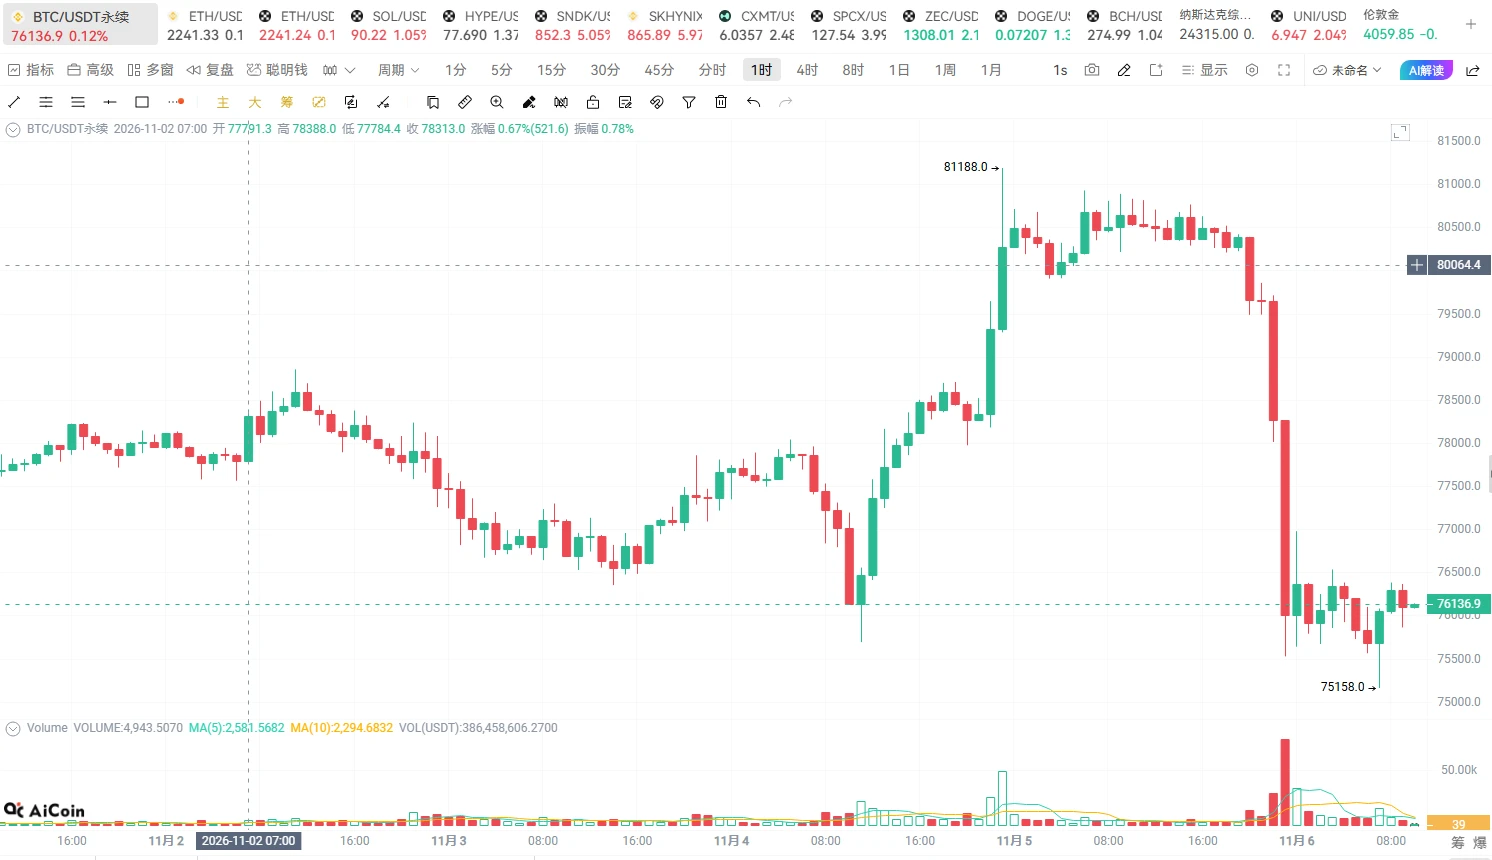
BTC | November 6: Today’s strategy

Focus on shorting rebounds today; for now, no longs.

Short at 76500–77000, stop-loss at 77400, target 75800–75200.

If the rebound is weak and price faces resistance near 76500, shorts can also be entered in batches.

If 75150 breaks, look for 74700–74500.

Macro and rationale:

BTC fell rapidly from around 80500, touching a low of 75158. A clear short-term bearish structure has formed. The current consolidation near the lows does not mean the decline is over.

Global stock markets are also under pressure, and risk assets are broadly weak. For now, there is
post-image
BTC-0.65%
ETH-1.23%
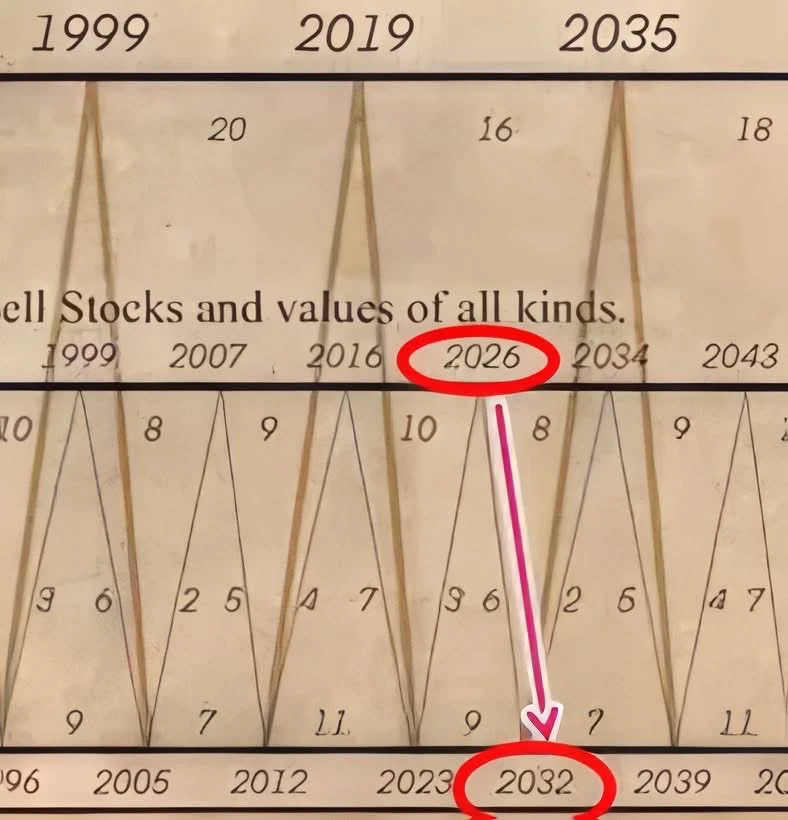
I originally thought this image was bullshit,
but now it seems like it might make a little sense.
But I still think this image is bullshit.
post-image
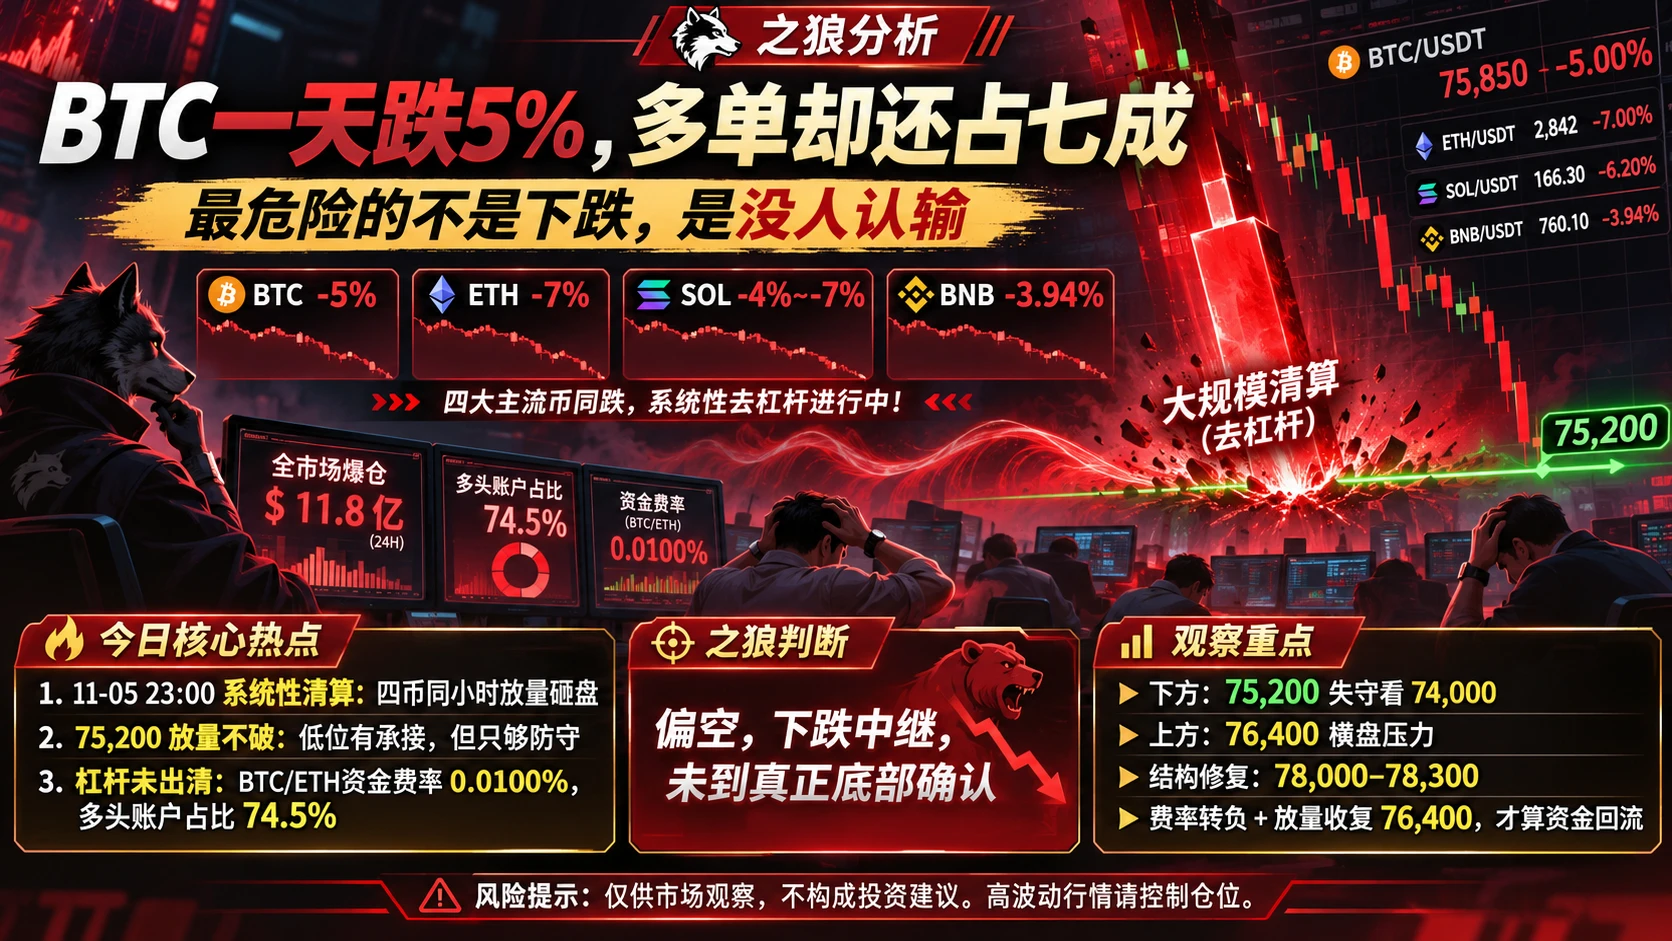
#BTC重返8万 BTC fell 5% in a day, yet longs still account for 70%—the most dangerous thing isn’t the drop, it’s that nobody is admitting defeat.
Market:

This is synchronized deleveraging, not structural divergence: four major coins fell in unison by 4%–7.4%. ETH led in both losses and volatility (9.5%), while defensive platform token BNB held up relatively well, closing at -3.94%.

The real turning point came at 11-05 23:00 (the U.S. stock market open), when BTC’s hourly trading volume surged to $513 million, about 10 times the usual level. ETH at $202 million, SOL at $48.6 million, and BNB at $
post-image
BTC-0.65%
ETH-1.23%
BNB-0.76%
SOL-0.74%
Right-side opportunities are rare—you may not see one even a few times in a week. You have to wait for a breakout before entering, and then use protection.

With left-side trades, you must never get greedy; they’re all short-term. But 80%-90% of the market is range-bound, so there are plenty of opportunities. As long as you maintain a certain win rate and identify the right entry points, you can still achieve great results through compounding.

In other words, capture opportunities on both higher and lower timeframes[阴险]
post-image
I just opened a quick short position on $CLANKER and am entering now at 19.00 or 19.50. First target: 18.50; second target: 18.00; third target: 17.50; final target: 17.00++; stop-loss above 20.50
post-image
CLANKER-1.33%
ADP: U.S. private-sector employment increased by 86k in October. U.S. stock market analysis: The election results are in—does the AI trade need to be recalculated? Last night wasn’t an ordinary sell-off; politics knocked the valuation anchor of the AI trade off course. The Dow closed at 51523, down 3.44%; the S&P 500 at 7353, down 4.36%; and the Nasdaq at 24315, down 5.52%, more than 10% below its October high and officially in a technical correction. The Nasdaq 100 lost $2.3 trillion to $2.4 trillion in market value in a single day, while the Philadelphia Semiconductor Index plunged 12.25%, i
post-image
KORU-1.22%
SOXL-1.16%
SKHYNIX+1.41%
The S&P 500 dropped 4.36% (roughly 4.4%) to close at 7,353.73, while the Nasdaq fell 5.5% during a sharp risk-off market session described by Michael Saylor as a rare 4-sigma (4σ) statistical event.‍
#ShareWeekly #USStocksFaceHistoricSelloff
post-image
SPX500+0.19%
Which signals indicate that BTC's upward momentum is weakening as it rises?

In crypto trading, many people see BTC continually making new highs and assume the uptrend remains strong. In reality, however, rising prices do not mean upward momentum is always strong. What really matters is whether the market forces behind the price are changing.

There are four signals worth watching closely.

First, trading volume keeps shrinking. If the price continues to rise while trading volume gradually declines, the buying pressure driving further gains may be weakening.

Second, the RSI shows bearish dive
post-image
BTC-0.67%
BTC PREDICTION MARKET UPDATE
live-cover
LIVE2,078
AI Bubble Bursting? Nasdaq Falls More Than 5% in a Day

The U.S. stock market is best at making you feel like an investing genius one day, then making you question your life choices the next.
On Thursday, the Nasdaq fell more than 5%, and the Philadelphia Semiconductor Index dropped more than 12%, as AI and chip stocks faced a brutal sell-off. In the face of such a sharp correction, one question quickly became the market’s focus: Is the AI bubble about to burst?
Don’t rush to conclusions.
The AI industry has not stopped developing just because stocks have fallen, and companies’ demand for comp
MU-17.23%
Last night's movements in tech stocks and gold
post-image
GLDX-0.40%
PAXG+0.37%
XAU+0.38%
1: Congratulations to the subscribers! Last night’s JCT spot trade gained up to 18%, from the tweet price to the first take-profit level.
Recap:
Yesterday’s JCTUSDT pickup code: tweet price 0.00379, short.
Best entry: 0.004-0.0044. While I was writing the tweet, the coin wicked upward, reaching a high of 0.00459. To be safe, I moved both the original best entry and stop loss up a little. In hindsight, the price action after the wick was still stable. Of course, if the best entry wasn’t reached, only the initial position entered at the current price remained.
Stop loss: 0.0045
First take-profit
BTC-0.67%
ETH-1.26%
XAU+0.38%
GT-2.41%
  • 9
  • 2
#SKHynixFallsNearly7% #SKHynix SK Hynix Falls Nearly 7%: Technical Breakdown of the Memory Leader

SK Hynix closed at 1,418,000 won on 30 October 2026, down 7.08% on the day, after losing the 1,500,000 won handle. The drop was sharp, but it was not random. It came after an extended rally, a wave of disappointing US tech earnings, and renewed doubts about whether heavy AI spending will earn a return. The chart tells the story of a stock that ran too far, too fast, and then reversed through a psychological level.

What happened on the day

The Bloomberg Asia Chip Stocks Index fell more than 4.5%
A crypto veteran is here to cheer on the AI bulls 😂
post-image
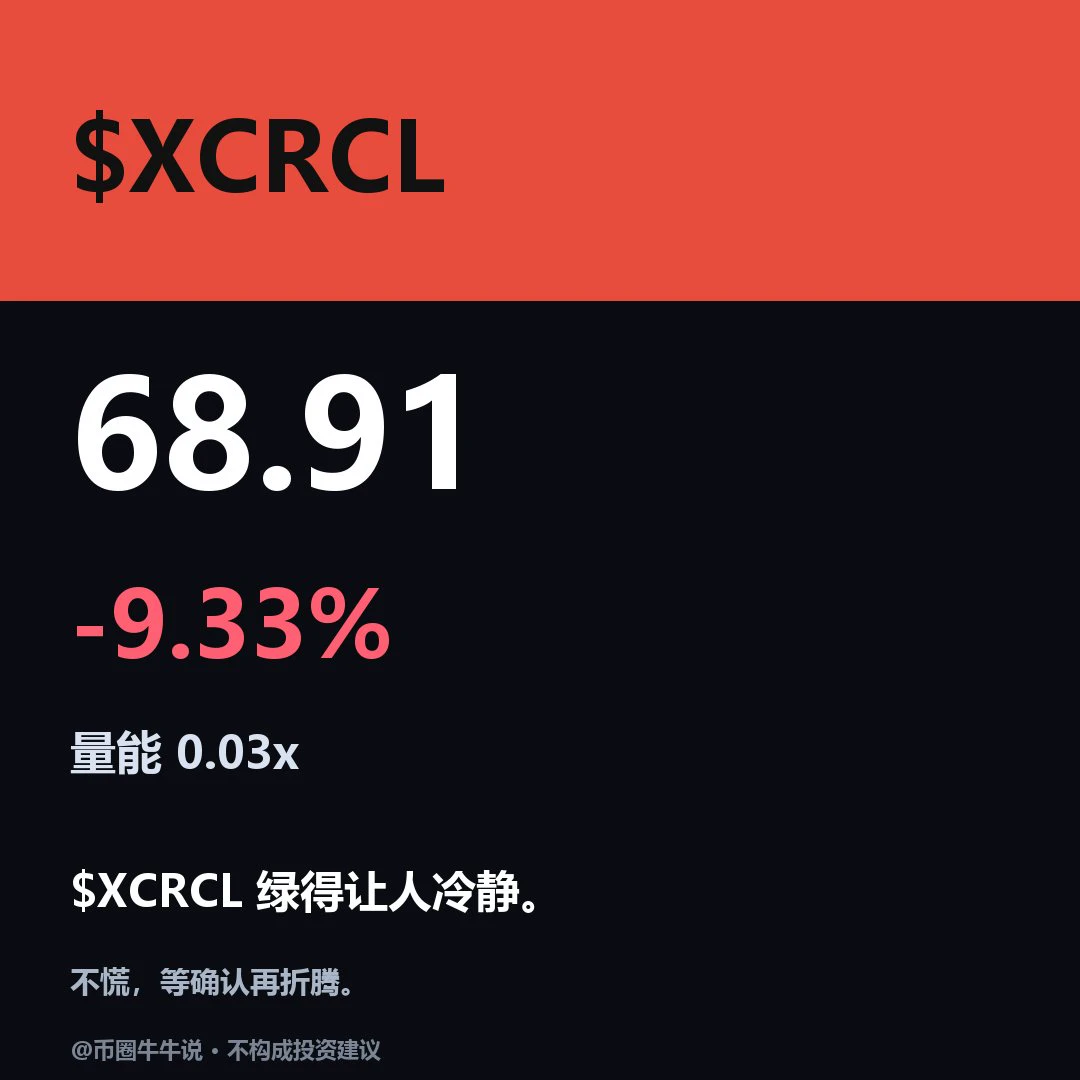
$XCRCL Currently at 68.91, down 9.33% over 24H (65.34–76.50). Weak on the 1H: RSI 30.59, with price below EMA20 at 70.50; weak on the 4H: RSI 37.55, with price below EMA20 at 72.75. 1H volume ratio is 0.03. If price holds above the 76.5 resistance, watch for continuation; a break below the 65.34 support would weaken the short-term outlook. Follow up to check whether price can hold above 76.5 and recover after losing 65.34. Volume is only 0.03x the average, so a single break above a level still needs confirmation from participation; if price breaks below and fails to recover, the setup is inval
post-image
Are U.S. stocks doomed? Why did they fall so hard? Last night’s U.S. stock sell-off had the feel of a crash, with the Magnificent Seven losing $1.04 trillion in a single day. The irony is that just the day before, the Dow had surged 1,569 points to celebrate the election results. The market first celebrated the “removal of uncertainty,” then realized the uncertainty had simply shifted direction—from “who will govern” to “whether AI can keep burning through this much money.” Three factors converged: ① Democrats didn’t just win both chambers; they also won the Texas and Georgia gubernatorial rac
post-image
BTC-0.65%
NAS100-0.07%
ETH-1.23%
ADP+1.21%
Morning Market Update
live-cover
LIVE1,964
Down 5,000 right off the bat
post-image
Load More

Join 40 M users in our growing community

⚡️ Join 40 M users in the crypto craze discussion

💬 Engage with your favorite top creators

👍 See what interests you

Trending Topics

USStocksFaceHistoricSelloff

1 Views3.44k Discussing

U.S. stocks suffered a sharp selloff on Thursday, with the Nasdaq closing down more than 5% and the Philadelphia Semiconductor Index falling over 12%. AI and chip stocks including $NVDA and $AMD were hit especially hard. Markets are reassessing AI valuations, data-center spending and future returns. Is this just short-term deleveraging, or the start of a deeper correction in the AI trade? Which sectors are you watching next?

GateLaunchesPoSECProofOfSecurity

10.9k Views559 Discussing

USNonfarmPayrolls

8.57k Views3.96k Discussing

View More