Share your thoughts
placeholder
Article
BITCOIN ETF FLOWS, WEEKLY UPDATE 📊
The latest data shows a clear shift:
This Week (09/16):
🔴 -$586.27M net outflow
Recent Trend:
· Mid-August: Massive +$1.8B inflow week
· Late August: Two more positive weeks
· Early September: Flows turned negative
· This week: Deepening outflows
What it means:
Institutions are pulling back. The Fed's hawkish stance (rates at 3.75%-4.00%) and the 10-year Treasury near 5% are making risk assets less attractive.
The silver lining:
Bitcoin is holding above $75K despite the outflows. That shows underlying demand is still there.
But until ETF flows turn positive
post-image
BTC+5.35%
LUNC+3.34%
#BTC ve #While ETH was rising strongly,
$ZEC it showed weakness for the first time. I opened a solid short at $1469. I think the anticipated moment has arrived.
post-image
BTC+4.79%
ETH+4.72%
ZEC-2.09%
$SNDK Funds are still flowing in heavily. During this Shandi offensive, did you think back to those days when it surged from 1400 to above 1600? Back then, Meiqi also said Shandi was openly signaling its intent to trap a wave of short sellers. The scenario is exactly the same now, yet many people still opened short positions and got trapped or even liquidated.
Meiqi has already analyzed this coin’s trend clearly for you all: the market maker is blatantly signaling its intent to trap a large number of short sellers. #NEAR大涨超21%突破3美元
SNDK+7.81%
#美股AI概念股全线反弹 #Gate Plaza Mid-Autumn Reunion Gathering
I’ve always followed U.S. stocks but haven’t bought much, with most of my holdings in crypto. I came across the market moves last night: the Dow rose 0.61%, the S&P 500 gained 1.14%, and the Nasdaq climbed 1.69% to 26418.3 points, while the VIX Fear Index plunged 10.23%. The VIX’s decline caught my attention more than the indexes’ gains—the sudden drop in fear suggests the market isn’t cautiously testing the waters, but is once again willing to take on risk.
AI-related stocks performed even more dramatically. Tempus AI rose 14.85% in a sing
post-image
SPYX-0.39%
TEM-3.99%
SMCI-3.77%
ALAB+1.76%
#BOJHikesTo1.25%31YearHigh
I have been watching the BOJ setup closely because this is one of those macro events where the headline number may look simple, but the reaction underneath it can be much bigger.
The Bank of Japan is expected to raise its policy rate from 1.00% to 1.25% today, September 18, 2026. If delivered as expected, it would take Japanese rates to their highest level since 1995, roughly 31 years ago. More importantly, this would be another 25 basis-point move only three months after the previous hike in June. That makes the pace of tightening much faster than the BOJ’s earlier
post-image
#ArcEcosystemAndMemeCoinsPlunge
Arc’s first market test isn’t whether a token pumps. It’s whether the ecosystem can grow beyond the memes.
That is the angle I’m watching after Arc’s mainnet went live.
The first 24 hours have already shown something interesting about how a brand-new blockchain behaves. Trading attention rushed toward newly launched ecosystem tokens and meme markets, creating exactly the kind of fast rotation and extreme volatility we normally see when fresh liquidity meets a new narrative. One market report estimates that meme-coin launchpads accounted for roughly 82% of Arc’s
post-image
not sure BTC will break here or reject once more time but this could say as "weekend resistance"
post-image
Original content no longer visible
BTC+4.79%
$ZK easy 3-4x... probably more.
post-image
ZK+12.77%
A Meme token can fall while its underlying attention is rising.
It can also rise while liquidity underneath the move is getting weaker.
So what if the chart is telling only half of the story?
Price is the most visible part of crypto markets, but visibility does not equal information.
Imagine a Meme token suddenly gaining volume. The chart looks impressive, social mentions increase, and traders begin watching the breakout. The obvious conclusion is that momentum is strengthening.
But volume alone does not tell us who is trading, why they are trading, or whether the liquidity can absorb the next
post-image
ARC+0.85%
GT+6.08%
ETH+4.72%
  • 1
🔥Free strategy levels for Friday night👇
🔥Long entry levels (see the pinned subscription post for the second entry, short entry, and take-profit levels; long- and short-term spot setups are also in the pinned post)
===========
78550 long, 78250 long, Sun 76850
2520 long, 2500 long, loss 2450
#Gate股票永续合约覆盖数量行业第一
BTC Updatee
live-cover
LIVE1,695
ZEC | Bearish bias 🔴 | 15-minute trend pullback/continuation · Confidence: 90/100 Observation: 1448.85 / Invalidation: 1514.18 (4.51%) Targets: 1367.19 / 1318.19 / 1252.86 RSI14: 38.7 · ADX14: 33.6 · Volume: 1.36x If the 15-minute candle closes below this invalidation level, the setup is invalidated. For educational purposes only. Not financial advice. Leverage carries high risk. $ZE
post-image
ZEC-2.09%
Quadruple witching day has pushed the market straight into short-squeeze mode
BTC is up 5.4% over 24H; ETH is up 5.1%
SOL is even stronger! Up more than 10%
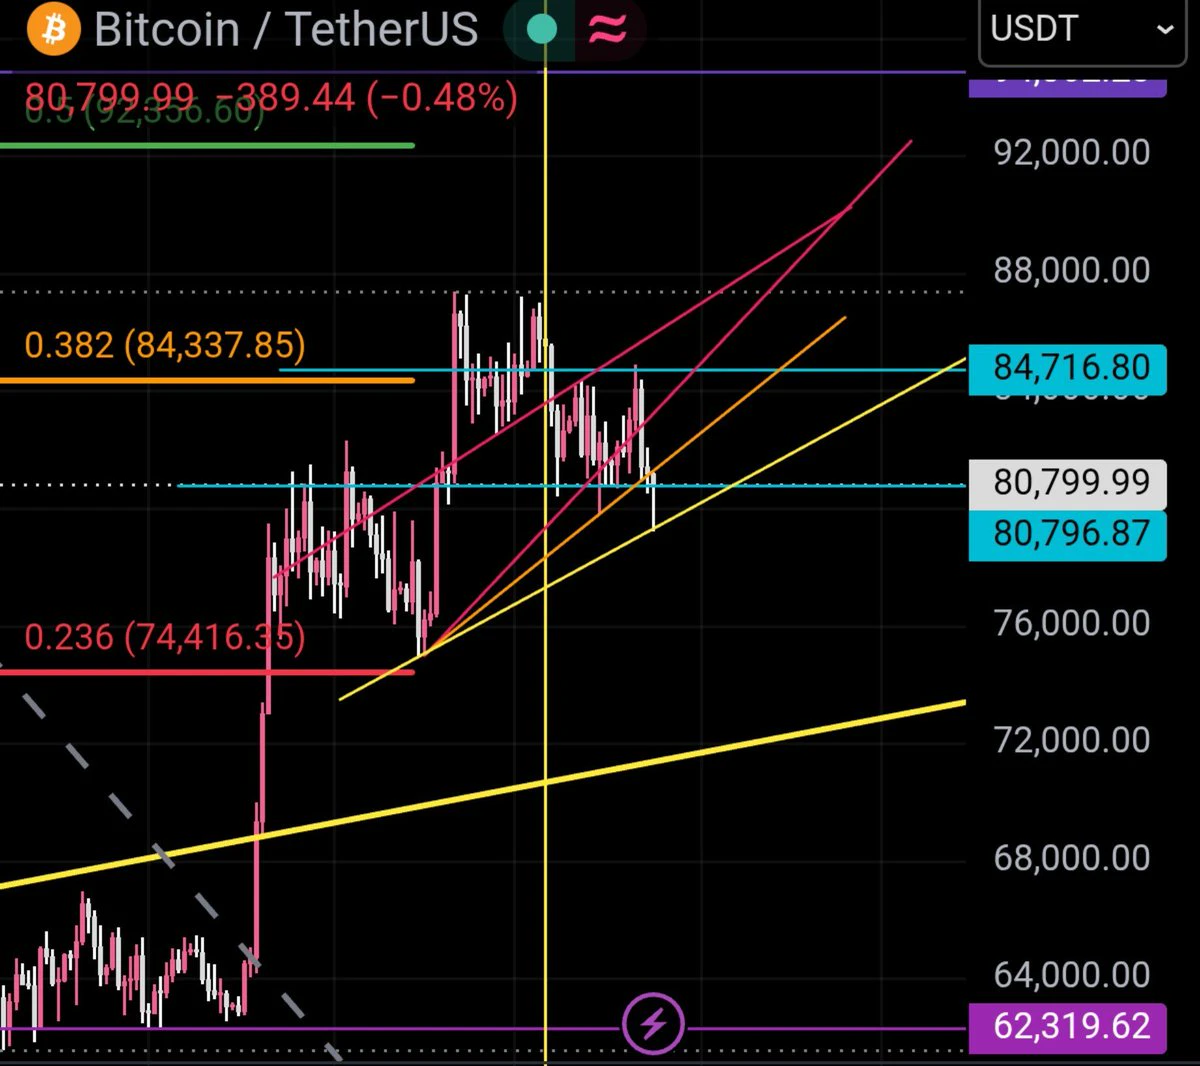
Now it’s no longer about whether to chase, but whether this move can turn resistance into support: BTC is challenging 81K, while SOL is also nearing its intraday high.
Holding 80K means the trend accelerates; failing to hold means quadruple witching day shakes out the last batch of buyers chasing the rally.
Do you think 81K will hold steadily tonight?
post-image
BTC+4.79%
ETH+4.72%
SOL+10.03%
Smart money is fading the daily breakout on $UNI /USDT right now.

$UNI /USDT - SHORT

Trade Plan:
Entry: 8.859 – 9.007
SL: 9.855
TP1: 8.242
TP2: 7.781
TP3: 7.089

Why this setup?
Why now? The 1h price is holding at 8.934 while the 15m RSI reads 57.46, showing momentum is neutral enough to let the short breathe. With the 1h ATR at 0.295512, the 8.859 to 9.007 entry zone gives a clean trigger for a move toward TP1 at 8.242. If that breaks, TP2 at 7.781 becomes the next target, but the daily trend remains bullish, making this a fading play against the higher-timeframe structure. The invalidat
UNI+15.30%
Everyone is about to get wiped on SYMBOL right now.

$PEPE /USDT - SHORT

Trade Plan:
Entry: 0 – 0
SL: 0
TP1: 0
TP2: 0
TP3: 0

Why this setup?
Why now? The daily trend is a range, meaning SYMBOL has been stuck in a tight band and sellers are finally stepping in with conviction. The 15m RSI sits at 61.94, which is still elevated but rolling over fast enough to confirm that momentum is shifting into the shorts we are positioned for. The 1h ATR is reading 0.0, so the recent candles have compressed into near-zero volatility, and that compression is exactly what precedes a sharp directional move
PEPE+4.61%
Important Developments for HBAR
Hedera announced the $10,000 Scaffold-HBAR template reward program for developers on September 16, aimed at encouraging the development of new applications in the ecosystem. In addition, the testnet v0.77.2 upgrade was completed on September 15. These stand out as positive developments for the technical ecosystem.
So, let’s examine the chart right away. On the HBARUSDT chart, the price appears to be testing a critical resistance zone at approximately 0.07904 USDT. The area around $0.0798 is the main threshold that previously faced selling pressure; if hourly clo
post-image
HBAR+3.55%
At first, standing there, I was convinced the road ahead would be smooth, so I went all in on the direction. I never expected the wind to shift, or the road to rise step by step, leaving my original entry point far behind.
At first, I could still laugh and call it a “normal rebound,” waiting for it to return. Later, I watched it cross one mental threshold after another; with every step higher, the tension inside me tightened another notch.
My finger hovered over the close-position button countless times, but I never pressed it. I was afraid that the moment I did, the market would turn around,
BTC+4.86%
ETH+4.78%
$SOMI is quietly approaching the $0.2 resistance level
If you bought when it was mentioned at $0.08, congratulations 🎉 we’re up 100% and still going 🔥 Meanwhile, $AGL and BERA are two other coins you need to watch closely, as a breakout is coming
If you’re trading, drop a 👍 on this post 💯SOMIPriceAnalysis
post-image
SOMI+12.97%
BERA+5.93%
$BTC Signal】1H momentum continuation + order book depth support
$BTC 1H RSI 84.66, 4H RSI 78.15, with the price at 80896.8 tracking the upper Bollinger Band at 80921. The order book bid-to-ask depth ratio is 1.57, with a depth imbalance of 22.04%; buy orders below outweigh those above, and selling pressure continues to be absorbed. The 4H MACD histogram expanded to 532.96, while the 1H histogram simultaneously grew to 346.76, with momentum aligned across both timeframes. The funding rate is only 0.0060%, keeping long holding costs extremely low, while short-squeeze fuel remains unspent. The
post-image
BTC+4.86%
DOGE Market update
live-cover
LIVE1,073
Load More

Join 40 M users in our growing community

⚡️ Join 40 M users in the crypto craze discussion

💬 Engage with your favorite top creators

👍 See what interests you

Trending Topics

JapanRealEstatePowerChipStocksRise

58.46k Views3.47k Discussing

Japan's Nikkei extended gains on Sept 18, with real estate, power, and semiconductor sectors leading. Gate covers over 12,800 global stocks and ETFs, offering one-stop USDT trading across US, HK, Korean, and Japanese markets. [👉 Read more](https://www.odaily.news/en/newsflash/518749)

USAIConceptStocksRally

33.34k Views441 Discussing

GateTopsStockPerpetualCoverage

37.51k Views2.3k Discussing

View More