Share your thoughts
placeholder
Article
$AKE Signal】Long + 1H pullback to EMA20 / Negative-funding short squeeze
$AKE The 1H pullback to EMA20 held, with the funding rate at -0.044%, meaning short positions are paying funding. OI is stable, while sell-side depth at -32.44% weighs on price; dense support is found at 0.018545-0.018601.
🎯Direction: Long
⚡Entry/Limit order: 0.018545-0.018601
🛑Stop-loss: 0.017671
🚀Target 1: 0.019996
🚀Target 2: 0.020694
🛡️Trade management: - Execution strategy: After reaching Target 1, reduce the position by 50% and move the stop-loss up to breakeven. If the price falls back to the entry level, exit
post-image
AKE+44.69%
BTC+0.18%
ETH+1.18%
SOL+1.66%
Is this even a rebound? It’s CPR for my account, isn’t it? $ZKC It just touched 0.0497, with +12.88% secured. I stared at the screen for several seconds to make sure I had the right account.

When I opened the charts this morning, buying pressure had clearly strengthened, and each pullback was getting smaller and smaller. This was obviously not an ordinary dead-cat bounce. Around 0.04953, I put it plainly: the risk-reward at this level was good enough; if wrong, take the loss, and if right, it’s a big payday.

Looking back now, the timing was spot-on. As for the position management: I took 7
post-image
ZKC+0.79%
XRP+1.47%
BTC+0.19%
Seems like Christmas 🎁⛄🎄
$TROLL
post-image
TROLL-23.05%
  • 1
The Truth Behind AKE’s Overnight Surge: A Carefully Orchestrated Hunt
Last night, Shandi surged strongly from 0.008, with its price increasing sixfold
Many people only saw the explosive price rise
Yet overlooked the silent battle behind it.
From my observation,
AKE had recently been trading sideways for a long time, continuously luring in shorts. A top influencer had opened a heavily leveraged short position in advance,
with an enormous position that had practically become the most conspicuous short on the order book.
And the market maker had set its sights precisely on this “certainty.”
Start
post-image
AKE+44.69%
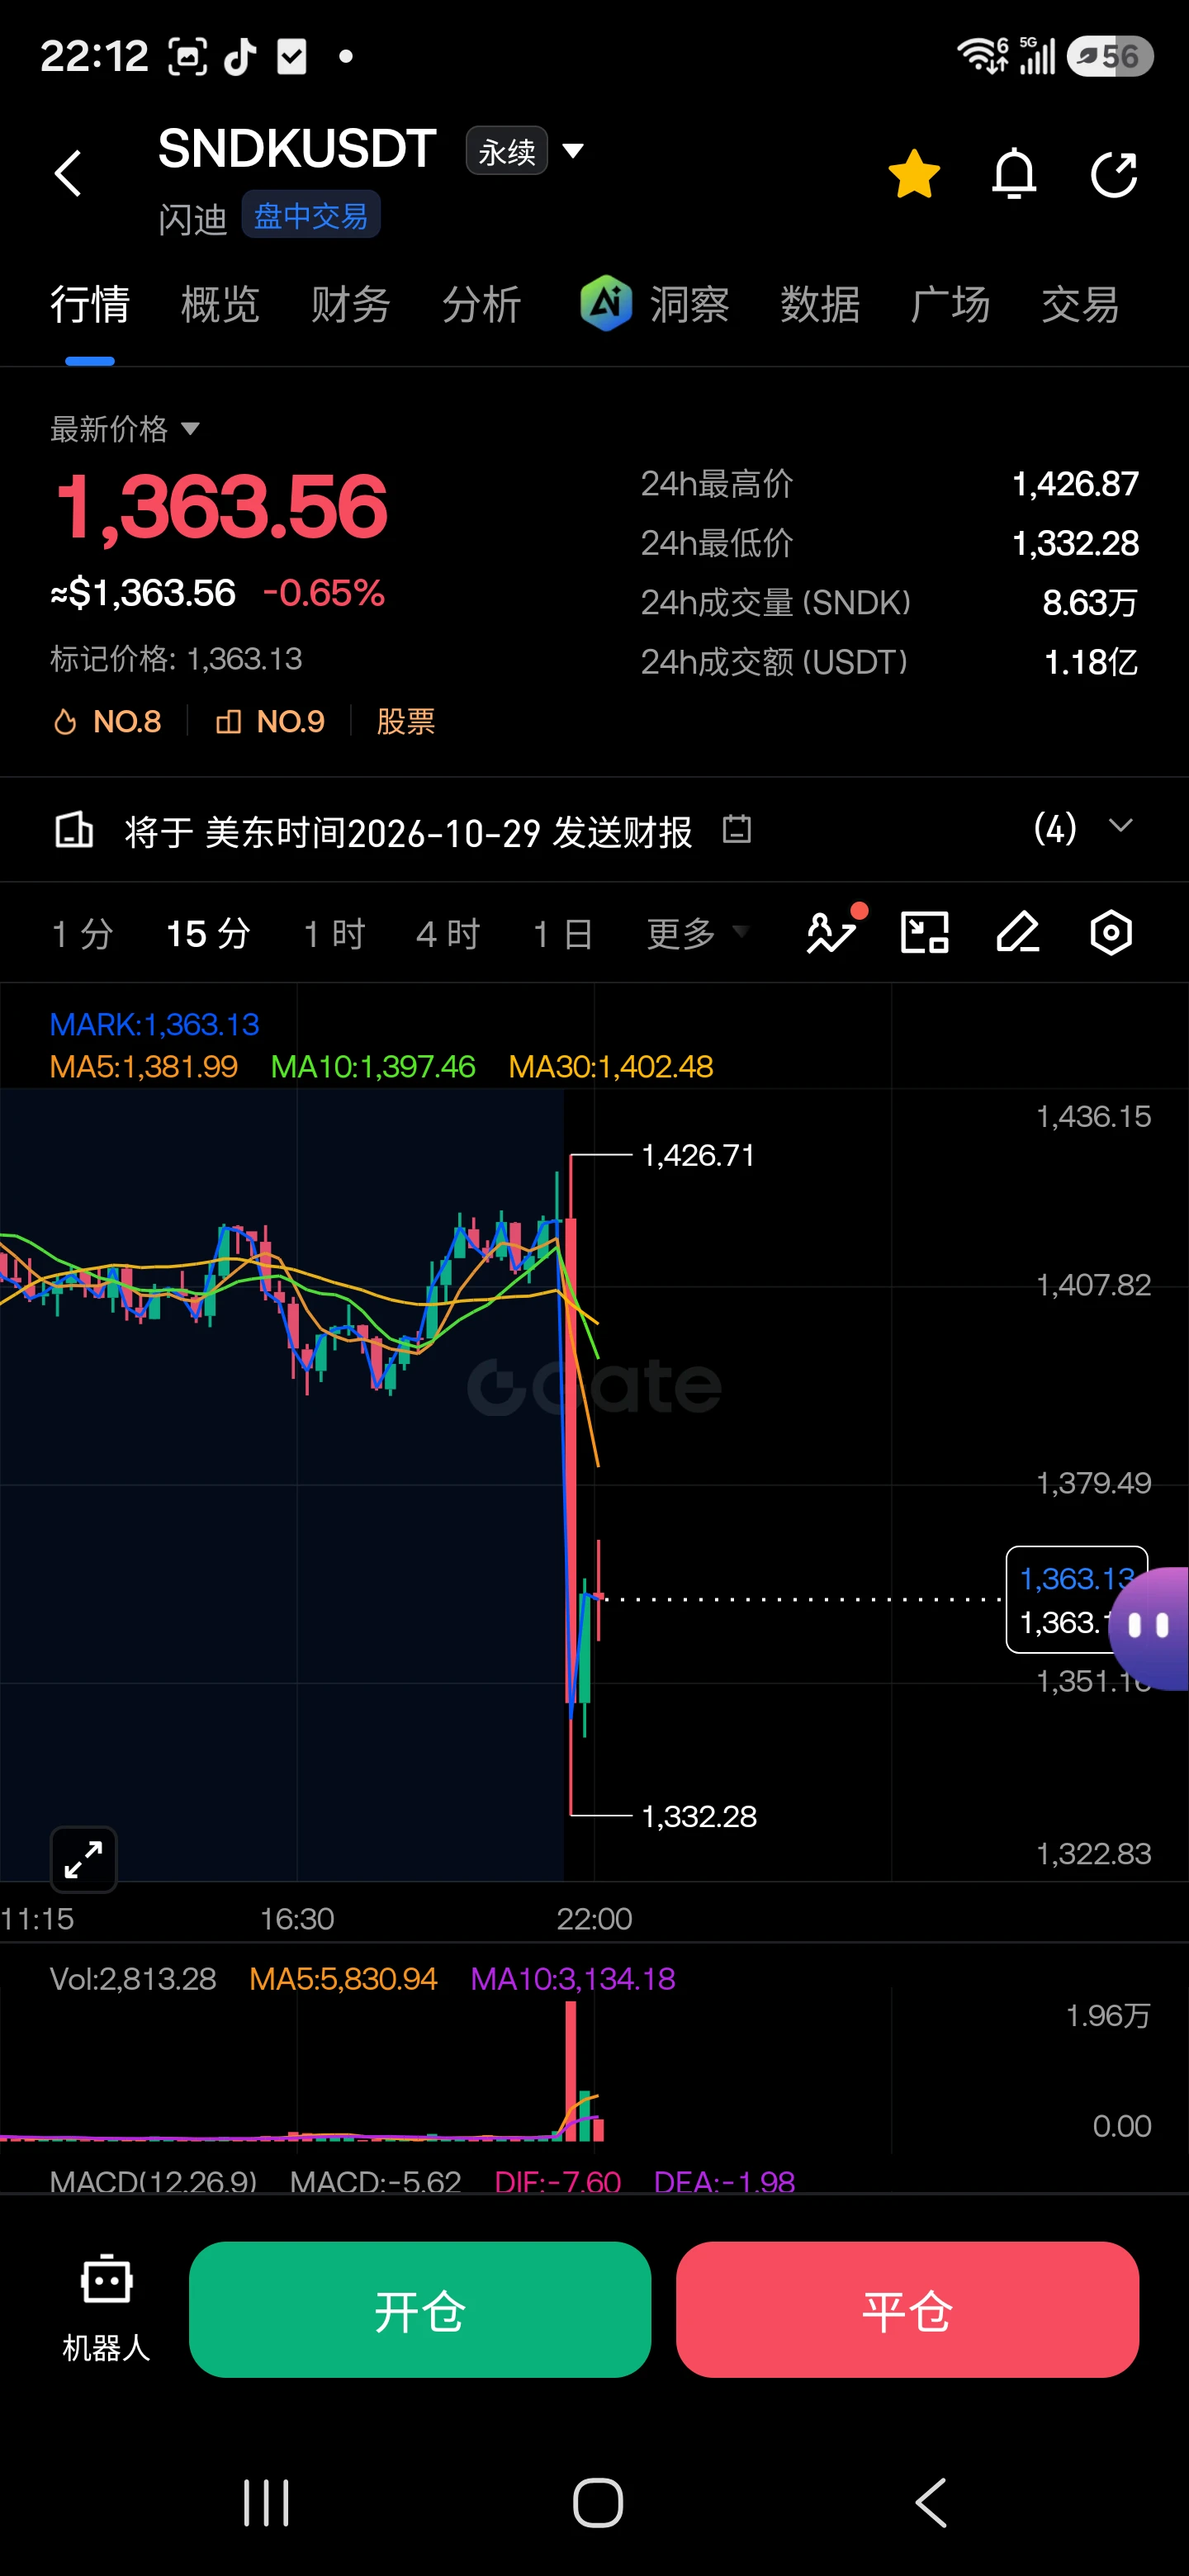
SNDK+1.85%
Why is everyone long MU/USDT while the 4h timeframe is screaming SHORT with 84% confidence?

MU/USDT - SHORT

Trade Plan:
Entry: 1015.27 – 1016.89
SL: 1026.20
TP1: 1008.49
TP2: 1003.43
TP3: 995.84

Why this setup?
- The 1D trend is bullish, but the 4h setup just armed a SHORT at 1016.08 — that’s a classic higher-timeframe pullback trap.
- RSI on 15m is at 47.64, showing zero momentum for a bounce — sellers are in control of the micro-move.
- ATR 1h at 3.24 means the expected move is tight, but TP1 at 1008.49 is only 0.75% away — low risk, high probability.
- Why now? The entry zone (1
MU+0.19%
CRYPTO THINGS YOU MAY HAVE MISSED — LAST 24 HOURS | 5 SEPTEMBER 2026
The market looked weak—but institutions quietly poured more than $1.2B into bitcoin:native and $ETH funds last week.
The price and capital flows are telling different stories.
🧵👇
1/2 — ETF DEMAND SURVIVED THE MACRO SHOCK
US spot ETFs recorded approximately:
🟢 bitcoin:native: $986.7M weekly net inflow
🟢 $ETH: $215.3M weekly net inflow
🟢 Combined: $1.20B
Friday alone added $174.6M to Bitcoin funds and $25.9M to Ethereum funds—even after the stronger payroll report increased Fed-hike risk.
Investor takeaway: institutions co
post-image
BTC-2.35%
ETH-2.49%
HBAR+3.17%
XLM+3.15%
XDC+1.22%
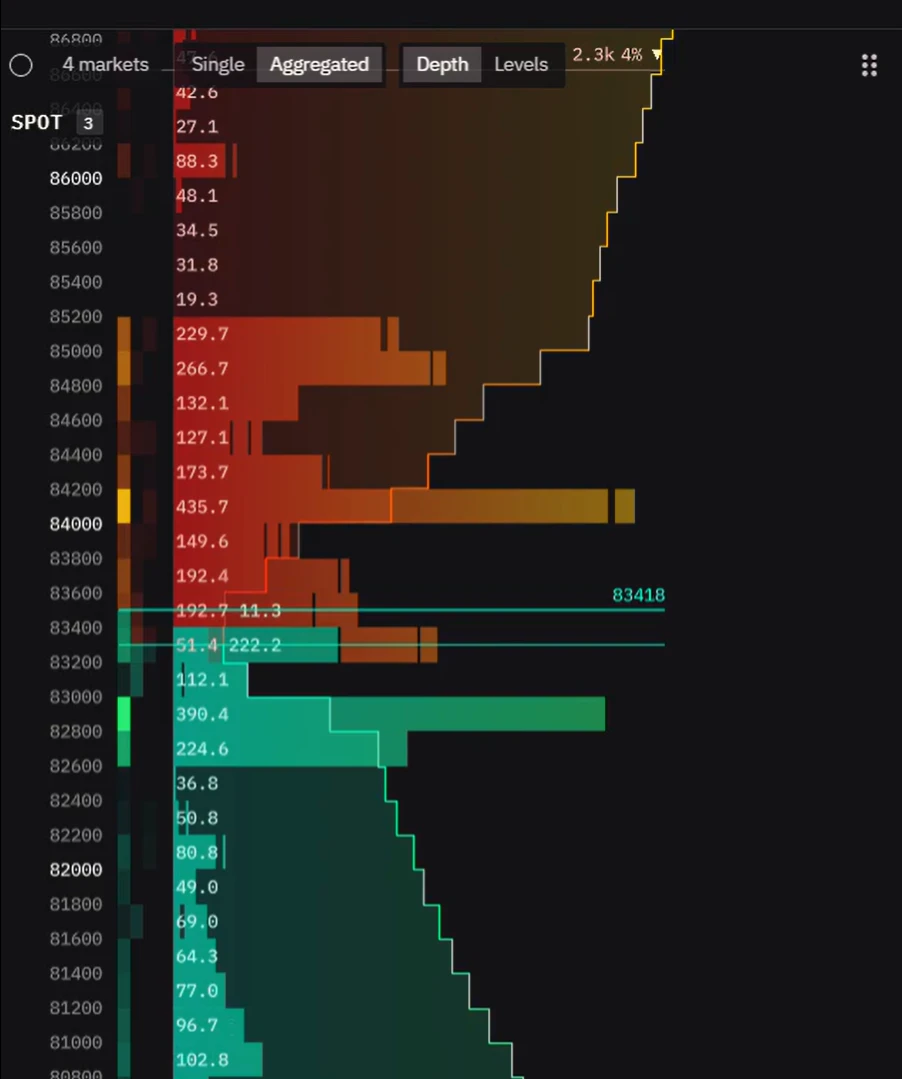
Bull-Bear Divide Deepens Around $82K! B.TOP Founder Sells All His BTC
live-cover
LIVE20
Everyone’s staring at HYPE’s 85.5—but the real trap is waiting at 87.3.

$HYPE /USDT - LONG

Trade Plan:
Entry: 85.356 – 85.660
SL: 84.053
TP1: 86.600
TP2: 87.327
TP3: 88.419

Why this setup?
Why now? The 4h structure is armed LONG with 95% confidence, and the 1D trend is bullish—this isn’t a coin flip.
- Entry zone: 85.35–85.66 (tight, disciplined).
- RSI 15m at 56.5 shows room to run, not exhaustion.
- TP1 at 86.6 is the appetizer; TP2 at 87.3 is where the crowd gets greedy.
- Invalidation sits far below at 82.2—so the risk/reward is mathematically on your side.

Debate:
Do you f
HYPE+1.69%
y’all current targets just too minimal
Raise the fucking bar!
$ETH —> $12k
$BTC —> $300k
$SOL —> $1k
$BNB —> $5k
post-image
ETH+1.18%
BTC+0.18%
SOL+1.66%
BNB+7.24%
Everyone’s staring at ADA’s range—but the 4H just whispered a secret that most will ignore.

$ADA /USDT - SHORT

Trade Plan:
Entry: 0.2187 – 0.2199
SL: 0.2249
TP1: 0.2151
TP2: 0.2122
TP3: 0.2080

Why this setup?
- ADA/USDT is coiling at 0.2193 with a 55% short bias, but the 1D is still "range"—not a breakout.
- RSI 15m at 51.19 = zero momentum; ATR 1H shows a tight 0.0023 squeeze—volatility is loading.
- Why now? The 4H structure says the path of least resistance is down to TP1 0.2151, yet the invalidation at 0.2110 is a trap door for late shorts.
- If price rejects 0.2199 (entry high
ADA+4.53%
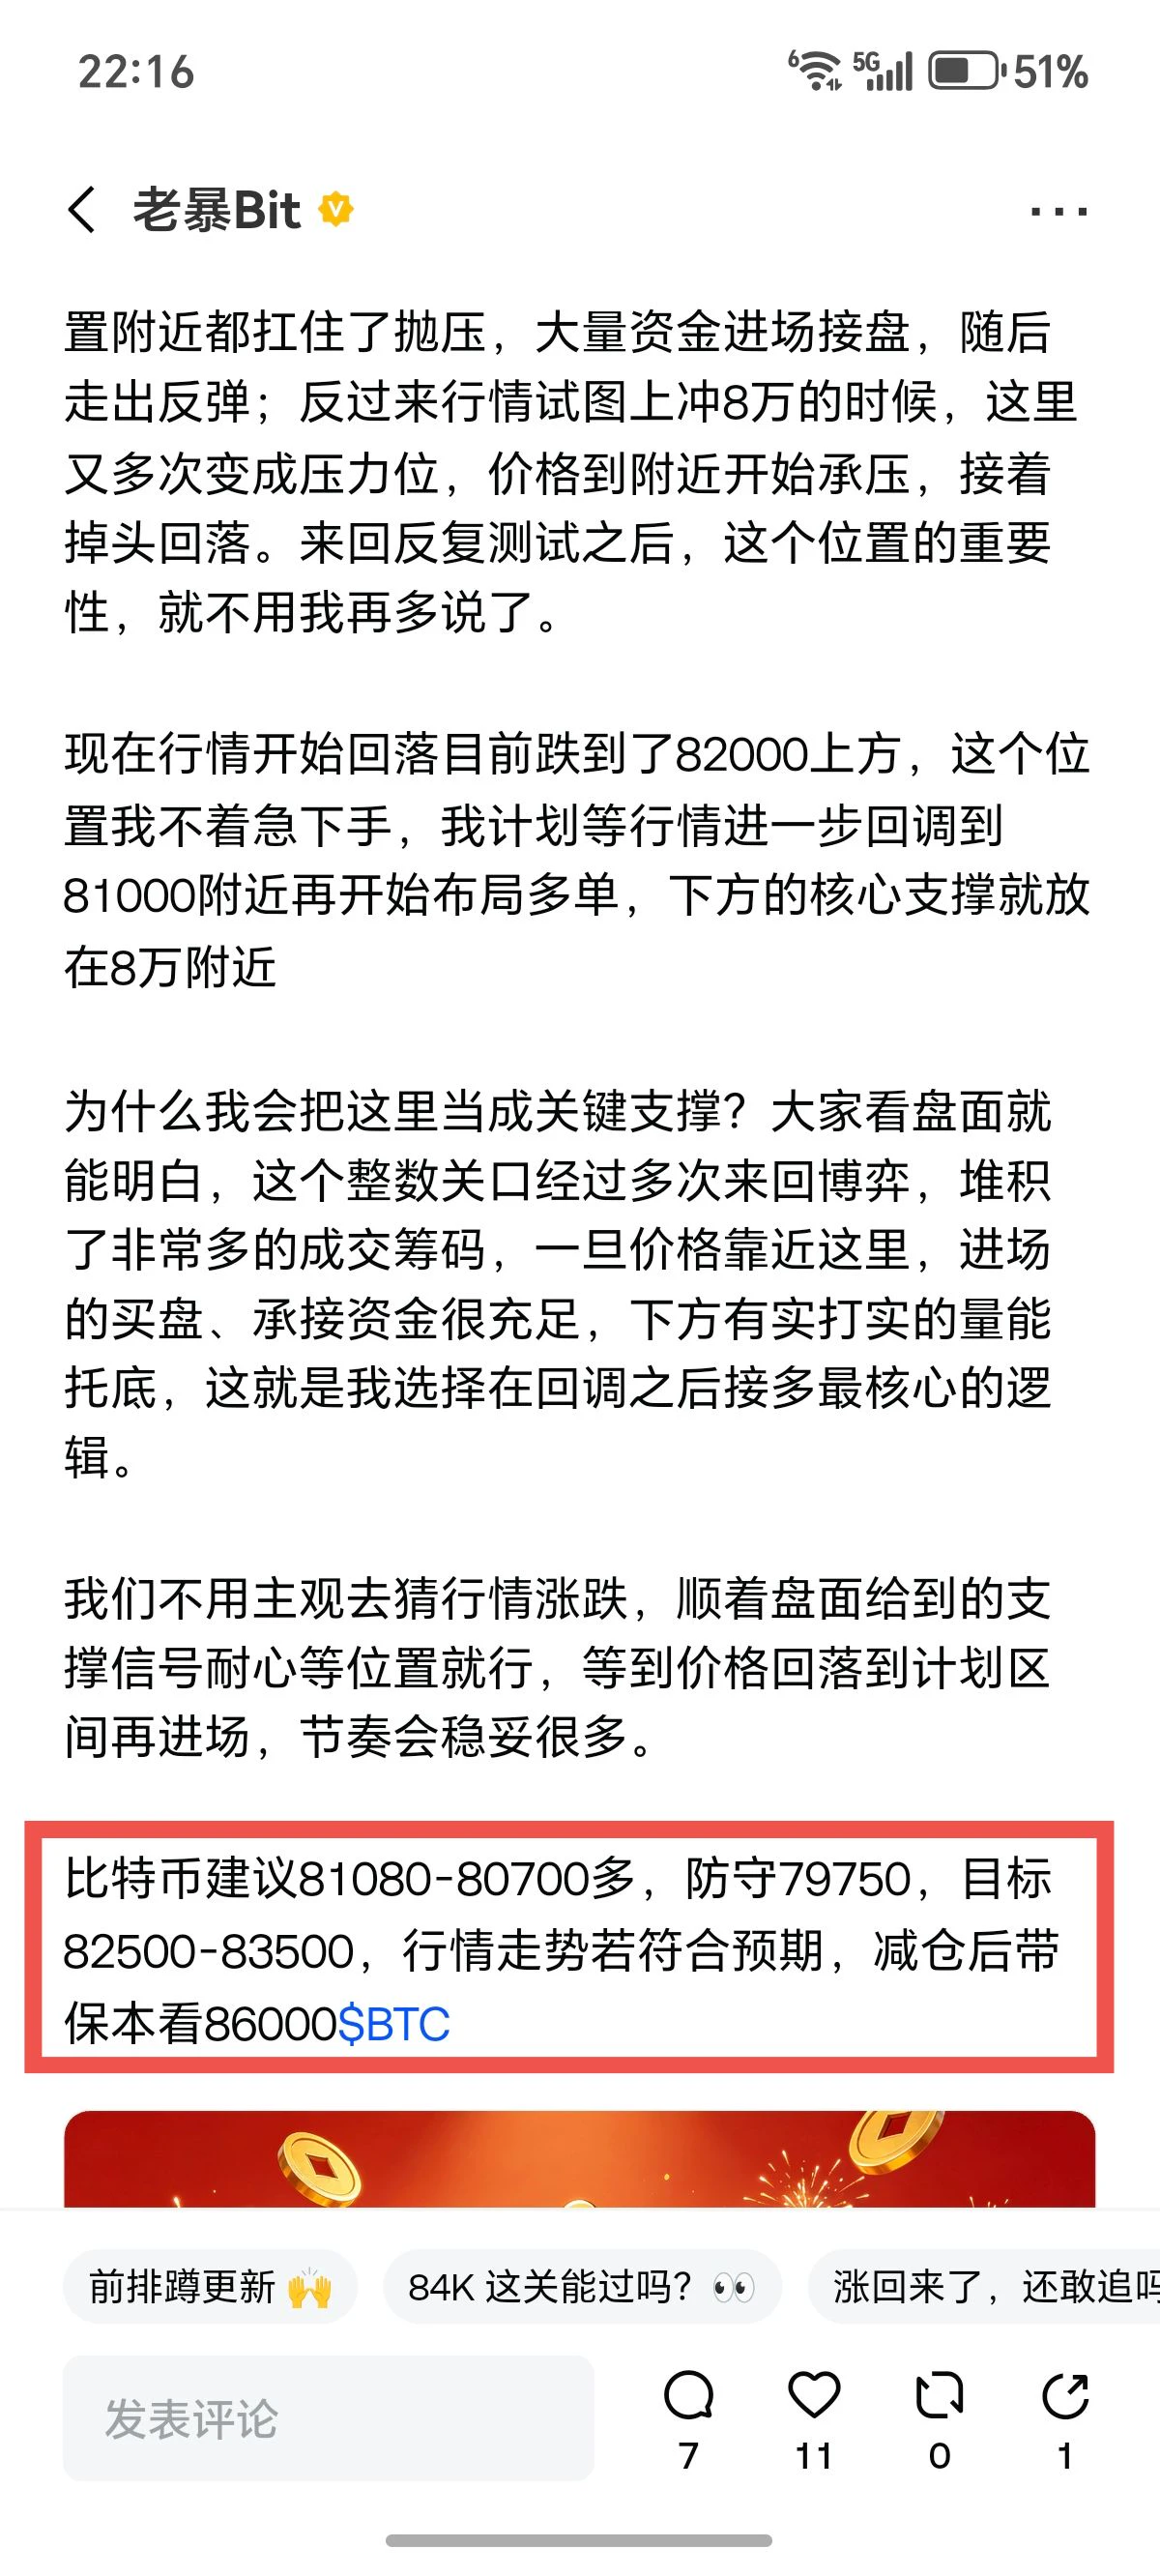
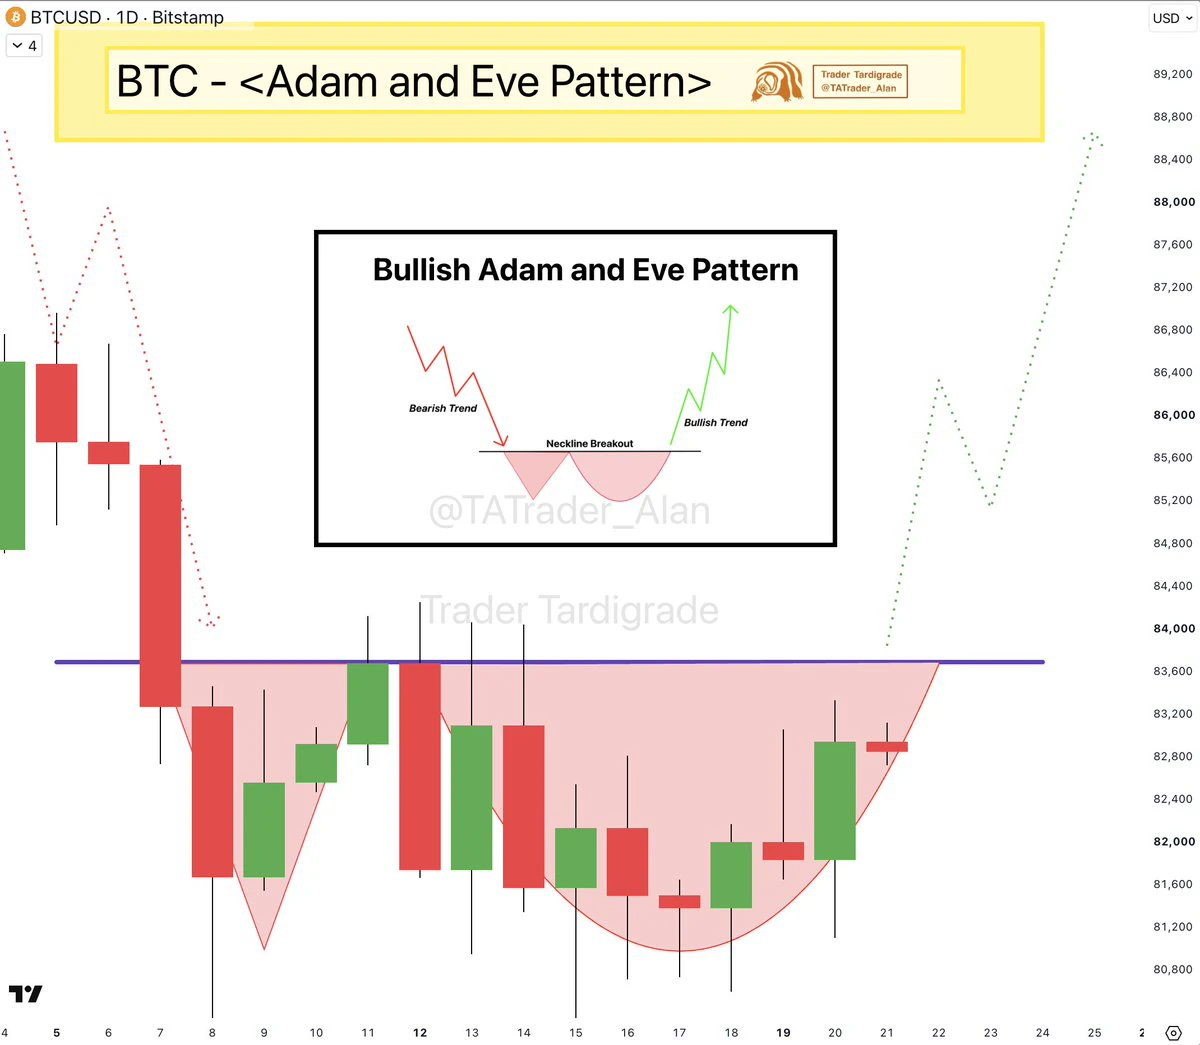
Nonfarm payrolls dump BTC back below 80,000; long-term direction unchanged, still targeting 84,000💛
After the nonfarm payrolls data was released, Bitcoin was once again dumped back below $80,000.
Even amid the impact of adverse macro factors, my long-term target remains unchanged, with the next target still at 84,000.
Let's clarify the current market contradiction:
August employment growth came in well above expectations, prompting the market to raise expectations for Fed rate hikes and creating clear macro-level pressure.
On the other hand, the BTC spot ETF still maintained net inflows of ap
post-image
BTC+0.19%
It is meme season.
Make money 💰 from memes and hold solid coins.
MEME+3.25%
Everyone’s chasing the 15m RSI bounce—but that’s exactly where ESPORTS traps breakout traders.

$ESPORTS /USDT - SHORT

Trade Plan:
Entry: 0.01492 – 0.01500
SL: 0.01533
TP1: 0.01468
TP2: 0.01450
TP3: 0.01423

Why this setup?
- 1D trend is bearish; 4h bias is SHORT with 95% confidence—not a guess, a weighted edge.
- Price is stalling at 0.01496, right on the 1h reference, while RSI 15m at 68 screams overbought *into* resistance.
- ATR (0.000153) shows tight coils—breakdowns here snap fast, not crawl.
- Why now? The “waiting” status means the setup is armed; invalidation at 0.01530 is a
ESPORTS+1.02%
The probability of a Fed rate hike in September fell from 66% to 50% in just a few days. Fed Chair Christopher Waller sent a clear dovish signal, saying that if inflation slows further, he would support keeping rates unchanged in September. Bitcoin broke above $82,000, gold rose above $4,500, and U.S. stocks posted their biggest gain in nearly a month. What does such a sharp drop in expectations mean? How is the logic of crypto market pricing being reshaped?
Liquidation at its peak 🥺😂
post-image
Rewards are being distributed! Open your mystery box now and win up to 100 USDT worth of tokens! https://www.gate.com/referral/earn-together/invite/UFRFAQ0M?ref=UFRFAQ0M&ref_type=103&utm_cmp=rXJBDjtJ&activity_id=1788357807948
post-image
Drop your ticker in the comments! Let’s see which community is the loudest today. 👇
#Memecoins #Crypto #100x #ToTheMoon #DegenLife #SolanaSummer #Altseason #DiamondHands #Pepe #Dogecoin #Bonk #WIF
post-image
PEPE+3.35%
DOGE+6.57%
BONK+0.99%
WIF+5.74%
  • 1
$MU $SNDK $EWY $DRAM closed the week with a BREAKOUT 💥
MU+5.89%
SNDK+11.88%
Why is HYPE's 1D trend screaming bullish while its 15m RSI is frozen at 47.58?

HYPE/USDT - LONG

Trade Plan:
Entry: 85.18 – 85.46
SL: 83.93
TP1: 86.36
TP2: 87.06
TP3: 88.10

Why this setup?
The market is coiling, not reversing.
- 4h setup: LONG with 95% confidence—this isn't a guess.
- Pullback to 85.32 sits right on the 1h reference, with ATR (0.58) signaling low volatility = compressed spring.
- TP1 at 86.36 is only 1.2% away; TP2 at 87.06 and TP3 at 88.10 are within a single 4h candle's range on a bullish day.
- The 15m RSI is neutral, not overbought—meaning buyers haven't exhau
HYPE+1.66%
Load More

Join 40 M users in our growing community

⚡️ Join 40 M users in the crypto craze discussion

💬 Engage with your favorite top creators

👍 See what interests you

View More