Square
Following
Hot
News
Profile
Share your thoughts
placeholder
Article
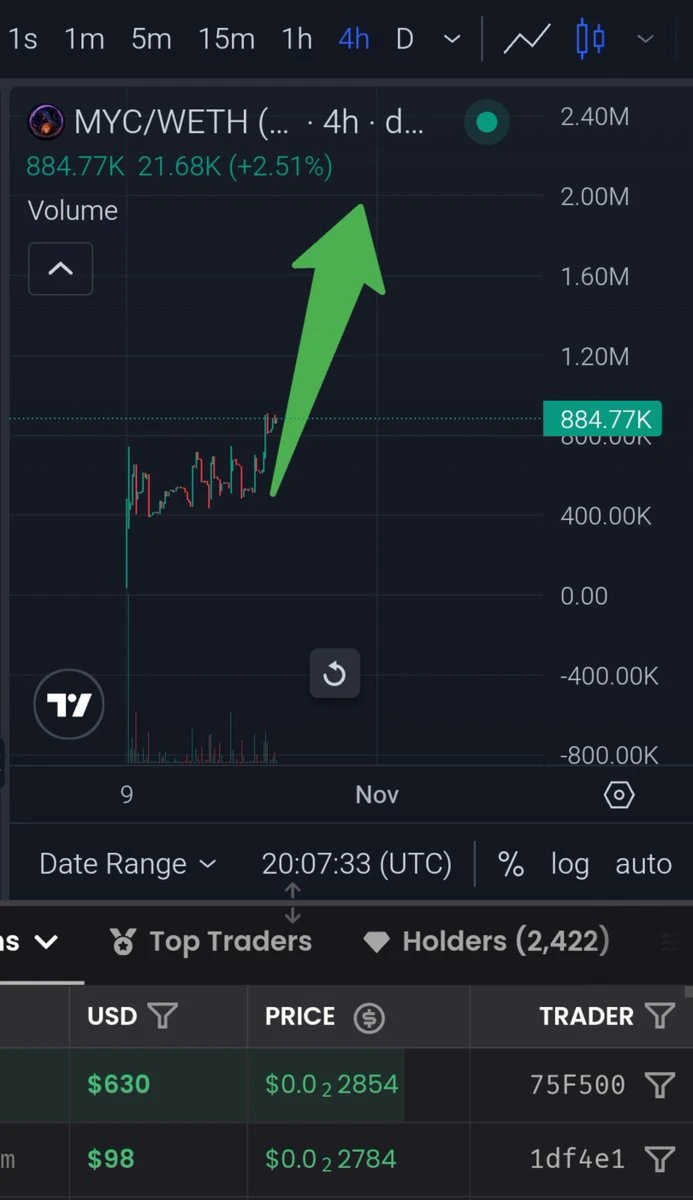
🚨 I think Base is hiding one of the most interesting meme plays right now.
$MYC | Mega Yacht Cult 🐙
A sub 1million market cap coin. Chart looks amazing.
Most meme coins die because they have no engine and no community.
This one is trying to build one.
✅ 369M fixed supply
✅ Deflationary tokenomics
✅ 0% buy tax
✅ 0% transfer tax
✅ 5% sell tax → 70% burned, 30% flows back into LP
Every sell burns supply and strengthens liquidity.
And also they're building an ecosystem.
PC software.
Recurring business model.
A community with its own identity.
Nothing is guaranteed in memes.
But when demand meets
post-image
MEME-6.95%
Why do phones and computers come with 64, 128, 256, or 512 GB of storage ?
Why not 150 GB, 230 GB, or 300 GB ?
Is there a real technical reason behind these numbers, or is it just marketing?
I’ve always wondered about this.
post-image
Trenches
Kimchi
K
bade
b
Kimchi
CSoc...pump
Market Cap
$.
Change
.
24h Vol
$.
Holders
.
CYBER
C
bade
b
CYBER
CMo7...pump
Market Cap
$.
Change
.
24h Vol
$.
Holders
.
PANGEA
P
bade
b
PANGEA
JAFq...Y6ea
Market Cap
$.
Change
.
24h Vol
$.
Holders
.
AGT
A
bade
b
AGT
0x5d...e274
Market Cap
$.
Change
.
24h Vol
$.
Holders
.
PHP
P
bade
b
PHP
Cbkg...pump
Market Cap
$.
Change
.
24h Vol
$.
Holders
.
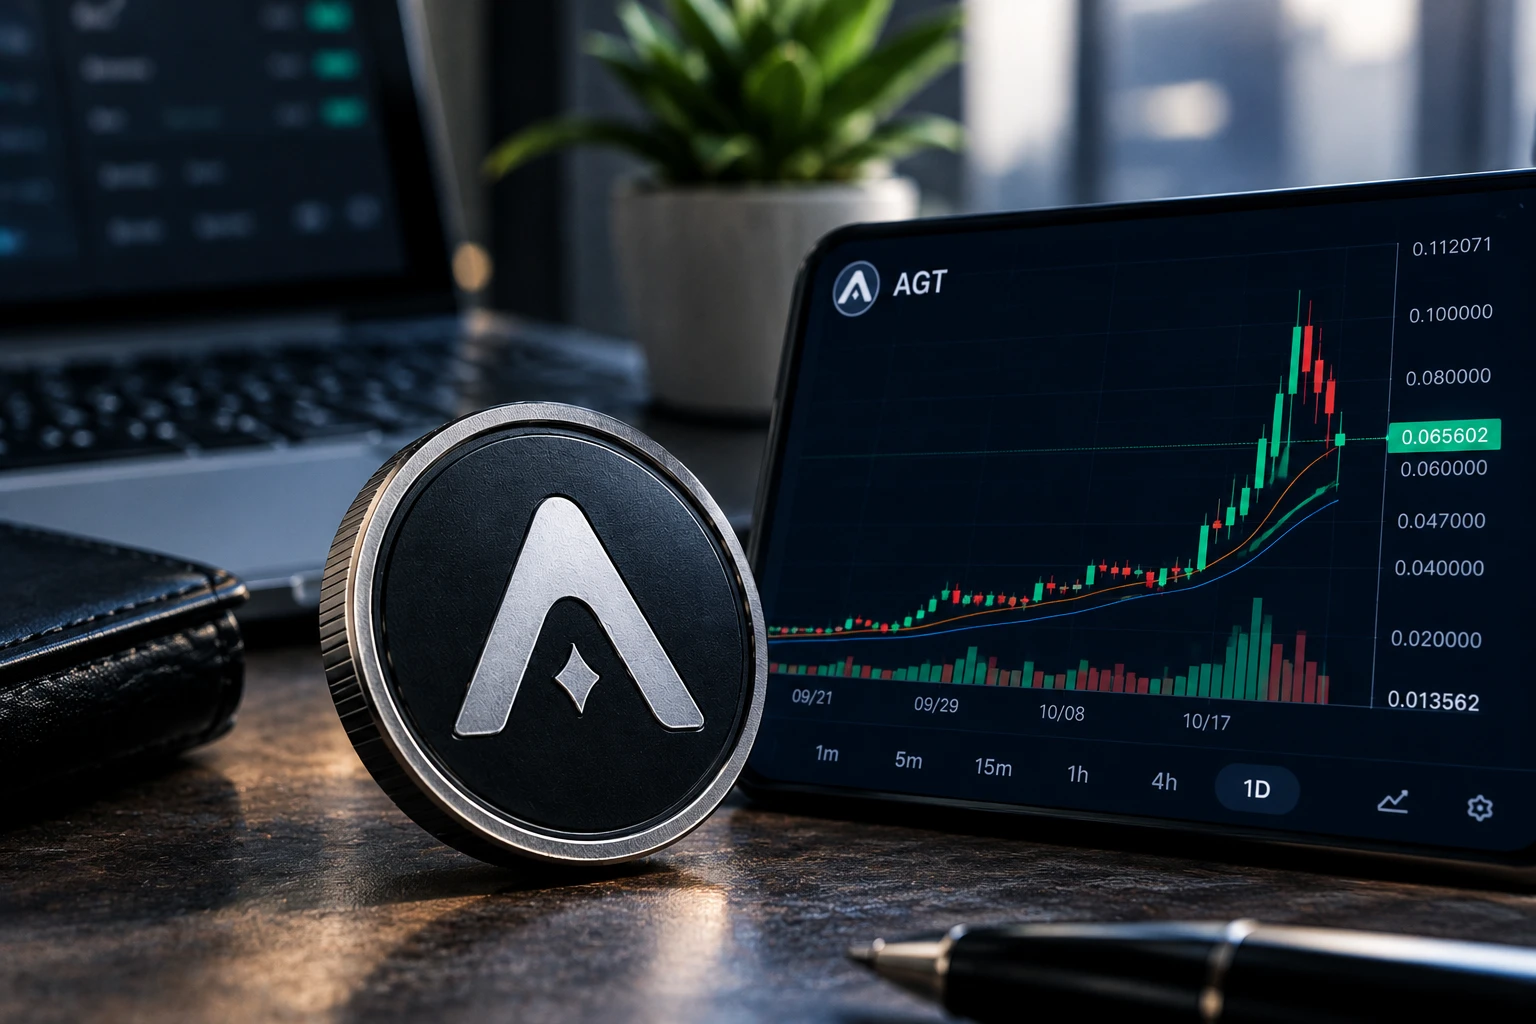
$AGT Can Momentum Survive the Pullback?
AGT climbed from ~$0.014 to $0.112 before facing a sharp correction. With $48.66M in 24H volume, the market is active — but the key question is whether demand can absorb the selling pressure.
📊 Levels to watch
- $0.080 — resistance
- $0.047 — support
A recovery above resistance could strengthen the structure. Losing support, however, would raise the risk of further downside.
The real signal isn't how fast $AGT rallies, but how well it holds after the hype fades.
#AGT #AlayaAI #CryptoMarket
post-image
AGT+20.13%
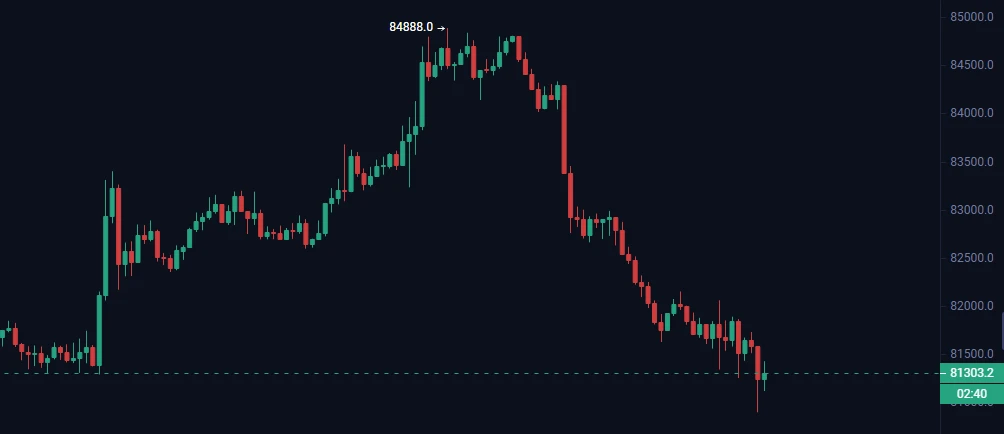
My BTC long position got stopped out.
After reviewing everything, I had correctly forecast 847. I thought it was about to break through and keep rising, so I chose to go long on a BTC pullback. Overall, there was nothing wrong with that; I was following the trend. But I overlooked 841 and 826 as trend reversal points. Only during the review did I realize I could have seen them—and the key thing is, I even warned my students that it was going to fall.
The trend now looks like it’s heading down, so I’ll just wait. If it keeps falling, I’ll add a bit more BTC and wait for an opportunity.
Today, o
post-image
BTC-3.80%
$BTC ‌ is testing the level bulls cannot afford to lose.
Bitcoin is trading near $81,466 after getting rejected around $84,800. The daily structure is still holding above the Supertrend, but sellers are putting pressure back on price.
Key levels to watch:
Support: $80,900 to $80,000
Major support: $79,660
Resistance: $81,925
Breakout zone: $84,800 to $85,000
Holding $80K could set up another recovery attempt. A break below $79,660 would weaken the bullish structure, while reclaiming $84,800 could bring buyers back into control.
BTC is at a decision point. Watch the close, not just the wick.
BTC-3.80%
SPCX-9.10%
  • 2
  • 1
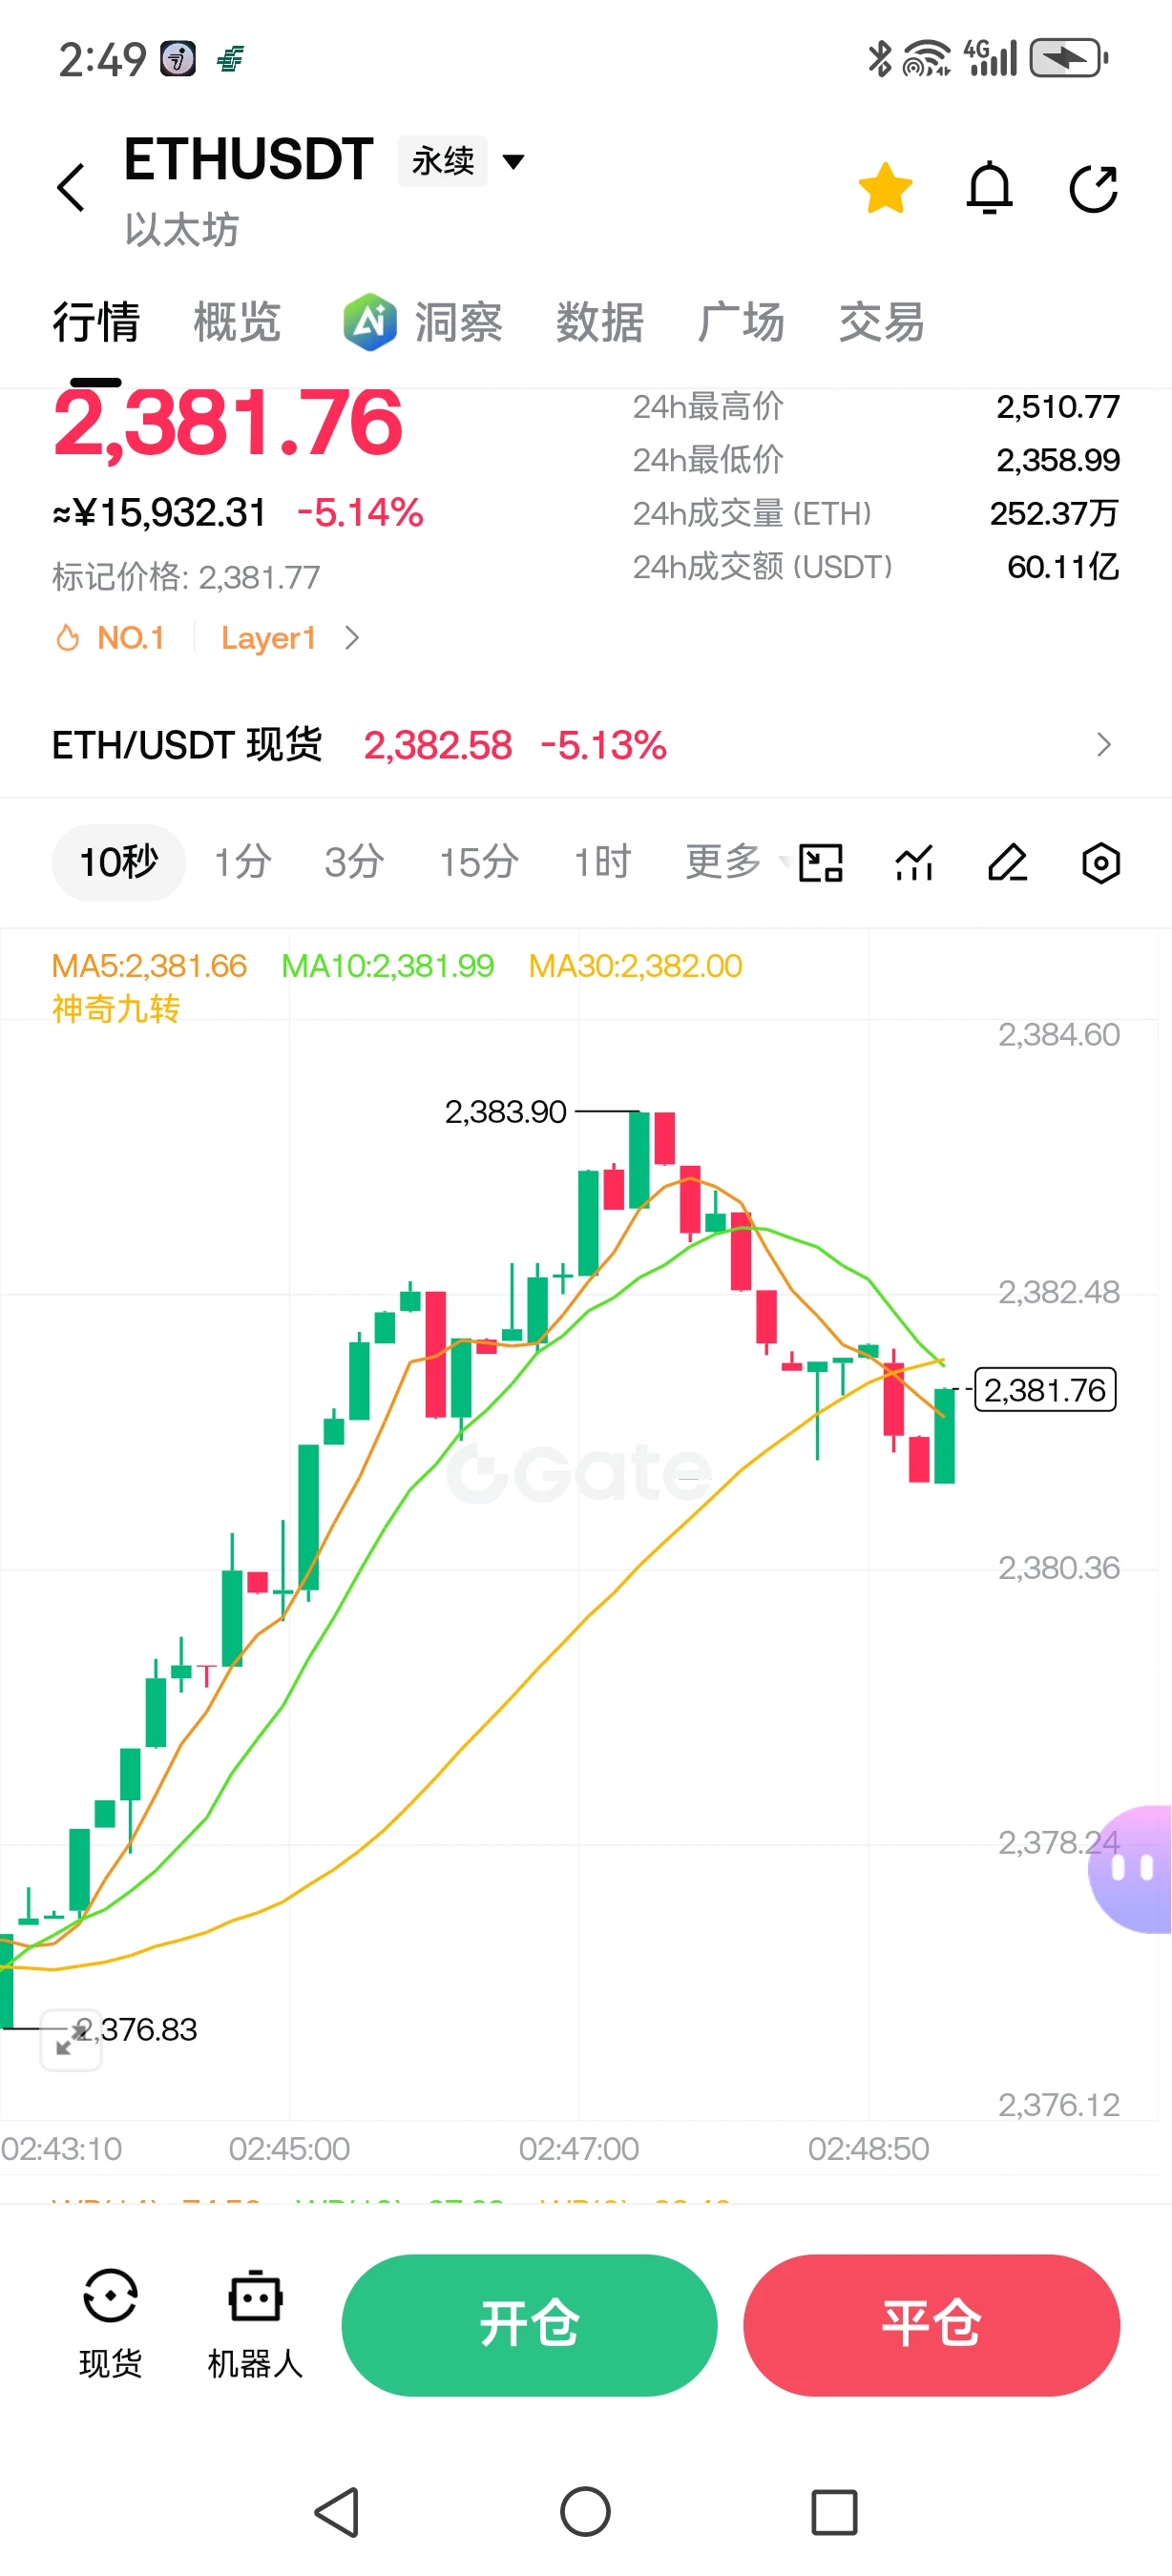
$ETH Go long near 2380, take profit at 2420-2460. Stop loss at 2365. Follow me for precise strategies every day. Every night in the livestream, I share strategies and place trades to go straight for profits
post-image
ETH-4.59%
  • 2
Real FOMO—new tokens keep being produced, yet the price is still holding this high. But a total supply of 100,000 really is too much.
[New Streamer]Whales Moves in Sync!
live-cover
LIVE1,996
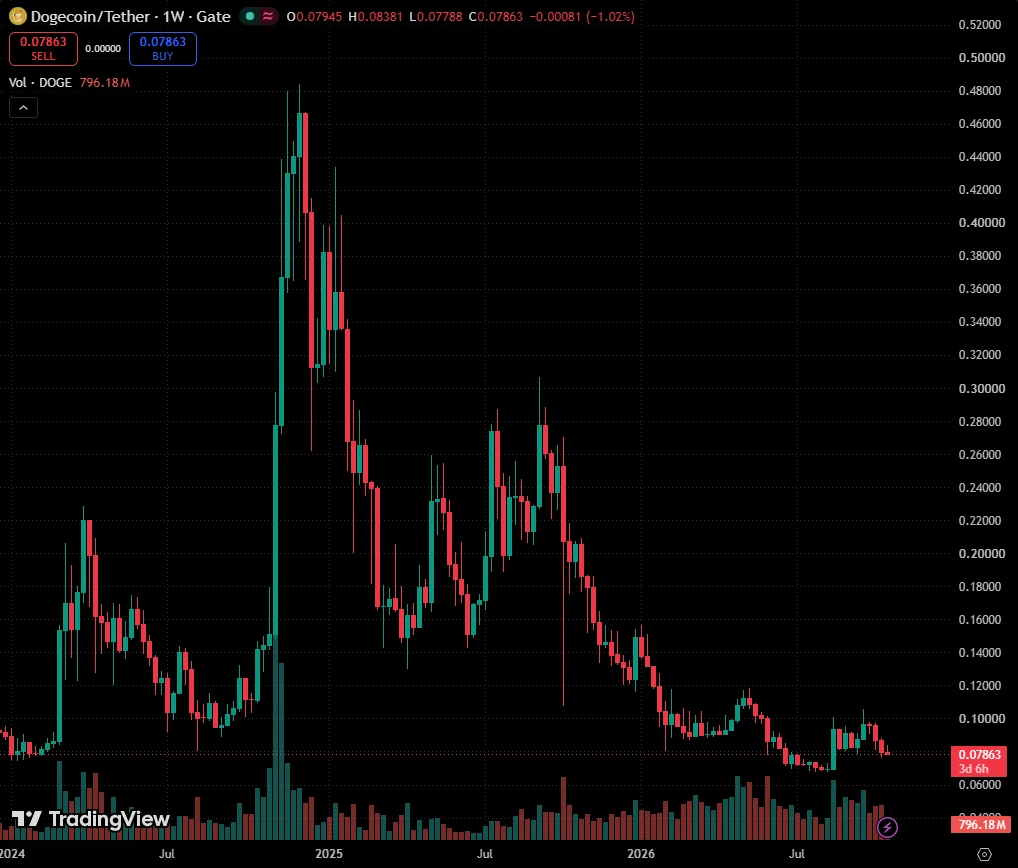
$DOGE DOGECOIN. USDT....well - positioned
If Doge manages to hold support, it could begin its main upward move from this level.
Otherwise, a correction toward 6 or even 5 cents would not be out of the question.
post-image
DOGE-5.41%
$IOST Down 49% in one day, with the current price of 0.0008 at the 24-hour low—this is a crash, not a correction. Technically, the price plunged directly from 0.0016 to 0.0008, a 50% drop, while trading volume surged to 313M, a classic panic sell-off and long liquidation. 0.0008 is the only support right now, but after a high-volume breakdown, this “closing at the low” pattern makes further downside momentum likely tomorrow. There are no divergence signals and no stabilization candlesticks, so don’t try to catch a falling knife. Trading advice: don’t chase shorts or buy the dip at the current
IOST-49.85%
$BMT ‌ just broke out of its range, and now comes the real test.
BMT is up over 28% on the day, pushing to $0.02956 after weeks of consolidation. Buyers have clearly stepped in, and the daily Supertrend remains below price at $0.01631.
Levels I'm watching:
Resistance: $0.02956 to $0.03026
Support: $0.02645
Next support: $0.02265
Major support: $0.01885
A clean break above $0.03026 could extend the move. But after such a sharp rally, a pullback or retest would be normal. Losing $0.02645 could signal weakening momentum.
The breakout is strong. Now watch whether BMT can hold these gains.
$META
BMT+26.27%
META-7.09%
  • 3
  • 2
Meta Revenue Gains Highlight AI Monetization Potential Amid Rising Capital Commitments
live-cover
LIVE1,419
After previously surging to around 1361, ZEC quickly pulled back on heavy volume. On the daily chart, it has retested near the Bollinger midline. Selling pressure was concentrated after the surge, short-term bullish momentum has faded, and the higher timeframe has shifted from strong to weak, making this a deep correction after a sharp rally.
The 4-hour Bollinger Bands have turned downward, and the MACD has formed a death cross and continues to weaken. Price has fallen below short-term moving average support, with bears gradually gaining the upper hand.
After a sharp drop, the hourly chart has
post-image
ZEC-10.66%
🚨Just now, gold and silver are plunging!
GLDX-2.57%
PAXG-2.53%
XAU-2.58%
XAG-5.66%
$UNITREE is up more than twenty points, with price and open interest rising as longs add positions and push it higher—still dare to chase? 😤 It’s pressing resistance along the upper edge; a surge from here is just handing money to shorts. One more push would be the final bull trap—get out fast 🤣
post-image
UNITREE-0.52%
The AI relay station is back online🎉
Now integrated with major models such as Claude and ChatGPT
Register now to get 2.5 in credits—come give it a try
Portal:
post-image
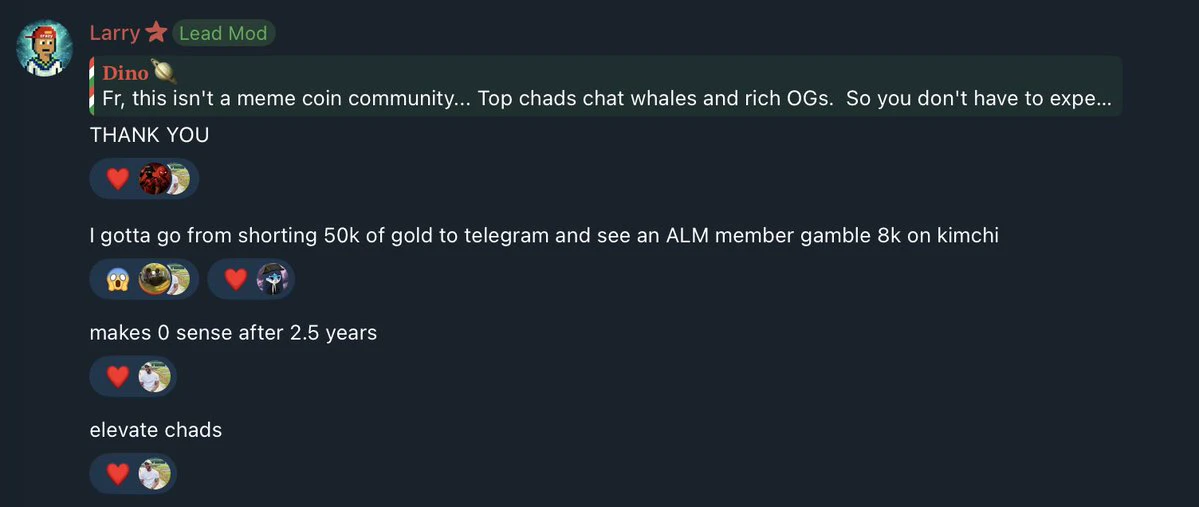
Did your lead mod short gold before the news?
post-image
XAU-2.58%
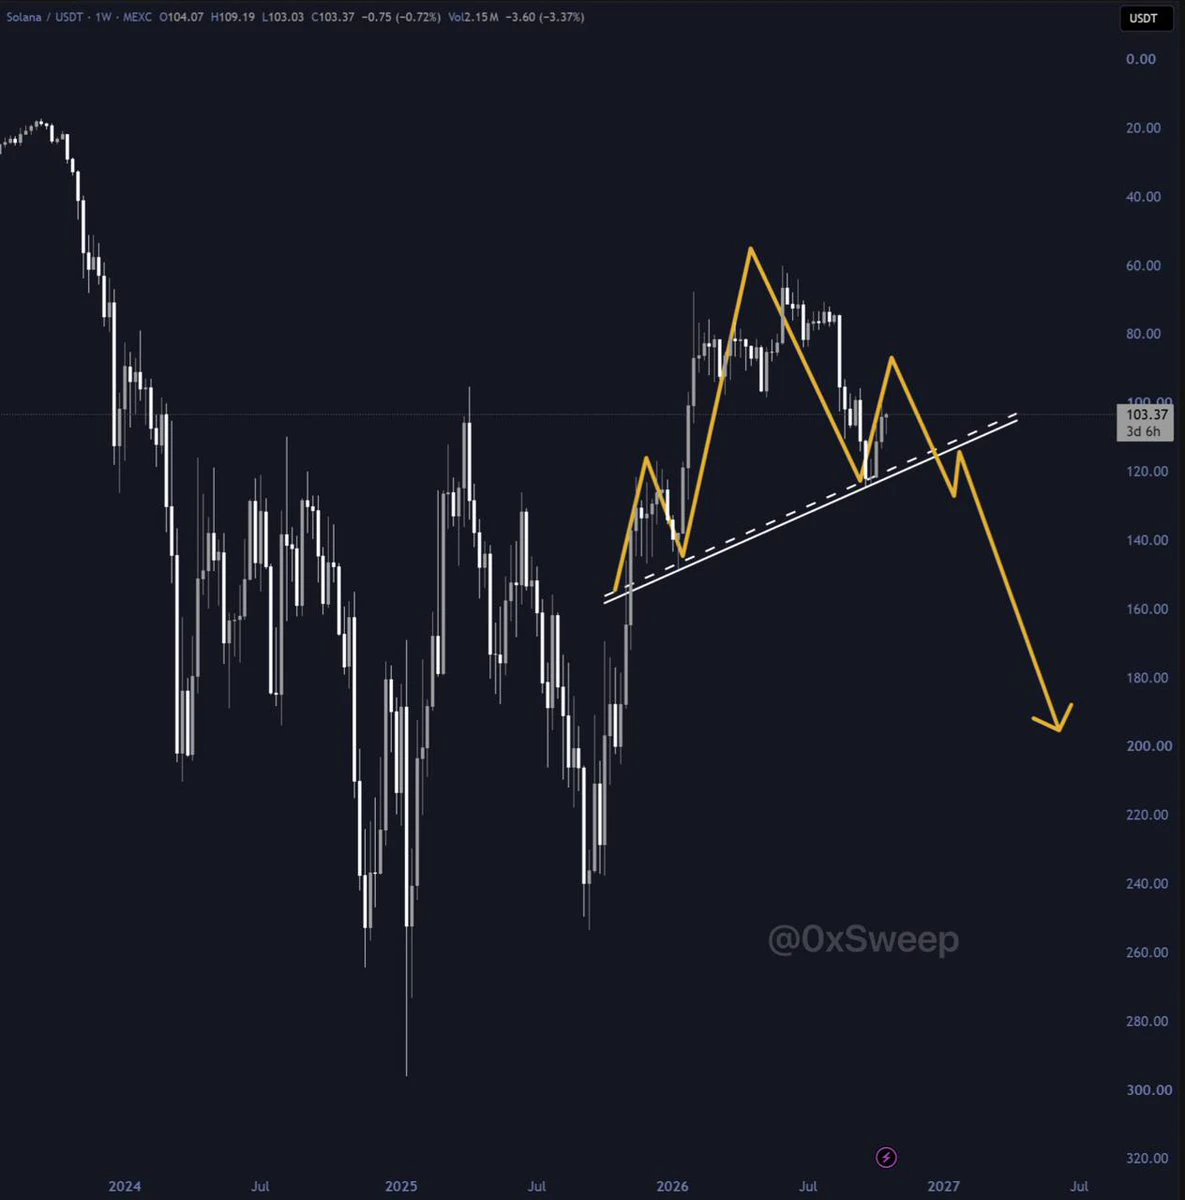
Pack your bags everyone
It's over for $SOL
post-image
SOL-4.65%
#nvda #$NVDA #WCTCS9
#NVDAStockAnalysis Can NVIDIA Break $230 and Target $250? Trading Strategy, Support, Resistance and Price Forecast
NVIDIA (NVDA) remains one of the most closely watched companies in the artificial intelligence revolution. With the price currently around 217 USDT according to the provided quote, traders are watching whether buyers can push the stock toward $225–$230 or whether another pullback will create a better entry opportunity.
My view: NVDA has a bullish long-term growth story, but the short-term trend needs confirmation. AI demand, earnings growth, trading volume,
Load More

Join 40 M users in our growing community

⚡️ Join 40 M users in the crypto craze discussion

💬 Engage with your favorite top creators

👍 See what interests you

Trending Topics

GateQ3ReportReleased

8.04k Views3.63k Discussing

Gate released its Q3 2026 report, with September derivatives trading volume reaching $396 billion, up 38.2% MoM, while spot trading volume reached $48.8 billion. The platform now covers more than 12,800 global stocks and ETFs. With trading and broader financial services expanding together, what could drive Gate’s next phase of growth? [👉 Full report](https://www.gate.com/announcements/article/102375)

MetaEarningsBeatExpectations

8.36k Views581 Discussing

USAIAndCryptoStocksRise

31.92k Views8.52k Discussing

View More