Square
Following
Hot
News
Notifications
Profile
Share your thoughts
placeholder
Article
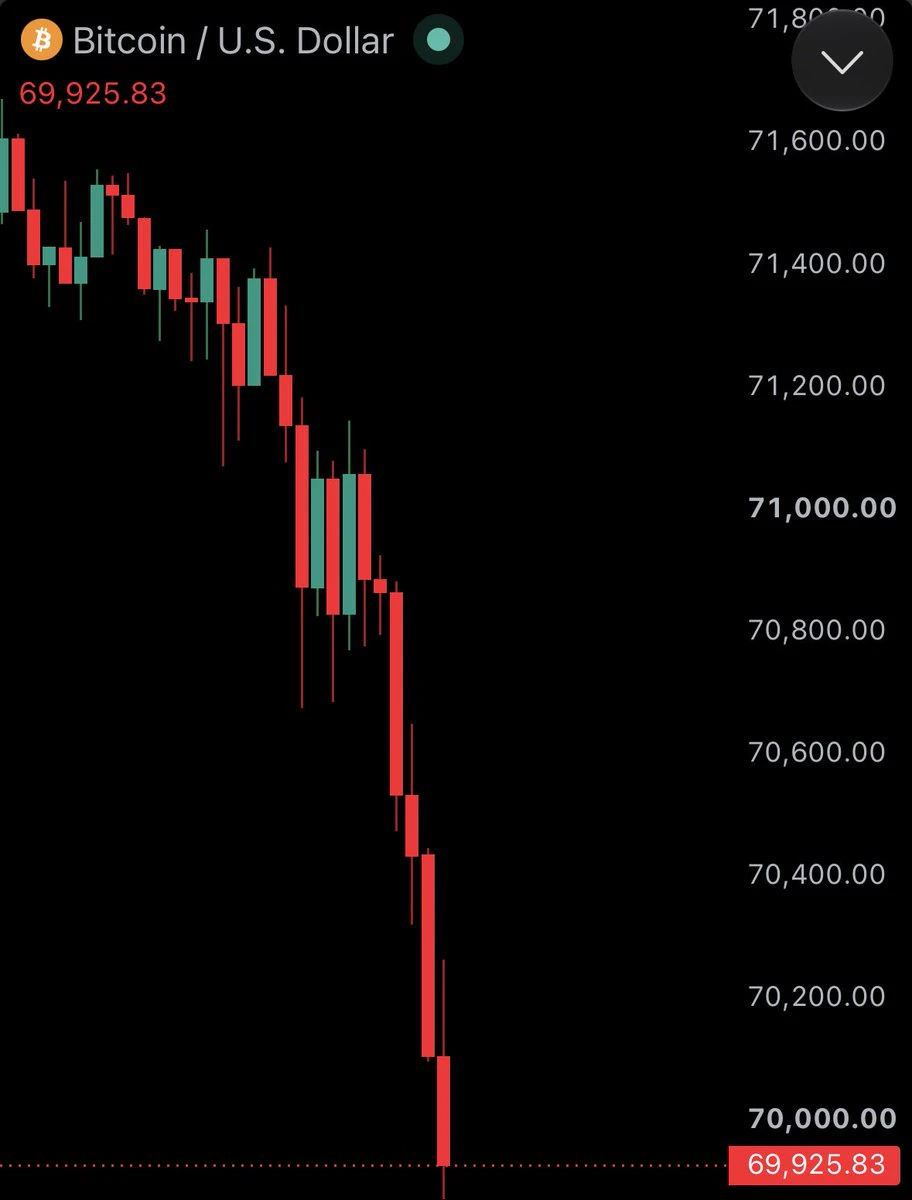
On Friday, amid inflation concerns and expectations of higher interest rates, Bitcoin fell below $70,000 for the first time since August, hitting a low of $67,449 and dropping as much as 4.4% intraday. It is currently around $68,600. Asian stocks and bonds also weakened as markets awaited US PPI data. Rising oil prices and inflation fueled expectations of Fed rate hikes, while concerns over tighter regulation added to the multiple macro pressures continuing to weigh on the crypto market.
post-image
BTC-0.67%
market update on gate
live-cover
LIVE2,284
Trenches
mihao
m
bade
b
mihao
4Cxj...pump
Market Cap
$.
Change
.
24h Vol
$.
Holders
.
AGT
A
bade
b
AGT
0x5d...e274
Market Cap
$.
Change
.
24h Vol
$.
Holders
.
FOOD
F
bade
b
FOOD
FTu5...pump
Market Cap
$.
Change
.
24h Vol
$.
Holders
.
IDOL
I
bade
b
IDOL
0x3b...ab07
Market Cap
$.
Change
.
24h Vol
$.
Holders
.
AI
A
bade
b
AI
2T56...pump
Market Cap
$.
Change
.
24h Vol
$.
Holders
.
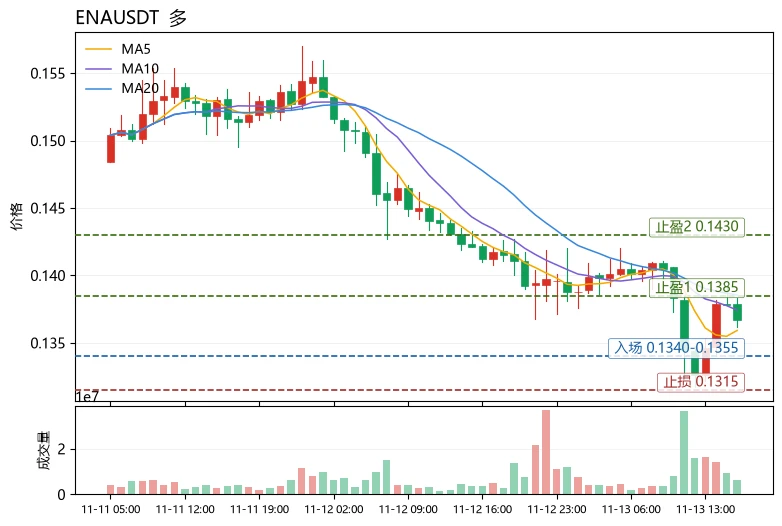
Steadily stacking wins, using stop-losses and not holding losing positions—doesn’t that deserve some support from my bros?
post-image
$ENA Current price: 0.1367. The Bollinger midline at 0.1430 is the first resistance, while the lower Bollinger band at 0.1341 is short-term support. Compared with peers in the same sector, $ENA 's 24h decline of 3.39% is notably smaller than $ETH 's 5.71%, and its RSI of 39.7 is also higher than $ETH 's 26.9. Its relative resilience amid extreme fear (index: 20) is the key point to watch. Technically, MA5 at 0.1359 has moved above the current price and is approaching MA20 at 0.1385, with the moving averages converging ahead of a potential move. The MACD histogram has turned positive at +0.000
post-image
ENA+8.04%
ZEC+1.16%
Why Do False Breakouts Sometimes Happen After Prices Break Through Resistance?

In crypto markets, when prices break through key resistance levels, traders are often drawn in to chase the rally. But sometimes, prices quickly fall back into their previous range just after breaking through, leaving traders who entered at a disadvantage. This phenomenon is known as a false breakout and is one of the key risks traders need to identify.

First, what is a false breakout?

A false breakout occurs when prices briefly break through an important support or resistance zone but fail to hold beyond it, the
post-image
#BTCDown4%
Bitcoin’s Fall Below $70,000 Signals a Deeper Shift in Market Sentiment — The Next Move Could Define Its Short-Term Direction

Bitcoin’s decline below $70,000 marks an important turning point in the current market structure. After trading considerably higher just days ago, the leading cryptocurrency is now testing price levels that could determine whether this correction develops into a deeper downturn or becomes the foundation for a recovery.

What makes this decline particularly significant is the combination of macroeconomic pressure, weakening institutional demand, and deterior
post-image
BTC-0.67%
$BTC
To prove I can crank leverage up to 200x
To prove I’m not just a 10U warrior
To prove I can nail the bottom
To prove I can do it
BTC-0.67%
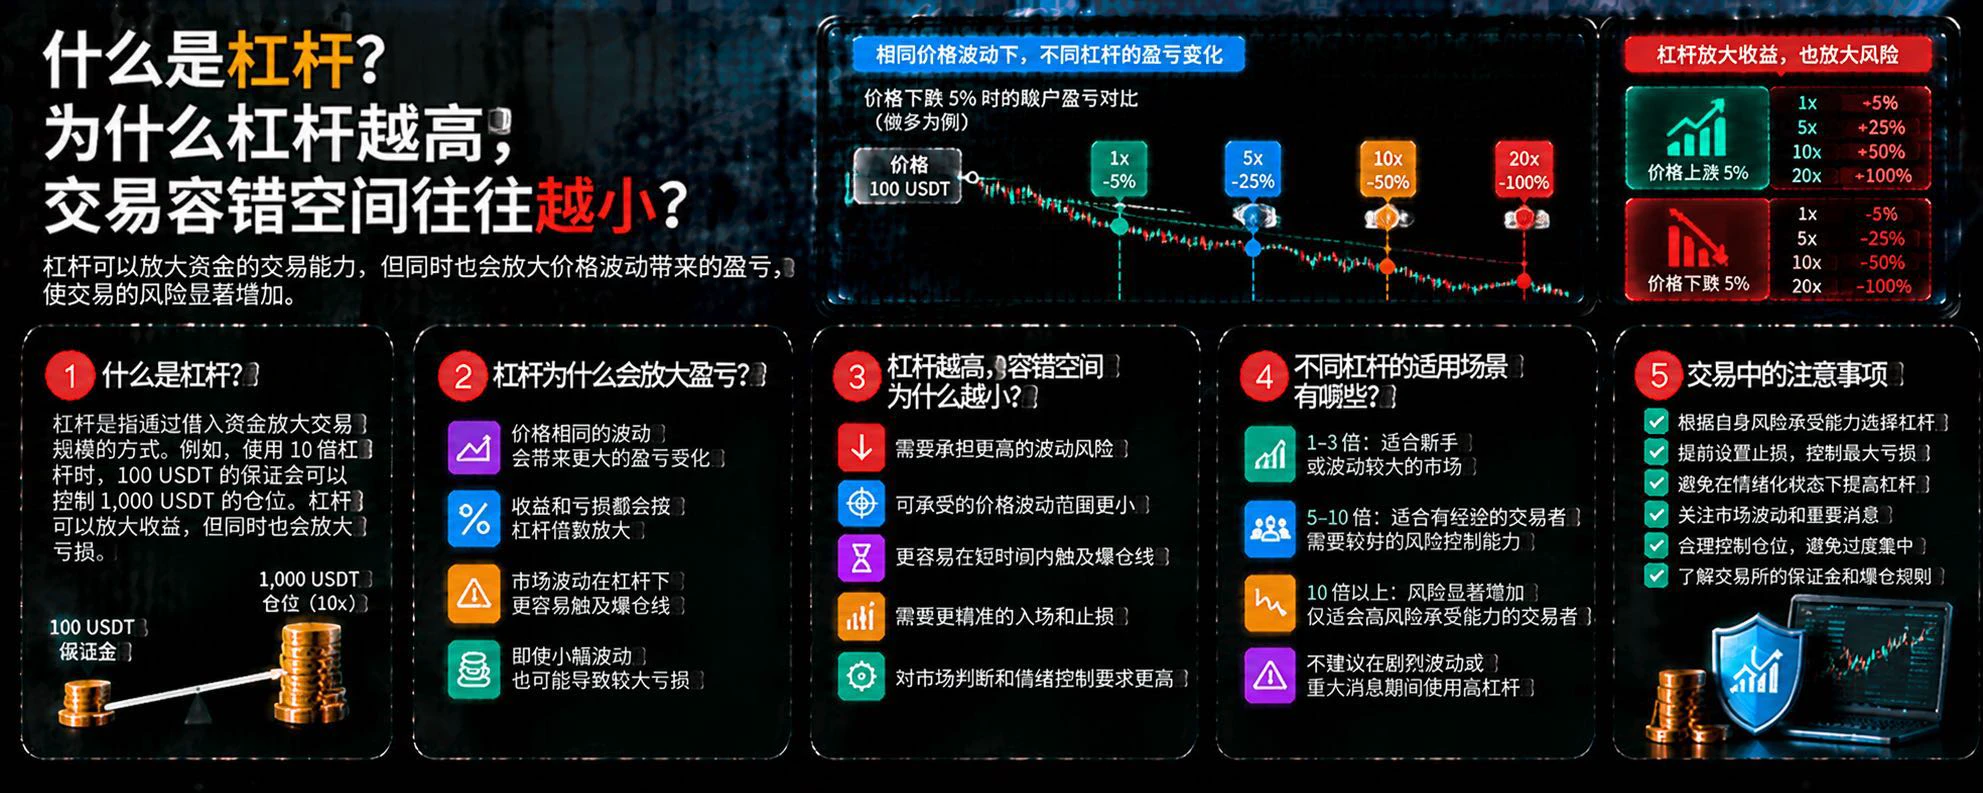
What Is Leverage? Why Does Higher Leverage Often Leave Less Room for Error?

In cryptocurrency trading, leverage allows traders to control larger positions with less margin, but it does not make market risk disappear. On the contrary, the higher the leverage, the greater the impact a price move of the same size typically has on margin.

First, what is leverage?

Leverage is a way to control a larger trading position using margin. For example, all else being equal, with 10x leverage, 100 USDT in margin can be used to open a notional position of about 1,000 USDT. But this does not mean the maxim
post-image
What Is Breakout Trading? How Can You Tell Whether Price May Continue Trending After Breaking a Key Level Rather Than Falling Into a False Breakout?

In the cryptocurrency market, when prices break through important resistance or fall below key support, they often attract considerable attention from traders. Some choose to enter in the direction of the trend, hoping to catch the start of a new trend; others suffer losses from chasing prices amid false breakouts. What really matters is not whether the price crosses a line, but whether the breakout receives further confirmation from the market.
post-image
Why do breakouts still fail when the technical setup is clearly in place?

The price breaks through resistance, volume rises at the same time, and the price even climbs again after a retest—from the chart, it seems every condition is met. But before long, the price suddenly reverses and falls back into its original range.

Why can a seemingly perfect technical setup still fail?

Because technical analysis provides probabilities, not guarantees about the future.

First, key levels do not mean the market will necessarily react as expected.

Resistance and support levels are reference zones for a
post-image
Gold continues to attract capital. Why hasn’t Bitcoin risen in tandem?

An interesting phenomenon has emerged in financial markets recently: Gold and Bitcoin are both seen by some investors as alternative assets outside the traditional financial system, yet their capital flows have diverged significantly.

According to data released by the World Gold Council on November 5, global physically backed gold ETFs saw net inflows of approximately $2.7 billion in October 2026, marking their fourth consecutive month of net inflows. Global gold ETF holdings increased by 19 tons to 4,275 tons, setting a
post-image
GLDX-0.40%
PAXG+0.37%
BTC-4.39%
Bitcoin Market Watch: Important BTC Levels and Upcoming Macro Data

Bitcoin continues to attract attention from traders and investors around the world. The crypto market can change quickly, especially when important economic data is released. This is why every trader should keep an eye on both Bitcoin's price action and global economic conditions.
Upcoming macroeconomic reports, including inflation data, PPI figures, and employment reports, can influence market sentiment. If inflation remains high, investors may expect interest rates to stay higher for longer. This could create pressure on ris
post-image
BTC-0.67%
What Is Trading Signal Confluence? Why Do Multiple Indicators Giving Similar Signals Still Not Guarantee a Successful Trade?

In cryptocurrency trading, traders often use moving averages, RSI, MACD, trading volume, and support and resistance analysis at the same time. When multiple signals point in the same direction, many assume the probability of a successful trade must be higher. But having more signals does not mean there is sufficient evidence, nor does it mean the market outcome is already certain.

First, what is trading signal confluence?

Trading signal confluence is when different an
post-image
If all employees’ appeals succeed, Jensen Huang returns, and the stock makes a V-shaped reversal, anyone who bought the dip a few days ago will never have to worry about being poor again.
All NVIDIA employees, keep it up!
post-image
NVDA-4.49%
  • 1
$BTC
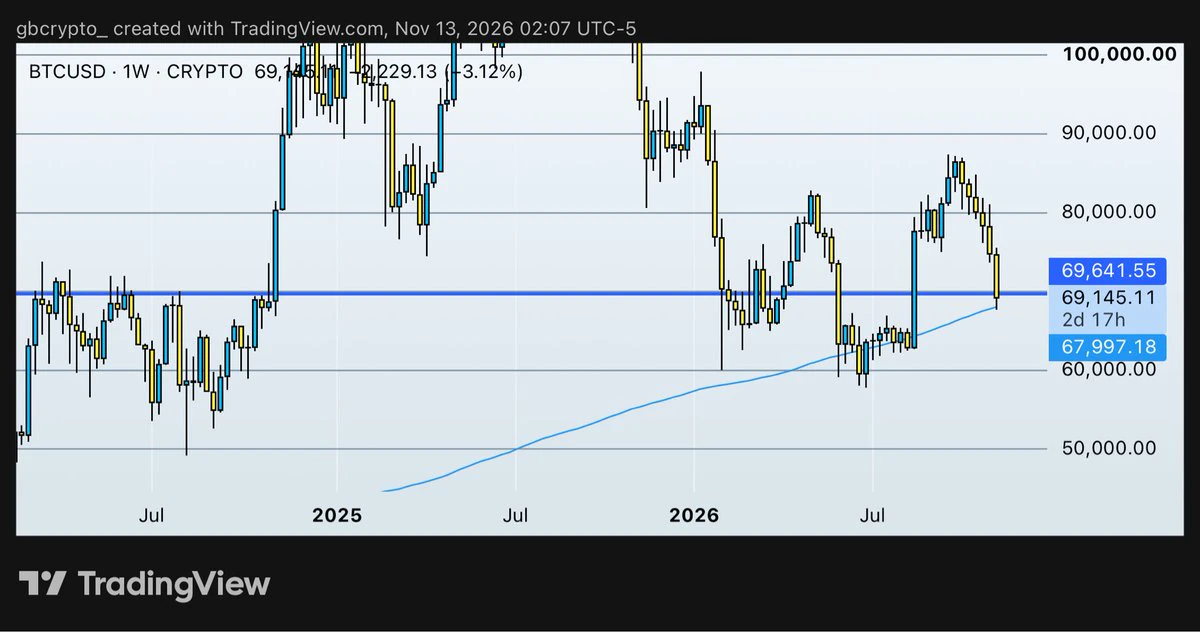
If we’re going to see a complacency-driven relief rally, this is arguably where it needs to materialise.
Six consecutive weekly red candles, a test of the weekly 200 MA, and price now trading directly into a key weekly support zone.
The conditions for a reaction are there. Bulls need to capitalise.
post-image
BTC-0.67%
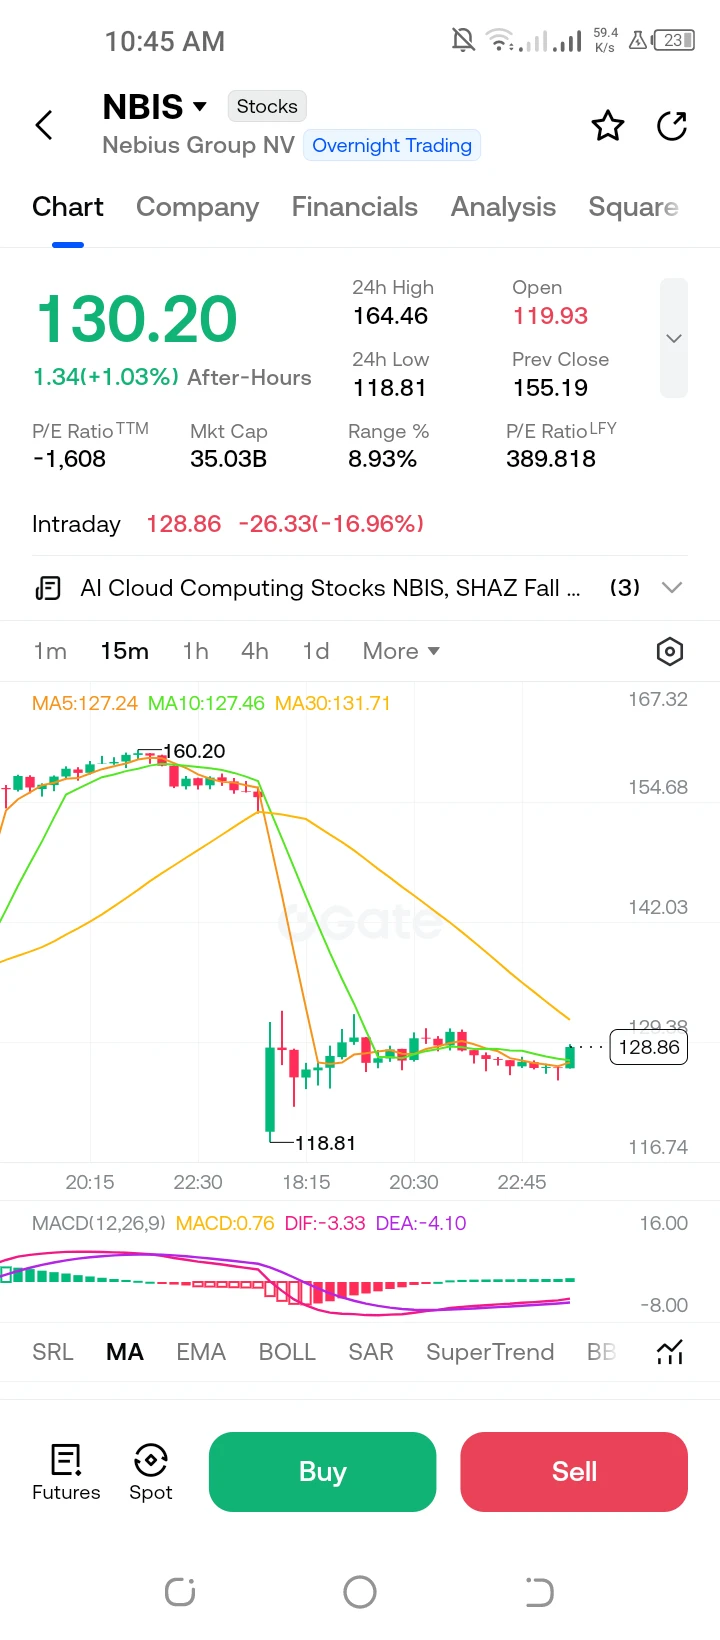
**$NBIS /USDT Perp – "Heavy Breakdown – Short"**
Short Trading Plan $NBIS
Entry: 130.20
SL: 142.03
TP1: 126.00
TP2: 118.81
NBIS plunged -16.96% from its high of 160.20. MACD is deeply bearish, with a retest of the 118.81 low in sight.
post-image
NBIS-3.14%
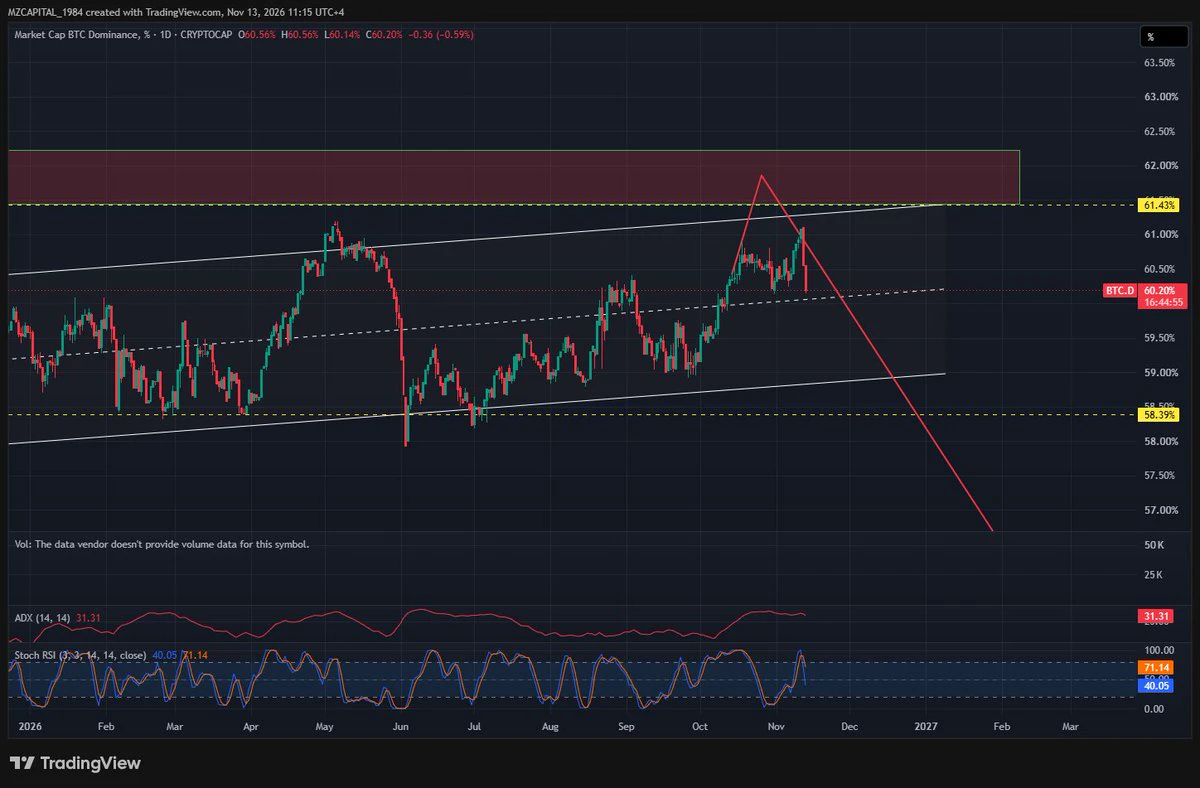
🚨 $BTC .D plunged sharply!!! Is altcoin season starting?
OF COURSE NOT!!!!!
It would be wrong to immediately interpret this drop in Bitcoin dominance as the start of altcoin season. $BTC It increased its dominance as it rose from 67K to 75K. Now it’s giving back some of the share it gained during that rally.
So, which projects could stand out when a real altcoin season begins?
I’m taking another close look at the 5 projects that make up the largest share of my portfolio:
🔹 $INJ
🔹 celestia:native
🔹 $ETHFI
🔹 $AVAX
🔹 ethereum:0x57e114b691db790c35207b2e685d4a43181e6061
We’ll examine each one
post-image
BTC-0.67%
INJ-1.67%
TIA-0.60%
ETHFI+1.48%
AVAX-0.10%
The fear index plunged to 20, and the market couldn’t even manage one decent relief bounce.
$BTC wicked down to 68307, with the maximum intraday drawdown nearing 7%; $287 million in positions was wiped out within an hour, 97% of them longs. ETFs have seen net outflows for 6 consecutive days, with over $2 billion quietly pulled out. 69000 is now a hurdle; if it can’t reclaim that level, keep an eye on 67000 and 65000.
$ETH also failed to hold 2000, bottoming near 1922. It’s down nearly 15% over four weeks, and ETFs have bled for 5 consecutive days. 2000 has turned from a floor into a ceiling;
post-image
BTC-0.67%
ETH-1.26%
ZEC+1.16%
Gold Market watch
live-cover
LIVE2,265
This is what it means to be clear-eyed in a world gone mad.
When you think everyone else is drunk and you’re the only one sober,
you may well be living in an information bubble.
post-image
Load More

Join 40 M users in our growing community

⚡️ Join 40 M users in the crypto craze discussion

💬 Engage with your favorite top creators

👍 See what interests you

Trending Topics

JensenHuangResigns

510.8K Views7.9K Discussing

Jensen Huang has resigned as NVIDIA CEO and stepped down from the board. CFO Colette Kress will serve as interim CEO while NVIDIA considers internal and external successors. $NVDA fell more than 10% in premarket trading following the announcement. With one of AI’s most influential leaders stepping aside, markets are now reassessing NVIDIA’s leadership stability, AI strategy, and long-term valuation.

GateIPOAccessAnthropic

277.4K Views2.6K Discussing

Dr.HanOxfordUnionSpeech

144.1K Views423 Discussing

View More