
Square
Following
Hot
News
Notifications
Profile
Share your thoughts
placeholder
Article
Wait, is Ao Ying really a crypto legend? A trading genius?? I heard a guy made 1 million U by following his trades with just 10,000 U half a year ago. That's unbelievable...$ZEC
post-image
ZEC+1.16%
  • 1
$DODO Buyers are driving a new rally! $DODO has broken out of a long-term consolidation range and is showing strong bullish momentum on the 4-hour chart. The price is currently testing $0.0328; if it breaks through, it may climb further to $0.0350. Entry: $0.0320–$0.0326 Take profit: $0.0350 Stop loss: $0.0300 Buy and trade $DODO
post-image
DODO+11.43%
Trenches
mihao
m
bade
b
mihao
4Cxj...pump
Market Cap
$.
Change
.
24h Vol
$.
Holders
.
IDOL
I
bade
b
IDOL
0x3b...ab07
Market Cap
$.
Change
.
24h Vol
$.
Holders
.
FOOD
F
bade
b
FOOD
FTu5...pump
Market Cap
$.
Change
.
24h Vol
$.
Holders
.
Sakura
S
bade
b
Sakura
9sFG...pump
Market Cap
$.
Change
.
24h Vol
$.
Holders
.
AGT
A
bade
b
AGT
0x5d...e274
Market Cap
$.
Change
.
24h Vol
$.
Holders
.
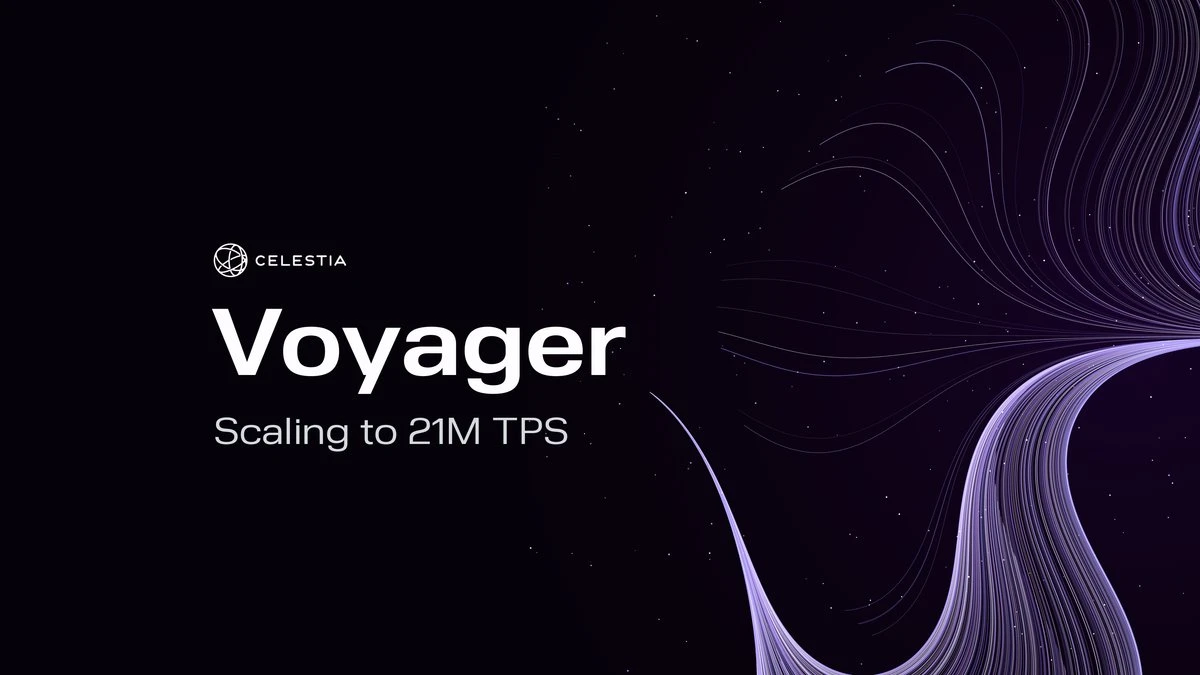
celestia’s voyager achieves 21m+ transfers per second in benchmarks across 100m accounts, showcasing its high-performance blockchain architecture. still under development.

\#CELESTIA #TPS $GATE
post-image
TIA-0.60%
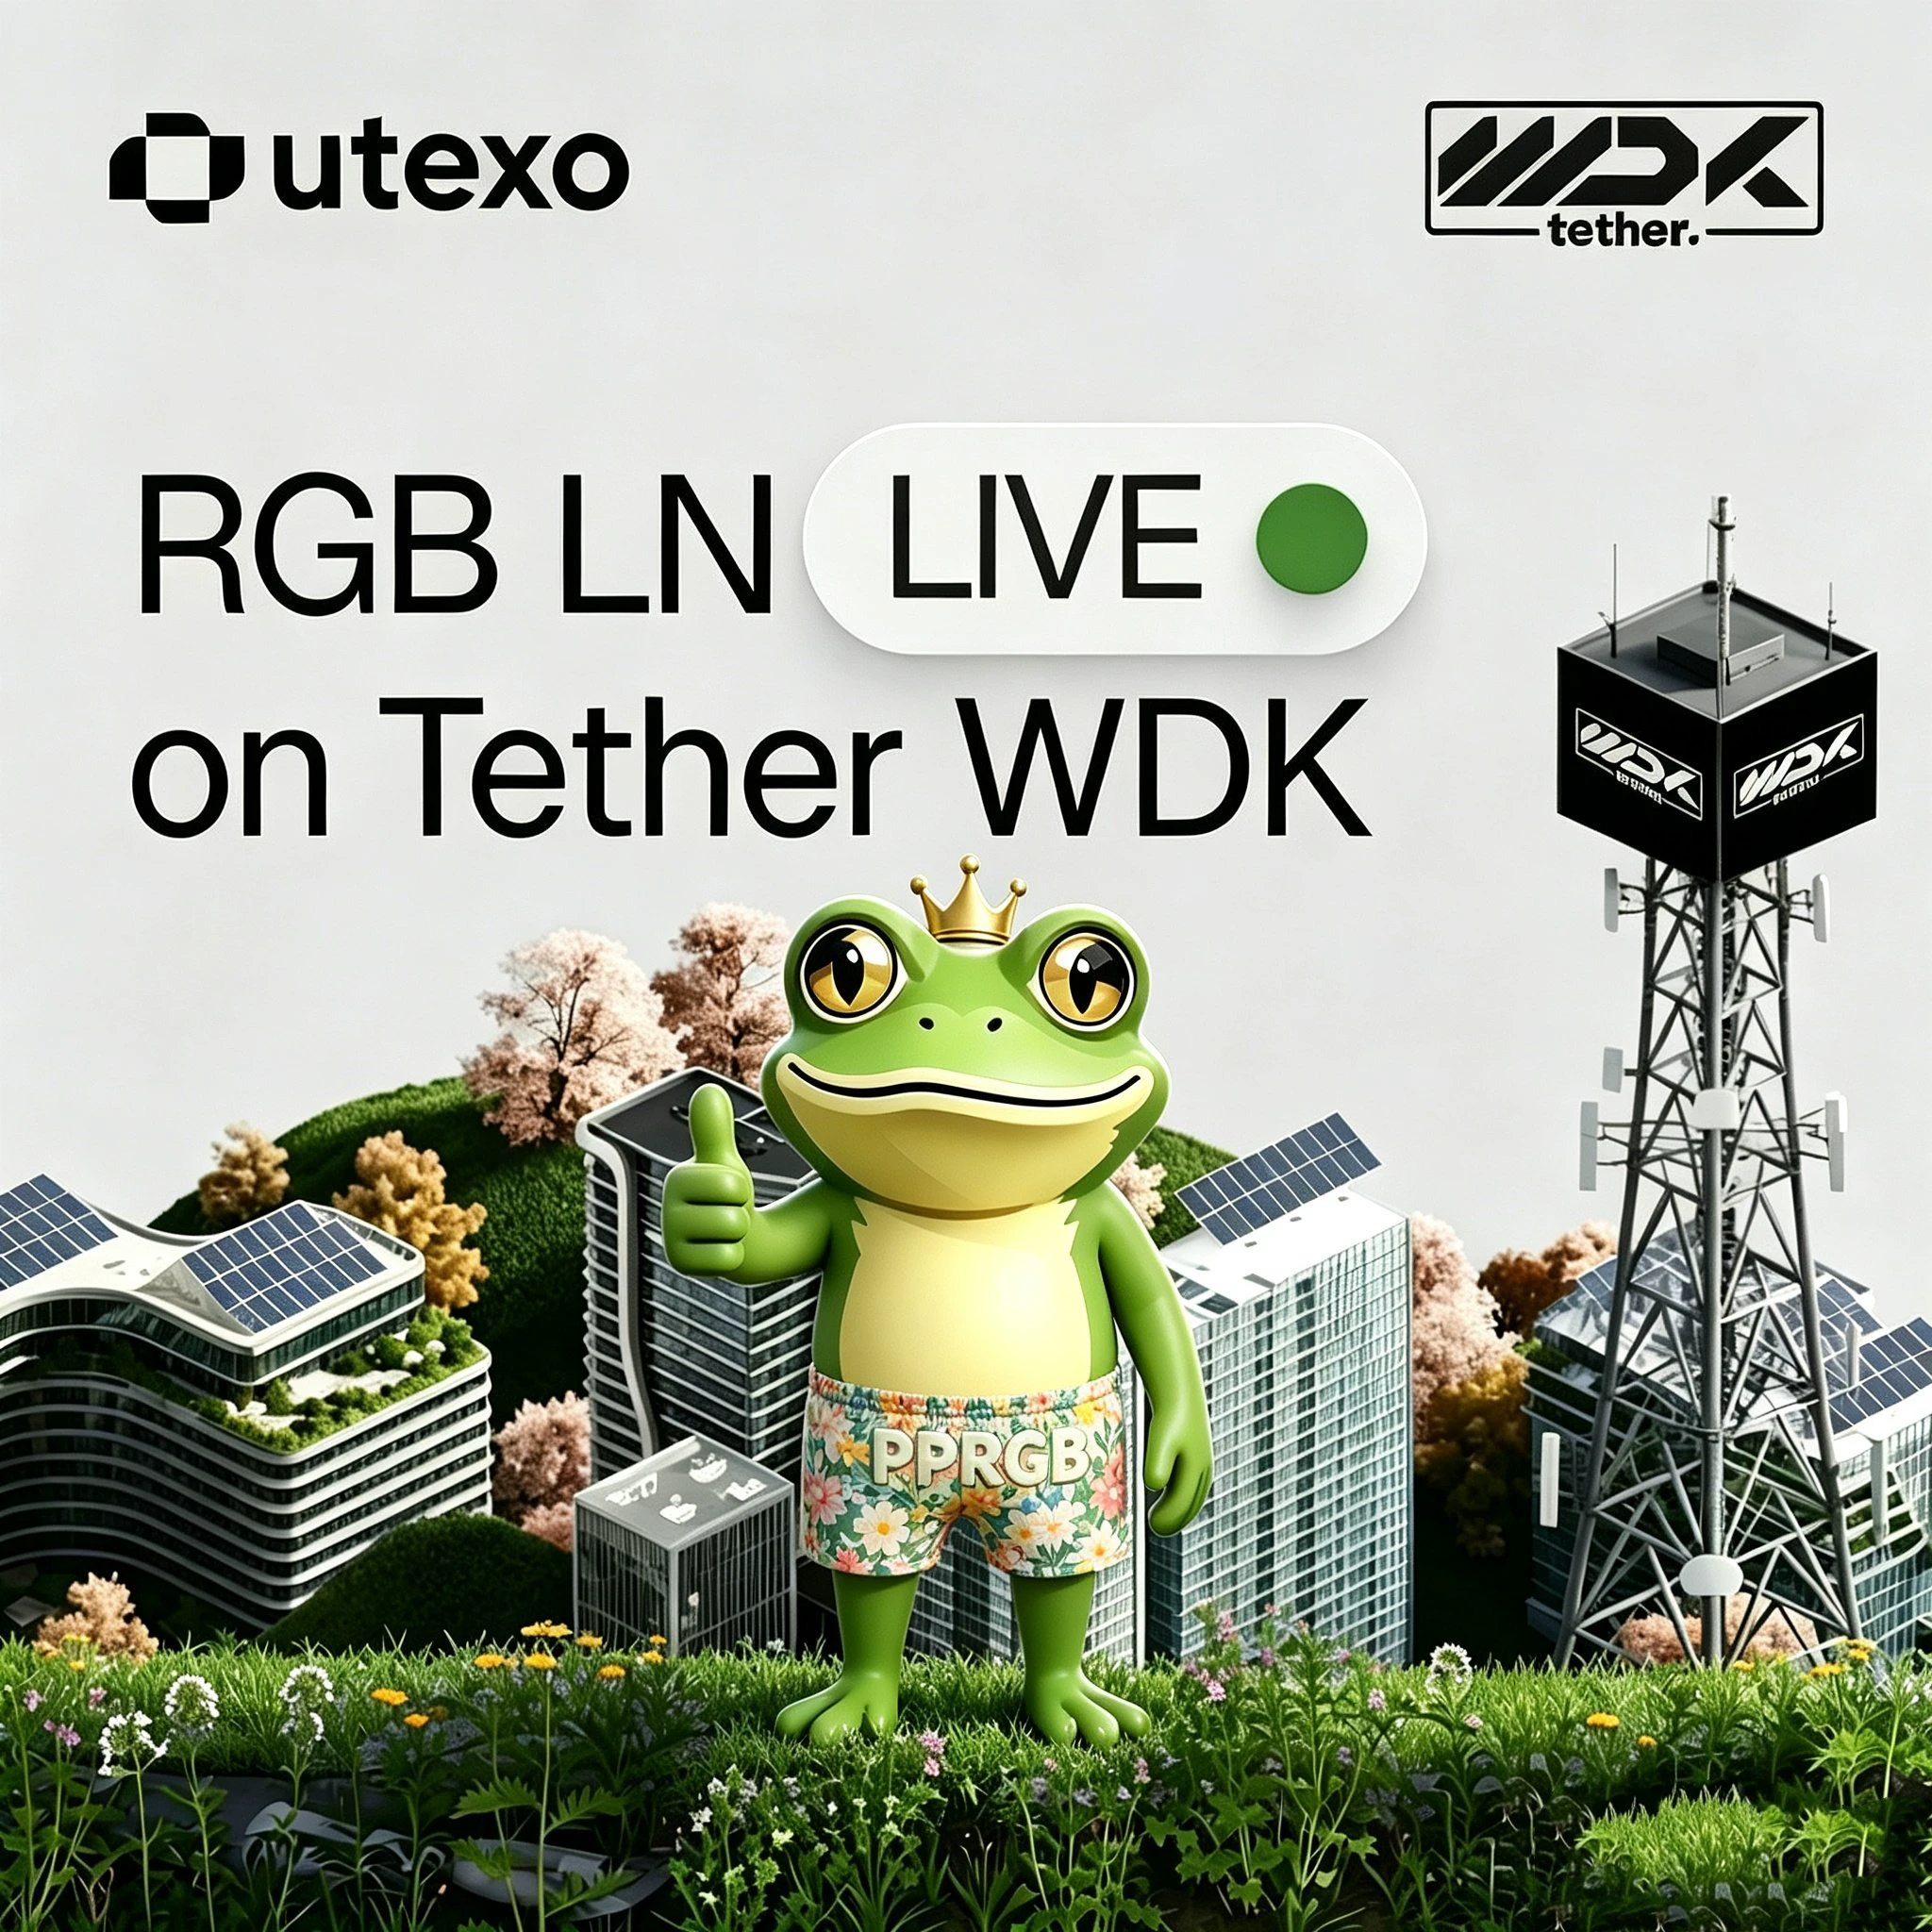
$LN I don't care, I'm going for UTEXO. Anyway, I want to buy some LN because it's an RGB protocol asset. I want to buy even more PPRGB because it's the leading protocol asset, and people are scrambling for the limited supply! Haha!
post-image
LN-0.49%
solana:5d3fjPDdkYbtYcAMR9PC2TANaEyhzuyP8JxTEwqjVgBZ is now live on solana through sunrise, expanding its accessibility across the solana ecosystem.
solana:5d3fjPDdkYbtYcAMR9PC2TANaEyhzuyP8JxTEwqjVgBZ $SOL #GATE
post-image
SOL-0.77%
How to Identify a False Breakout? Avoid Getting Trapped in a Bull Trap!

In BTC trading, one of the market moves most likely to mislead traders is a false breakout. The price suddenly breaks through an important resistance level, and when many people see the candlestick surge rapidly, they assume a new uptrend has begun and rush to go long. However, the price soon falls back into its previous range, leaving those who bought at the top at an immediate disadvantage.

So, how can you identify a false breakout?

First, check whether trading volume confirms it. A genuine, strong breakout usually ne
post-image
BTC-0.67%
I synced a legendary trader’s trades!
Note: synced, not copied!
Uncle Sam’s every move will be followed in milliseconds!
Technology changes destiny!
post-image
Hey @grok
Who is the best candidate for the next presidential sit In Nigeria
And give reasons
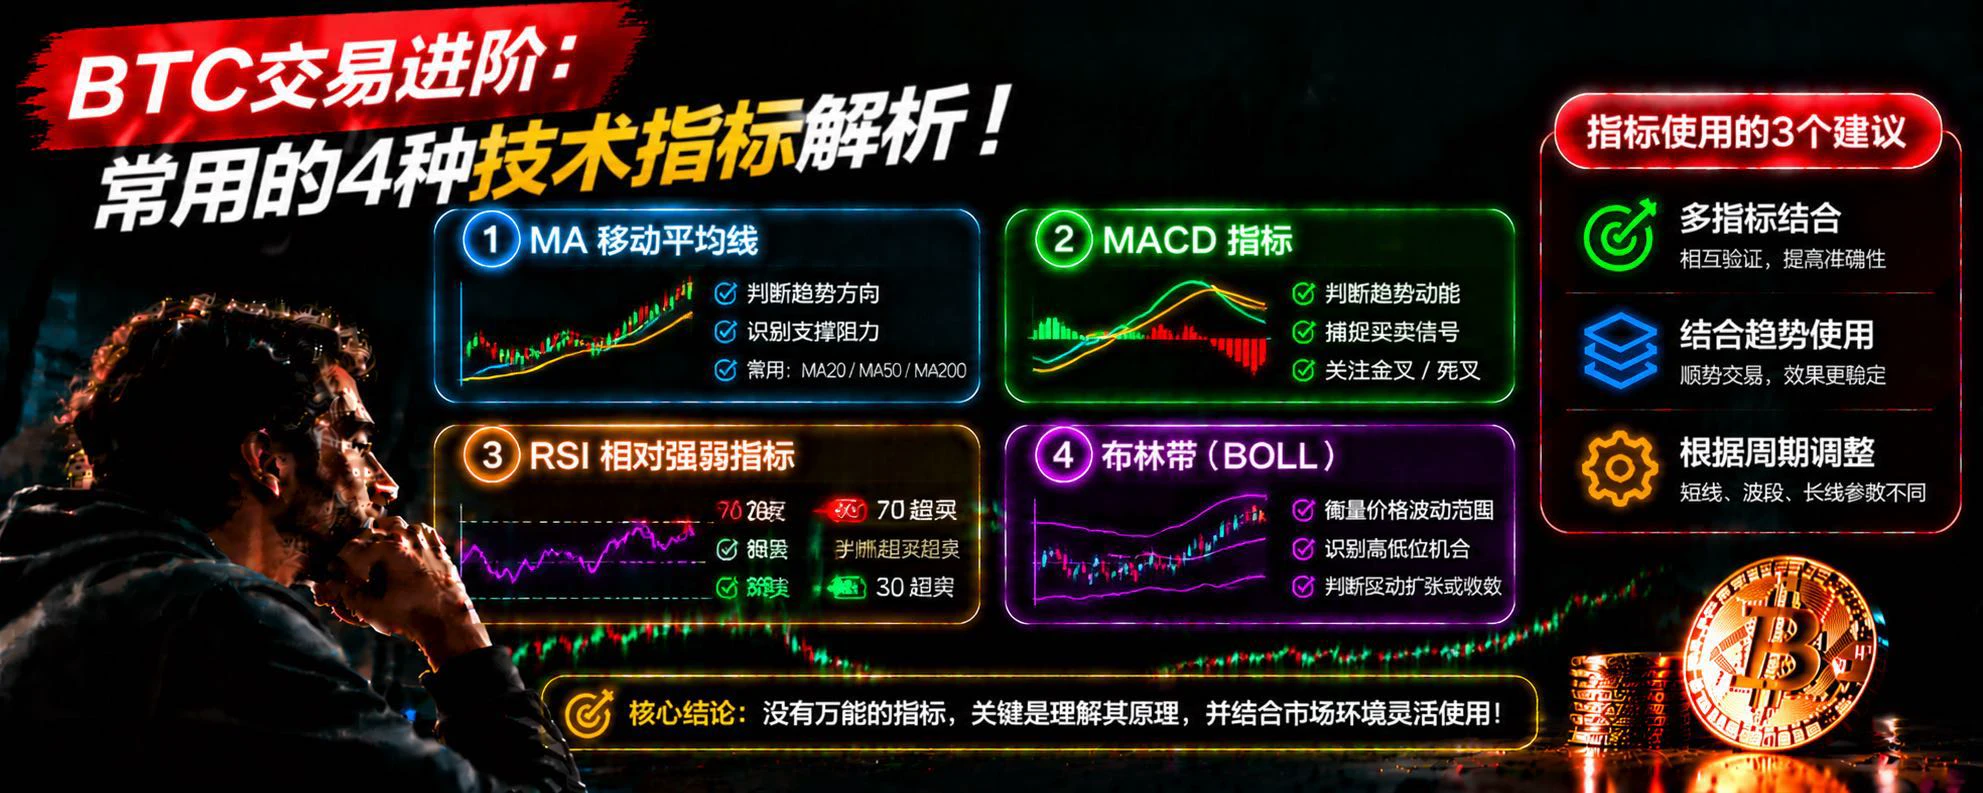
Multiple indicators give conflicting signals in BTC trading—which should you trust?

In BTC technical analysis, many traders are used to relying on MA, MACD, RSI, and Bollinger Bands at the same time, hoping to improve their accuracy by using multiple indicators. But in actual trading, a common situation is that MA shows an upward trend, RSI has already entered overbought territory, and MACD shows signs of weakening momentum. So should you go long or short?

First, prioritize market structure. Technical indicators are only auxiliary tools; price itself is the market’s most direct feedback. If
post-image
BTC-0.67%
$ENA is currently at 0.1311, down 4.72% over 24H (range: 0.1282–0.1427). The 1H trend is weak, with an RSI of 37; the 4H trend is weak, with an RSI of 23. The direction may become clearer if the price holds above the 0.1427 resistance or breaks below the 0.1282 support. Volume is only 0.24x, so participation needs confirmation. Market volatility is high; for observation only.
post-image
ENA+8.04%
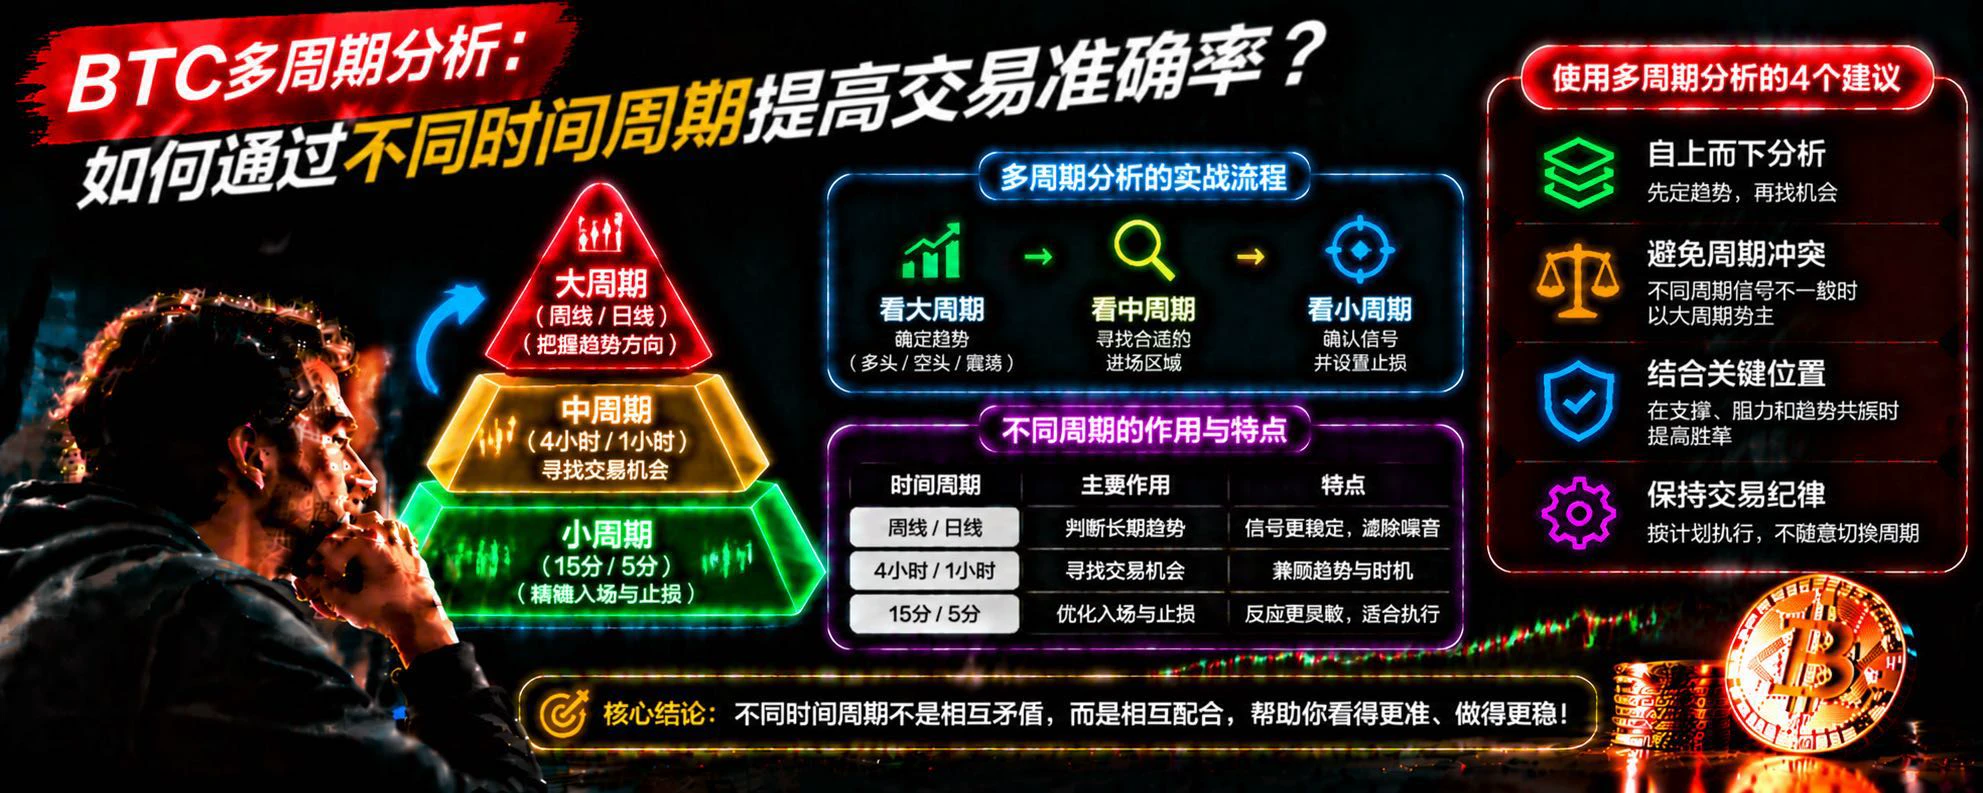
BTC Multi-Timeframe Analysis: How Can Different Timeframes Improve Trading Accuracy?

In BTC trading, many people are used to watching 15-minute or even 5-minute candlesticks for buying and selling opportunities, but overlook an important point: short-term price fluctuations do not necessarily reflect the market’s true trend direction.

Why do some people end up losing money even when they correctly read the short-term trend? One important reason is that they fail to make an overall assessment using different timeframes.

First, use higher timeframes to determine the trend. You can observe BTC
post-image
BTC-0.67%
market Bull or Bear
live-cover
LIVE2,601
Still debating whether methane reduction in Africa is worth investing in? The direction is already clear. Emissions cuts aren’t just a money pit—they turn climate commitments into real money in gas, power, and agriculture. Whoever gets capture and utilization working first will be first to benefit. Looking at past cycles, every energy transition starts with a frustrating stretch of sideways movement before paying off. It takes patience. Let’s see how things look this weekend and compare notes then.
post-image
  • 2
How to Build a Complete Trading System for BTC: 5 Key Steps from Analysis to Execution!

In BTC trading, many people study the market every day, learn various technical indicators, and constantly look for new trading strategies. But why, despite learning so much, are they still unable to keep their accounts stable? One important reason is the lack of a complete, repeatable trading system.

Effective trading should not depend on snap judgments; it should follow clear rules.

First, establish a market analysis framework. Before each trade, start by observing BTC’s higher-timeframe trend and use
post-image
BTC-0.67%
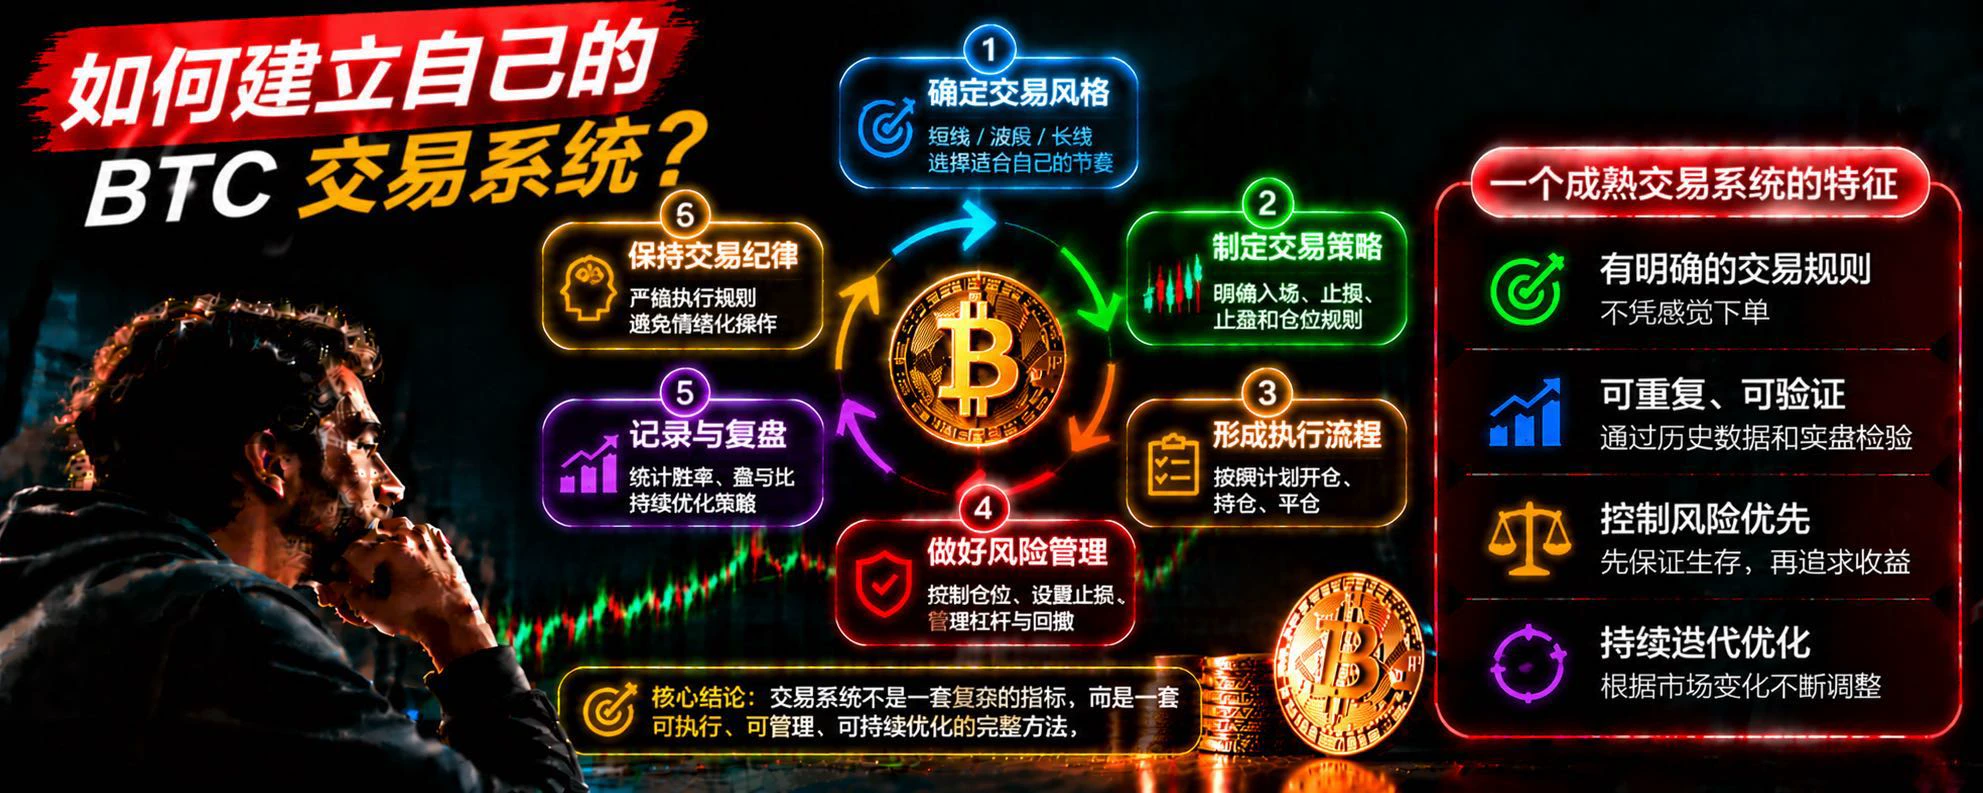
How to Build Your Own BTC Trading System: From Random Trading to Consistent Execution

In the BTC market, many people study new technical indicators every day: MACD today, RSI tomorrow, then a new trading strategy the day after. But despite learning a lot, they still have no clear rules when it comes time to place a trade, and end up stuck in a cycle of repeated losses and constantly changing their approach.

To change this, the first step is to build a trading system of your own.

First, choose your trading style. Based on your available time and risk tolerance, choose short-term, swing, or l
post-image
BTC-0.67%
In BTC trading, many people see the price break through an important resistance level and immediately chase the rally, worried about missing the move. But experienced traders often pay attention to another important signal after a breakout: the retest.

Why is a retest after a breakout worth watching?

First, it helps verify whether the breakout is valid. After the previous resistance level is broken, it may turn into new support. If the price pulls back to this area but does not break significantly below it, that may indicate the market is reassessing the level’s role as support.

Second, it
BTC-0.67%
Recently, I’ve noticed that quite a few people are still worried about the positions they hold.

Market ups and downs are normal, and unrealized losses in your account don’t mean there’s no room to respond. #10月PPI低于预期

The market changes every day. The real challenge isn’t waiting, but knowing how to adjust your approach.

Sometimes, looking at the market from a different angle may lead to new insights. $ETH

If you have some time, feel free to share your positions in the comments. Brother An can offer ideas for dealing with different coins. $BTC
post-image
ETH-1.23%
BTC-0.65%
Are these media outlets talking out of their asses?
post-image
BTC Trading Psychology: How to Control Greed and Fear?

In BTC trading, many people don’t lose to the market—they lose to their own emotions. Even with a trading plan in place, they often chase prices after a sudden rise and panic-sell after a brief dip. Repeating this pattern again and again makes it difficult to achieve ideal trading results, even with strong technical analysis skills.

First, beware of greed. When BTC rises continuously, many people fear missing out and start chasing prices higher, even adding to their positions beyond their original plan. But a rising market doesn’t mean p
post-image
BTC-0.65%
Load More

Join 40 M users in our growing community

⚡️ Join 40 M users in the crypto craze discussion

💬 Engage with your favorite top creators

👍 See what interests you

Trending Topics

GateIPOAccessAnthropic

305.3K Views2.8K Discussing

Gate IPO Access Phase 3 features Anthropic (ANT), with USDT subscription interest starting from 100 USDT. Successful allocations will be delivered as real shares to Gate Stock Accounts. Indicative price: $70–$78/share Subscription: Nov 12–17 (UTC+8) Allocation is not guaranteed. Please manage risk accordingly.

Dr.HanOxfordUnionSpeech

147.2K Views586 Discussing

USOctoberPPIBelowExpectations

461.1K Views1.4K Discussing

View More