Share your thoughts
placeholder
Article
$SIGN SIGN/USDT | H1 | OVERHEAT ZONE TESTING BEFORE A PULLBACK
TP1: $0.010229 (+1.37%) │ TP2: $0.010087 (+2.74%)
SL: $0.010629 (-2.49%) │ R/R: 1 : 1.1
⚠ SL placed beyond the nearest candle wicks to reduce the risk of accidental stop-outs

FUNDAMENTAL BACKGROUND
SIGN is moving in conditions lacking its own project catalysts, so short-term dynamics are driven by the overall market backdrop and technical picture. The Fear and Greed Index is in the "Greed" zone (73–74), indicating continued risk appetite, but without extreme levels that could trigger a sharp reversal. Bitcoin dominance remains
post-image
SIGN+0.29%
I originally just wanted to mooch a breakfast, but the market ended up making dumplings for me for half a year.

That overnight dip in $SKHYNIX a few days ago nearly washed me out. Luckily, before the market had fully started moving, I took a look and saw clear buying support at 1235.91. The key level held, the volume-price action was fairly clean, so I didn’t blindly hit sell along with the panic sellers.

When I opened the market this morning, it was at 1291.05, with +316.9% gains already in the bowl. This wasn’t luck—it was about getting the rhythm right. The earlier grinding action made
post-image
SKHYNIX+1.35%
SOL+4.10%
ETH+1.97%
Why is everyone still long on $LAB /USDT when the 4h chart is screaming reversal?

$LAB /USDT - SHORT

Trade Plan:
Entry: 0.07264 – 0.07304
SL: 0.07481
TP1: 0.07137
TP2: 0.07038
TP3: 0.06891

Why this setup?
- 95% confidence on SHORT, not a guess—the algo is armed.
- Daily trend is bearish; the 1h ref at 0.07284 is sitting right under a key breakdown zone.
- RSI 15m at 41.53 shows weak bounce attempts, but ATR 1h (0.000819) hints at a violent move down.
- TP1 (0.07137) is 2% away—easy pickings if sellers step in.
- Why now? The clock is ticking: momentum is fading, and the next push
LAB-1.79%
#ZEC How many of the 800-plus short positions in this wave are trapped?
post-image
ZEC+16.28%
#‌$NVDA NVDA AT $231: NVIDIA REMAINS ONE OF THE STRONGEST AI STOCKS — FULL MARKET ANALYSIS, NFP IMPACT & TRADING PLAN
NVIDIA remains one of the most powerful names in the global technology market, and in my view NVDA continues to deserve serious attention because the AI infrastructure story is far from finished. With NVDA around the $231 area, the stock is sitting in an important decision zone where momentum, fundamentals, AI demand, macroeconomic pressure and valuation are all coming together. The latest verified Friday close was approximately $230.36, after NVDA traded as high as $234.76 and
$ZEC is almost testing $1,200 after another powerful move.
My pullback plan:
Entry zone: $1,120-$1,155
TP1: $1,200
TP2: $1,280
TP3: $1,350
SL: $1,075
I would avoid chasing near resistance. A controlled retest offers a cleaner setup than buying immediately after a 17% daily gain.
#ZEC #Zcash
post-image
ZEC+16.11%
  • 6
  • 2
Everyone’s long gold at 4436—but the 4h tape just whispered a word you didn’t hear: fade.

$XAU /USDT - SHORT

Trade Plan:
Entry: 4435.35 – 4437.55
SL: 4446.97
TP1: 4428.56
TP2: 4423.31
TP3: 4415.42

Why this setup?
- 1D trend is *range*, not breakout—so buying tops here is a donation.
- RSI 15m at 52.8 shows zero momentum behind the push; we’re stalling mid-range.
- ATR 1h at 4.38 means the real move is a snap-back, not a stretch.
- SHORT bias (55%) targets TP1 4428 and TP2 4423—only 0.3% away, but that’s where liquidity sits.
- Why now? The waiting status + tight entry (4435–4437)
XAU-0.04%
KeyAlarm turns calendar keywords into real iPhone alarms that keep ringing through Silent and Focus until you stop them.
Add a keyword like Dentist once. Every matching event gets an AlarmKit alarm minutes before, including separate prep and leave alerts.
Would you let one keyword guard your whole calendar?
$XMR Signal】Go long + snipe with buying support
$XMR The order book's buy-side depth is 2.25 times the sell-side pressure, with the price at 539.32 approaching the 1H Bollinger lower band at 535.85. The 1H MACD histogram at -2.60 continues to weaken, while the 4H MACD histogram at +0.46 shows shrinking bullish momentum. The funding rate is relatively high at 0.0876%, OI is stable, and leveraged longs face interest payment pressure. 1H momentum is bearish, while 4H momentum is bullish. The price is below the 1H EMA20 at 546.49 and above the 4H EMA20 at 534.47, with the range narrowing.
🎯Direc
post-image
XMR-0.21%
BTC+0.42%
ETH+1.97%
SOL+4.12%
Wood nourished in cycles, wealth flowing endlessly
Moonlight compounds profits, water’s momentum generates wealth
Seize opportunities and momentum, secure your gains
post-image
#BTCReclaims80K
Bitcoin’s Growing Twin: Why the Gold Correlation Just Hit 0.50
Here’s a development worth paying attention to: the 90-day correlation between Bitcoin and gold has surged to +0.50.
It’s the highest level we’ve seen since the COVID-19 crash of 2020. To put that into perspective, this metric has more than doubled since the start of the year. Back in 2022, during a relatively stable post-crash recovery, that same correlation peaked at a modest +0.30.
So, what changed?
The primary catalyst appears to be a specific policy shift from the U.S. Treasury. On August 19, they announced pl
post-image
BTC+0.42%
NAS100+0.06%
$BNB BNBUSDT Analysis
BNBUSDT
Market Analysis:
The trend remains bullish as long as the price stays above the ascending trendline. Buying opportunities can be considered at key support zones, but entries require confirmation from bullish candles rather than blind execution.
Key Support & Resistance:
Key Resistance: 776 - 820 - 857
Key Support Area: 727 - 711 - 603
Trade Entry & Exit Plan:
Entry: Breakout/Pullback of trendline or key zones with >80% candle body, accompanied by confirmation candles.
Stop Loss: Behind the last wave or the last breakout candle.
Take Profit: Minimum R:R 2, with fu
post-image
BNB+0.38%
$CFX has officially broken out of the Cup and Handle structure, and the chart is starting to look seriously interesting.
The breakout confirms that buyers have pushed through the key resistance zone after a long period of consolidation.
Now the focus shifts toward the upper targets. If $CFX holds above the breakout area, bullish momentum could continue building quickly.
A clean retest and strong hold would make this move even more convincing.
Volume and momentum will be important from here. Sustained buying pressure could open the path toward the next major resistance levels.
$CFX is entering
post-image
CFX+5.34%
  • 3
Everyone’s watching DOGE bounce—but the 4h chart is quietly screaming something else.

DOGE/USDT - SHORT

Trade Plan:
Entry: 0.08966 – 0.09026
SL: 0.09284
TP1: 0.08780
TP2: 0.08636
TP3: 0.08420

Why this setup?
- Price is pinned at 0.08996, but the real story is the **range-bound 1D trend**—no momentum to break out.
- RSI (15m) at 41.85 says buyers are already exhausted, not reloading.
- The short setup is armed: entry 0.08996, TP1 at 0.08780 (−2.4%), TP2 at 0.08636 (−4%).
- Why now? The ATR (0.001199) is tight—this coil tends to snap downward when volume fades, not up.

Debate:
Are
DOGE+4.47%
Layout for Bitcoin, Ethereum, and Dogecoin
live-cover
LIVE3,291
  • 1
[New Streamer]Whales Move in Sync!
live-cover
LIVE1,816
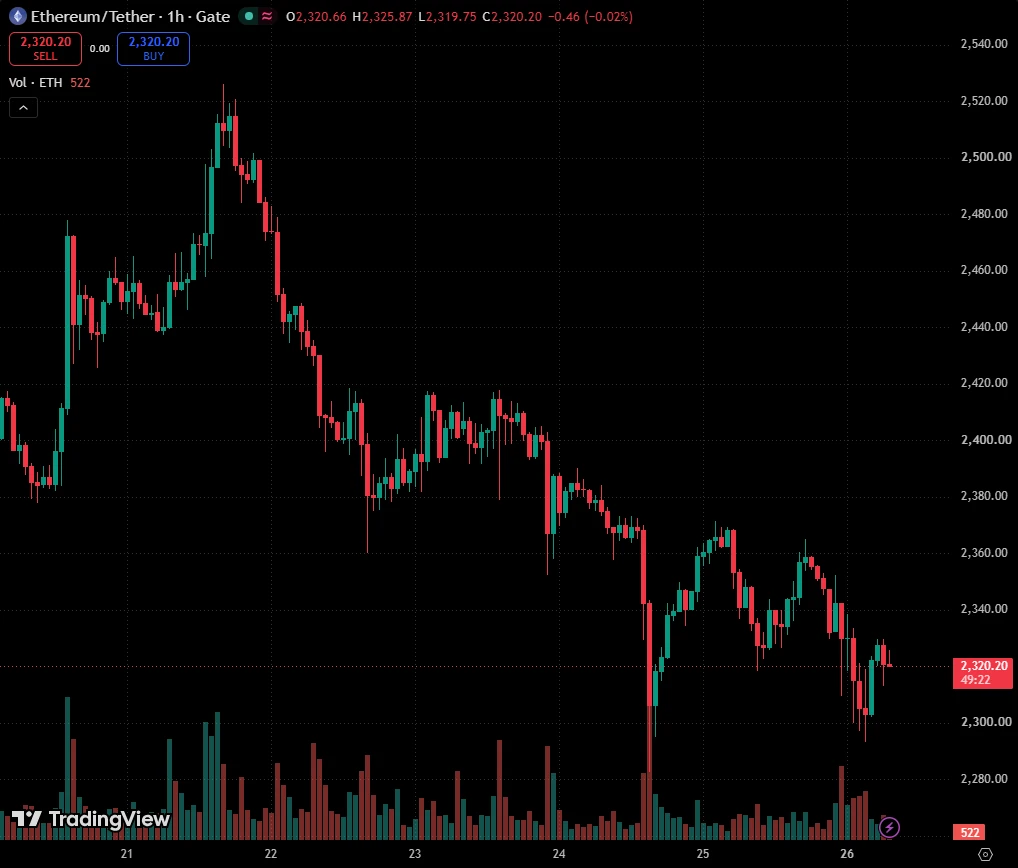
$ETH ETHUSD 1H: Range Breakout & Liquidity Sweep Reclaim (Long Setup)
1. Market Context
On the 1H chart, ETH/USDT has been consolidating inside a wide horizontal range bounded between 2,370.00 and 2,530.00 for over two weeks. After sweeping liquidity down to the 2,439.75 support floor, price is aggressively pushing back up to test and break out above the range resistance ceiling at 2,526.97.
2. Sentiment & House Trap Analysis
Where Traders Place Orders: Retail traders seeing the upper resistance boundary holding repeatedly around 2,526.97 – 2,540.00 opened SELL positions, expecting ETH to reje
post-image
ETH+1.97%
'This is my body, which is given for you; do this in remembrance of me.'
Everything I am or do is downstream of this meal. The body of Christ, given for you, for me.
Without that, I am nothing.
Have a good Sunday gents.
post-image
This ZEC is terrifyingly powerful$ZEC
post-image
ZEC+16.28%
  • 5
Everyone’s watching 54.25 on LTC—but the real trap is the 55.57 ceiling they’re not seeing.

$LTC /USDT - SHORT

Trade Plan:
Entry: 54.11 – 54.39
SL: 55.57
TP1: 53.26
TP2: 52.60
TP3: 51.62

Why this setup?
- 4H bias is SHORT with 55% confidence, yet 1D trend is *range*—that’s a coiled spring, not a crash.
- RSI 15m at 48.9 = no momentum, just chop. The 1H ATR (0.548) says moves are tiny—so why force it?
- Entry at 54.25 is armed, but TP1 at 53.26 is only 1.8% away. If we break 55.57 (SL), the alt targets flip to 55.90+ instantly.
- Why now? Because a range-bound asset with a weak SHOR
LTC+2.59%
Load More

Join 40 M users in our growing community

⚡️ Join 40 M users in the crypto craze discussion

💬 Engage with your favorite top creators

👍 See what interests you

View More