
Square
Following
Hot
News
Notifications
Profile
Share your thoughts
placeholder
Article
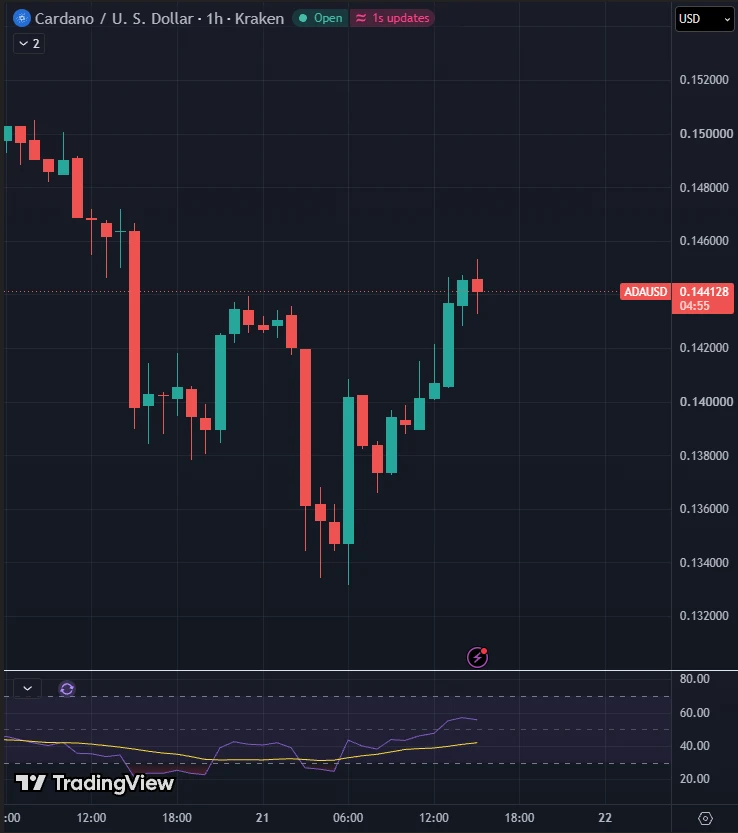
Who managed to buy $ADA at $0.13?
post-image
ADA-1.48%
  • 1
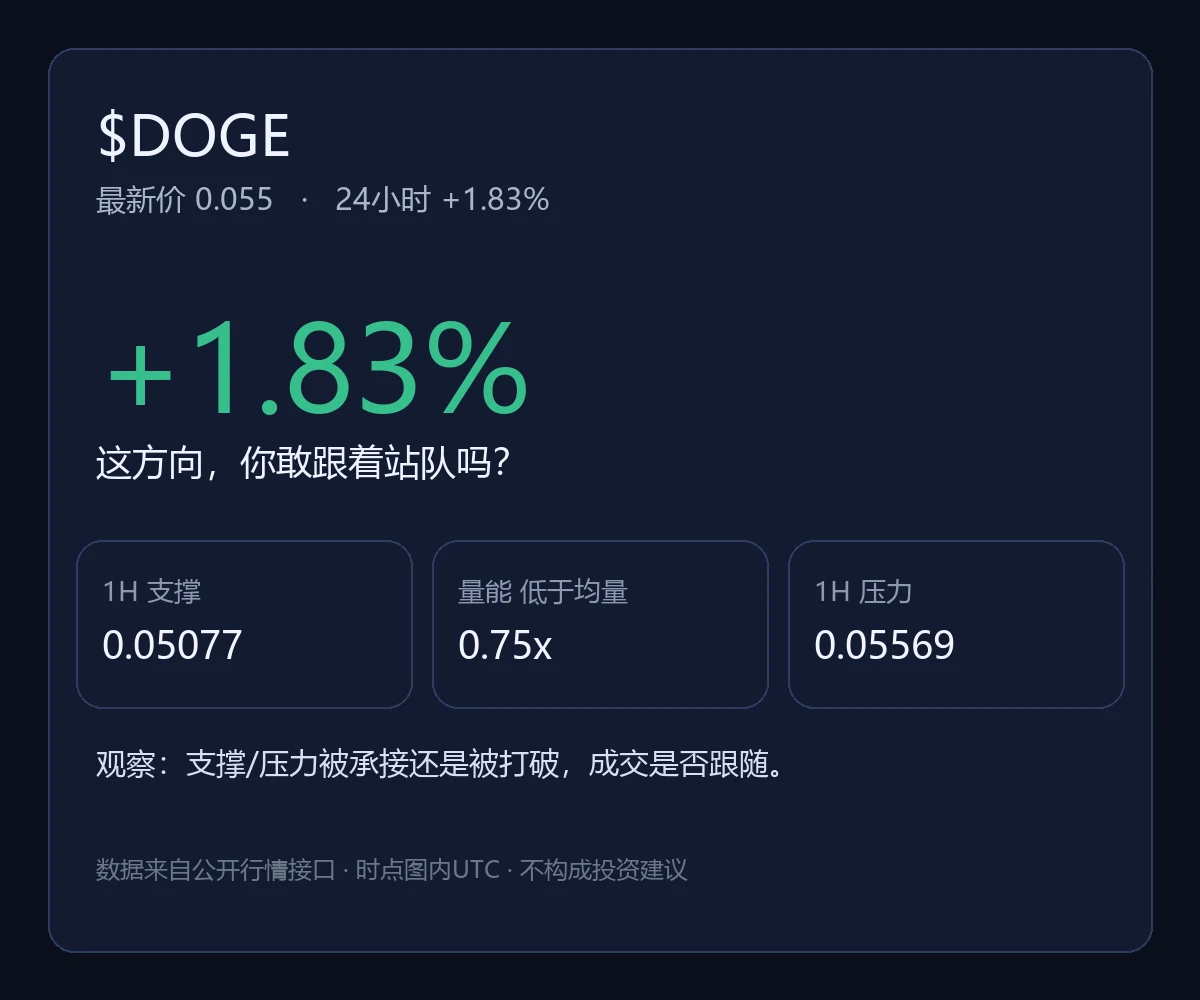
$DOGE Up 1.83%, back to 0.055. The hourly chart looks moderately strong, but the four-hour chart remains weak. RSI is simultaneously overbought and oversold, while a volume ratio of 0.75 further confirms that nobody is willing to take over. This kind of conflicting timeframes can easily trip up anyone betting in one direction, so I’ll wait for confirmation. Current price: 0.055. A break above 0.05569 counts; below 0.05077, I’ll stop out and admit defeat. Don’t expect a trend reversal until resistance is broken. If support doesn’t hold, look lower. Not investment advice.
#DOGE #狗狗币 #Cryptocurre
post-image
DOGE-0.22%
Trenches
FIONA
F
bade
b
FIONA
B34n...pump
Market Cap
$.
Change
.
24h Vol
$.
Holders
.
IDOL
I
bade
b
IDOL
0x3b...ab07
Market Cap
$.
Change
.
24h Vol
$.
Holders
.
PIEVERSE
P
bade
b
PIEVERSE
0x0e...25a9
Market Cap
$.
Change
.
24h Vol
$.
Holders
.
CLAUDIA
C
bade
b
CLAUDIA
2j5S...W2ZM
Market Cap
$.
Change
.
24h Vol
$.
Holders
.
mihao
m
bade
b
mihao
4Cxj...pump
Market Cap
$.
Change
.
24h Vol
$.
Holders
.
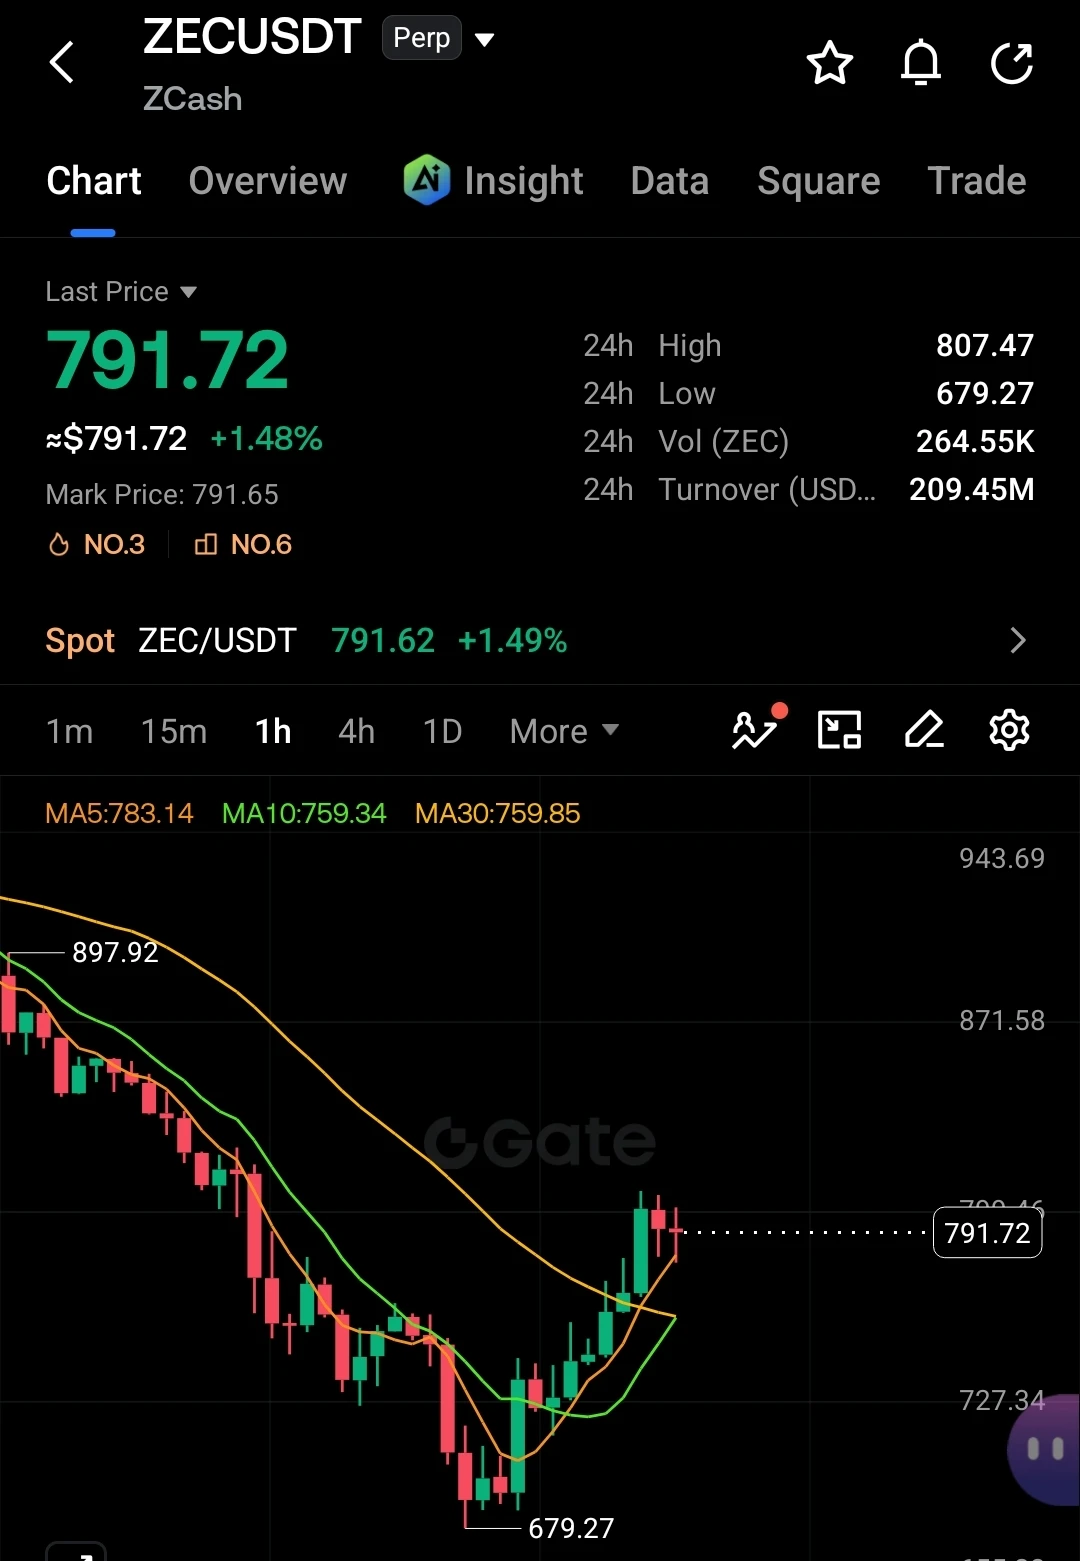
Is $ZEC preparing for another rejection? Don't underestimate the sellers here.

After bouncing from $679, ZEC is now approaching a critical resistance zone around $800–$808.

If buyers fail to break and hold above this area, another drop toward $760 and $727 could follow. A deeper sell-off could bring $680 back into focus.
post-image
ZEC+1.29%
#ShareWeekly
Dogecoin (DOGE): Can the Popular Meme Coin Make a Strong Comeback?
Dogecoin (DOGE) remains one of the most recognized cryptocurrencies, supported by its strong community, popularity, and growing payment-related interest. Its market performance is influenced by Bitcoin's direction, investor sentiment, trading volume, and broader crypto trends. DOGE could attract renewed attention if market confidence improves and buying pressure increases. However, volatility remains a major risk, and sudden price corrections are possible. Investors should monitor key support and resistance levels
DOGE-0.22%
BTC-0.67%
$BTC $55K will become a temporary bottom, but I still think there may be another pullback to $47K–$49K at some point this year. For now, the price may move sideways between
$57K and $60K, then fall again to around $47K before the next bull market begins.
post-image
BTC-0.67%
Whale adds 10.2 million in long sliver position
live-cover
LIVE1,675
BTC-0.67%
SOL-0.77%
ETH-1.26%
XRP-1.15%
USDC+0.01%
$H Wish me luck shorting the highs! I'll make back my spot losses with futures
post-image
H-2.00%
$ADA Is Strong in the Short Term but Weak on the 4-Hour Chart—Which Will Shift First?
$ADA is currently trading at 0.1445, up 2.555% over 24 hours, with an intraday range of 0.1333‑0.1456. The 1-hour chart shows strength: the price has moved above the EMA20 (0.14175), RSI14 is at 52.23, in neutral-to-bullish territory, and the volume ratio of 1.22 is slightly above average, suggesting signs of active buying support in the short term. The 4-hour chart, however, remains weak: the price is still below the EMA20 (0.14638), and RSI14 is only 35.94. While it is not deeply oversold, momentum is insuf
post-image
ADA-1.48%
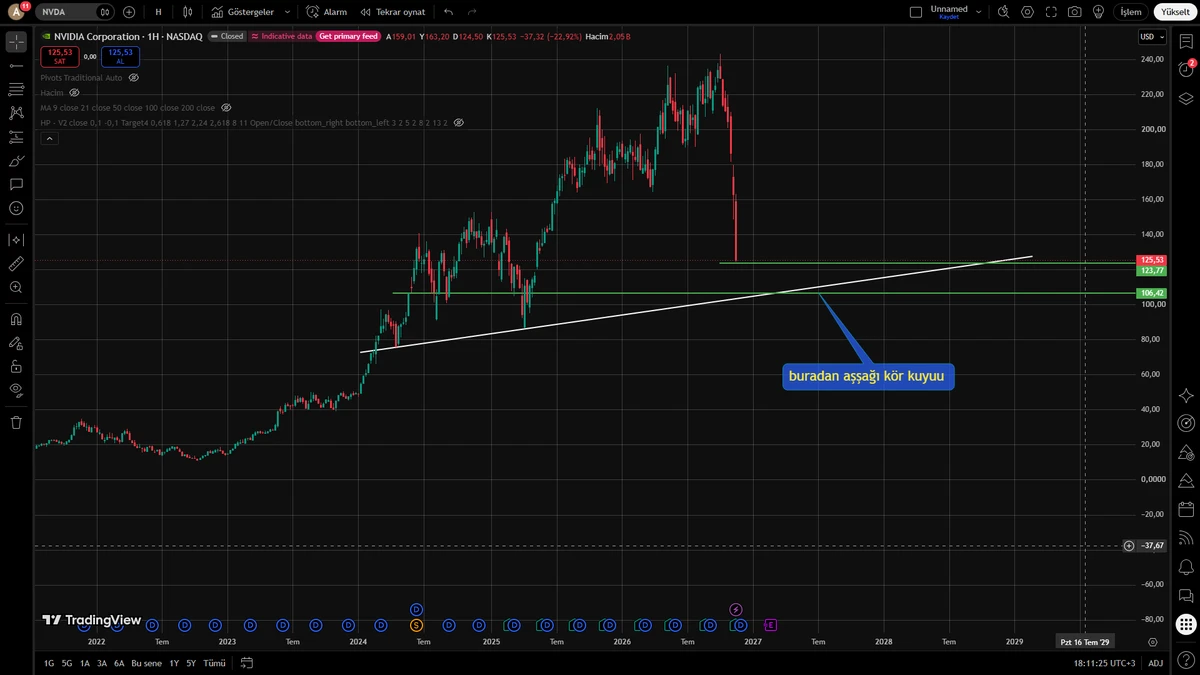
#nvda Tell Bora to keep buying; otherwise this won't stop
post-image
NVDA-13.84%
Why does this candle look like it's about to bounce, only to just drift sideways? Watching $FET struggle to find support after a steep drop is painful. We all bet it would mean-revert cleanly, but the market always likes to keep us guessing.
Other coins: $VVV : Current price 23.352 - 24-hour change: +18.66%$SOL : Current price 70.36 - 24-hour change: +2.36%
post-image
FET-1.52%
VVV+0.37%
SOL-0.77%
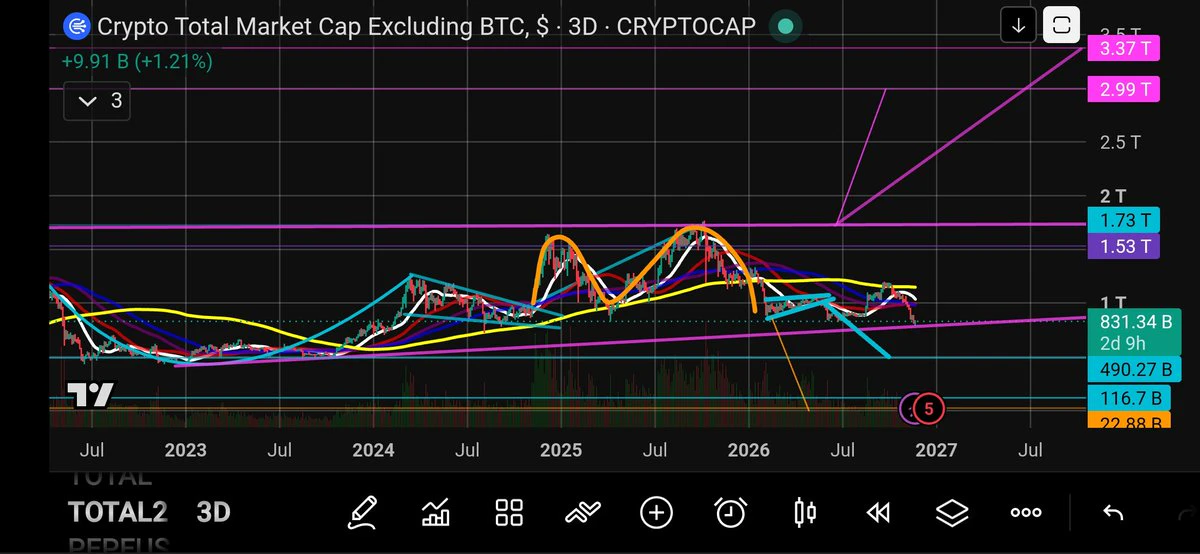
$TOTAL 2 Marketcap EXCLUDING $BTC 🚨
3D Chart Analysis 🔎
The bulls have been able to defend this area 4 times already. Will they be able to do it a 5th time?
The pink converging trendlines appear to be forming a very large ascending triangle. This is a handle to a very large cup and handle pattern.
The bulls will want to defend this zone of $832B-$722B or risk collapse to $490B.
A potential rebound to the upside is looking quite possible.
If the top pink trendline of the ascending triangle is broken to the upside at $1.75T. Then the targets of $2.99T and $3.37T will be activated.
Yes we are
post-image
BTC-0.67%
ETH-1.26%
SOL-0.77%
#GateDirectIPOPhase3ANTAllocates92100Shares #ShareWeekly
Gate Direct IPO Phase 3 Delivers 92,100 Anthropic ANT Shares at 83 USDT: A Landmark Allocation in the Race for Frontier AI Ownership

Gate Direct IPO Phase 3 has officially completed the allocation of Anthropic shares under the ticker ANT, distributing a precise total of 92,100 shares to eligible participants at a final issue price of 83 USDT per share. This milestone marks a significant moment for retail investors seeking exposure to one of the most closely watched artificial intelligence companies in the world. The total value of the
$HYPE 60.7, down 2.6% over 24H. The 1h resistance at 61.85 hasn’t been firmly reclaimed. The 4h RSI is oversold at 25.6, but the trend remains weak—showing a clear divergence. Volume is only half the average, and the rebound is weak, so it’s best to wait and see in the short term. Keep an eye on 61.85; only after reclaiming it can we start thinking about a return to 70. Wait for a clear direction before deciding, and stay calm. Keep watching and patiently wait for a breakout. Don’t chase highs or panic-sell. Discipline is most important. This is not investment advice.
#HYPE #Hyperliquid
post-image
HYPE+0.24%
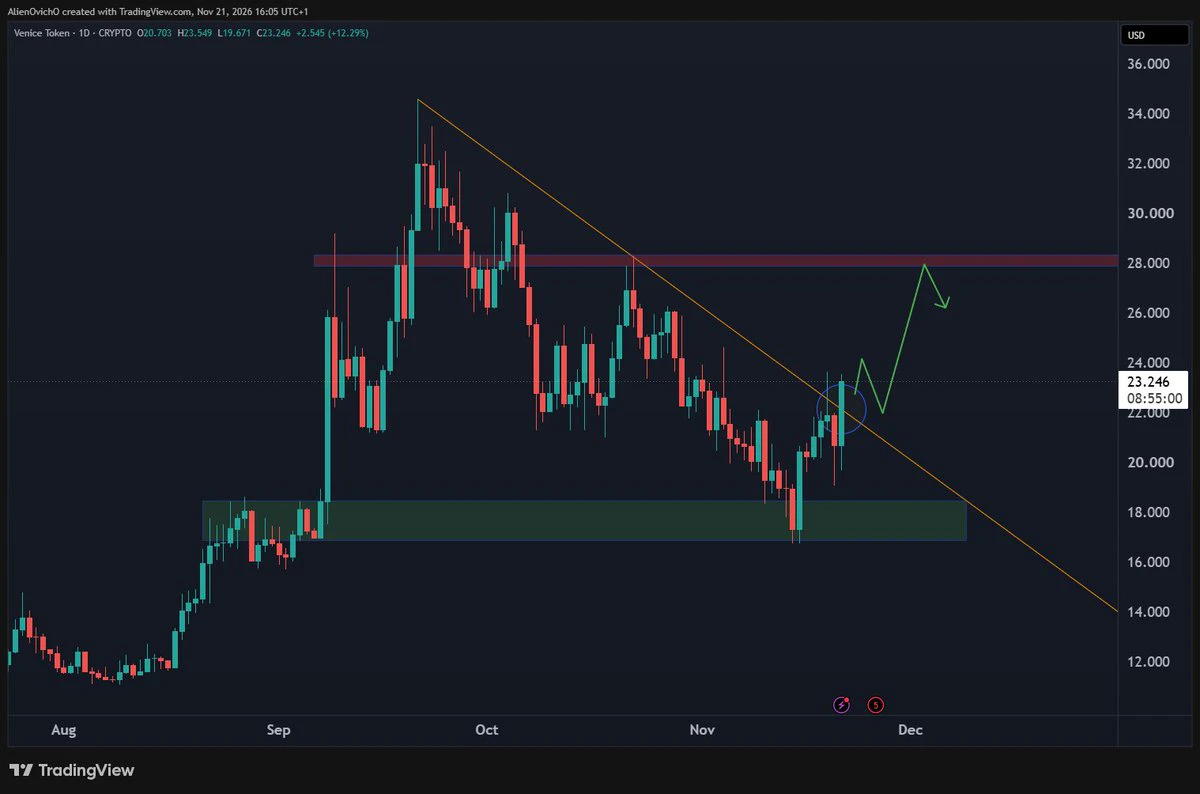
base:0xacfe6019ed1a7dc6f7b508c02d1b04ec88cc21bf is pushing against the descending trendline 📈
A daily close above 22$ confirms the daily reversal in progress and could take price back toward the 28 area.
post-image
TAKE-0.39%
$PUMP Longs show strong signs of a reversalEntry price: $0.00240–$0.00244Take-profit 1: $0.00250Take-profit 2: $0.00258Take-profit 3: $0.00268Stop-loss: $0.00230$PUMP After rebounding from the $0.00220 support zone, the 4-hour chart shows strong recovery momentum. The newly formed bullish candles indicate buyers are actively entering. If the price holds above $0.00245, it could rise further. Buy and trade $PUMP
post-image
PUMP-1.06%
Arbitrum One’s Stablecoin Market Cap Increased by $327.4 Million Over the Past 7 Days
live-cover
LIVE2,301
BTC-0.67%
ETH-1.26%
SOL-0.77%
USDC+0.01%
XRP-1.15%
#GateDirectIPOPhase3ANTAllocates92100Shares
Share Your Views Every Day and Win Rewards! Gate Community Brings Another Exciting Opportunity!

The Gate community is giving creators and crypto enthusiasts another reason to stay active, share their opinions, and participate in trending discussions. With the latest daily posting campaign, users have an opportunity to earn rewards simply by creating meaningful content around selected hot topics. Whether you are sharing your trading experience, discussing market trends, reviewing a new project, or talking about a recent platform announcement, your v
post-image
  • 3
  • 1
BTC, gold, and Nvidia just keep falling—I can’t survive! Reluctantly parting with my debut piece, 30000U (negotiable).
post-image
BTC-0.67%
GLDX-0.40%
PAXG+0.37%
NVDA-13.84%
1: Cashing in! Congratulations to the subscribers—profits are in tonight. I’m done watching this market; time to sleep. Spot SKYAI gain: 11.8%.
SkyAI tweet price: updated at 22:55, price 0.0382
Best entry: 0.0397; high: 0.0397. Precise entry; one dynamic alert was sent.
Take-profit level: 0.0346; low: 0.0349. Take profit, then sleep.
For those who like to argue, first check the tweet time and price levels to see whether these were calls made in advance. The update was posted first, followed by the price levels. Check whether the entry and take-profit levels matched the updates sent to subscrib
SKYAI-7.58%
GT-2.41%
  • 4
  • 1
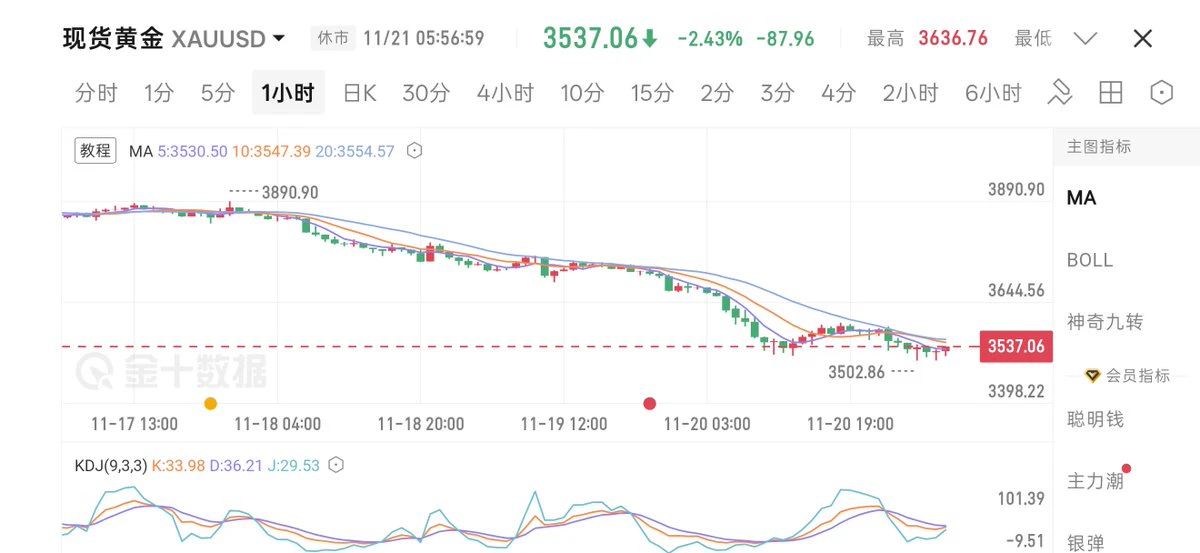
Gold is just over 3,500!!! 😱😱😱, there’s no way to live like this anymore—just destroy everything 🛌
post-image
Load More

Join 40 M users in our growing community

⚡️ Join 40 M users in the crypto craze discussion

💬 Engage with your favorite top creators

👍 See what interests you

Trending Topics

BTCBreaksBelow60K

2.1M Views29.8K Discussing

BTC fell below $60,000 on November 20 for the first time since July, alongside a tech stock selloff and broader pressure on risk assets. Will $60K become resistance, or can BTC quickly reclaim it? What price or volume signals would convince you that selling pressure is easing?

GateDirectIPOPhase3ANTAllocates92100Shares

775.2K Views4.9K Discussing

NvidiaDropsNearly14Percent

325.2K Views7.6K Discussing

View More