Square
Following
Hot
News
Notifications
Profile
Share your thoughts
placeholder
Article
Arbitrum One’s Stablecoin Market Cap Increased by $327.4 Million Over the Past 7 Days
live-cover
LIVE5,504
ETH-1.26%
BTC-0.67%
SOL-0.77%
ZEC+1.16%
HYPE+0.24%
Just accept the losses this time and stop wasting effort looking for excuses. If you really have to point fingers, the blame shouldn’t be laid at crypto’s door. The real problem is that the collapse across other capital markets was far worse than expected. Bitcoin and Ethereum were simply caught in the crossfire—in other words, pure collateral damage!

Let’s go over the timeline. The sell-off in Bitcoin and Ethereum can be traced back to the 87,000 level. I thought the drop from 87,000 to 81,000 was fairly normal: a correction and consolidation after bullish sentiment cooled, building momentum
post-image
BTC-0.67%
Trenches
FIONA
F
bade
b
FIONA
B34n...pump
Market Cap
$.
Change
.
24h Vol
$.
Holders
.
PIEVERSE
P
bade
b
PIEVERSE
0x0e...25a9
Market Cap
$.
Change
.
24h Vol
$.
Holders
.
mihao
m
bade
b
mihao
4Cxj...pump
Market Cap
$.
Change
.
24h Vol
$.
Holders
.
IDOL
I
bade
b
IDOL
0x3b...ab07
Market Cap
$.
Change
.
24h Vol
$.
Holders
.
CLAUDIA
C
bade
b
CLAUDIA
2j5S...W2ZM
Market Cap
$.
Change
.
24h Vol
$.
Holders
.
#NvidiaDropsNearly14Percent
When The Closing Bell Rang On Friday, Nvidia Was At $125.53: 14.01% Gone In One Day

When the closing bell rang on Friday, the screen showed $125.53. A day before, the close was $145.98. The gap in between was $20.45. In rate terms, 14.01%.

The day had opened at $143.52. The intraday low was $124.50. So the fall ran all day. It did not ease even in the last hour.

This is not the story of one day. This was the hardest day of a fall that has run for seven weeks.

What Happened On Friday?

On Friday, November 20, Nvidia shares fell 14.01%. This fall means a loss of
post-image
NVDA-13.84%
BTC-0.67%
  • 8
[ MARKET POSITION ]
live-cover
LIVE1,873
BTC-0.67%
BTC also fell in today’s broad-based sell-off.

Currently at 58,152, down 5.47% over 24 hours; it hit an intraday low of 55,754.30, at one point falling 9.83% over 24 hours and dropping below $60k for the first time since July. BlackRock’s spot Bitcoin ETF (IBIT) saw a record daily net outflow of $541 million; the Fear & Greed Index came in at 9, in the extreme fear zone. ETH was at 1,620.32, down 6.23%; BNB at 536.42, down 5.9%; and SOL at 68.68, down 4.21%—all following the broader market lower.

No need to look all over—the data for this coin is all in the tags below. Click through to get e
post-image
BTC-0.67%
BLK-3.02%
IBIT-5.97%
ETH-1.26%
BNB-0.76%
Vibevibers Battleground vs GTA 6
Two different worlds two different vibes
Which side are you choosing?
post-image
STRC AND TMUS DIVIDEND SETTLEMENT: TWO STOCK PERPETUAL FUTURES CONTRACTS RECEIVE UPDATED ARRANGEMENTS

Gate has published dividend settlement arrangements for STRC and TMUS perpetual futures contracts, bringing two additional stock-linked contracts into focus for traders who follow dividend-related adjustments in the digital asset market. The announcement highlights an important part of stock perpetual futures trading: understanding how dividend events are handled when the underlying exposure is connected to traditional stocks.

But what does this announcement actually mean? Why do dividends m
post-image
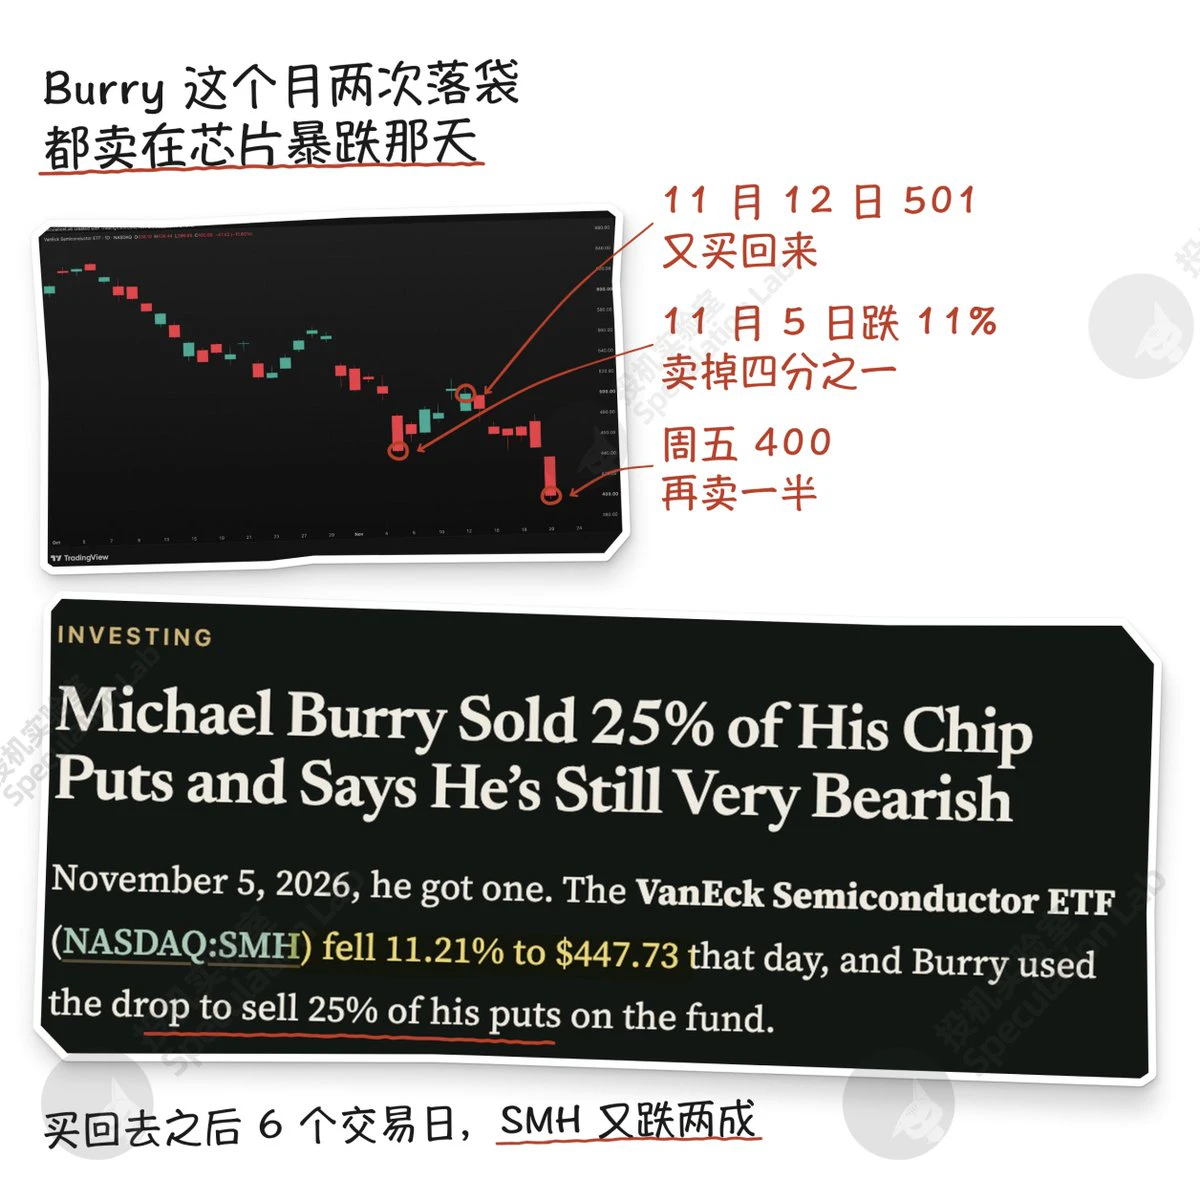
Burry, the larger-than-life real-life figure who inspired the character in *The Big Short*, has cashed out twice this month, both times on the day chips plunged.
Yesterday, Nvidia fell 14%, and he sold half of each of his Nvidia and SMH put options 🤑😘
The previous time was November 5, when SMH fell 11% in a day; he sold a quarter of his SMH puts. So what was he doing between these two trades?
After he sold his SMH puts, it started to rebound, climbing back to 507 in four trading days, 13% above the price on the day he sold. On November 12, he bought back the portion he had sold, doubled his
post-image
NVDA-13.84%
SMH-0.36%
NAS100-0.07%
Finally flipped that MA99 on $JCT . Glad to see this chart finally showing some real life. Hot tokens:
$ELSA : Current price 0.0666 - 24-hour change: +12.56%
$ZEC : Current price 747.11 - 24-hour change: -10.02%
post-image
JCT-3.26%
ELSA+5.80%
ZEC+1.16%
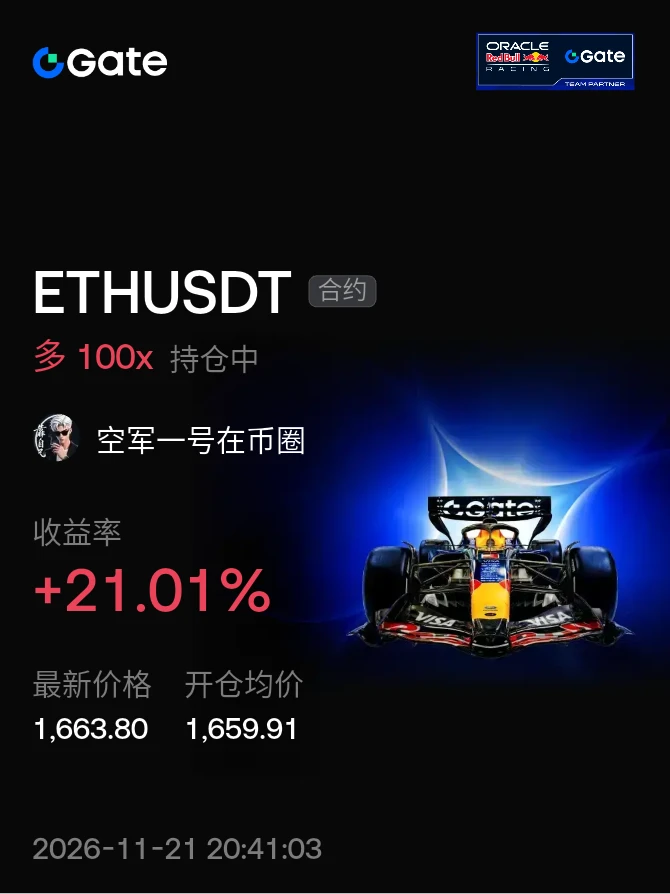
I actually broke even, so now I can set another target: either make money or add to my position at 1550
post-image
ETH-1.23%
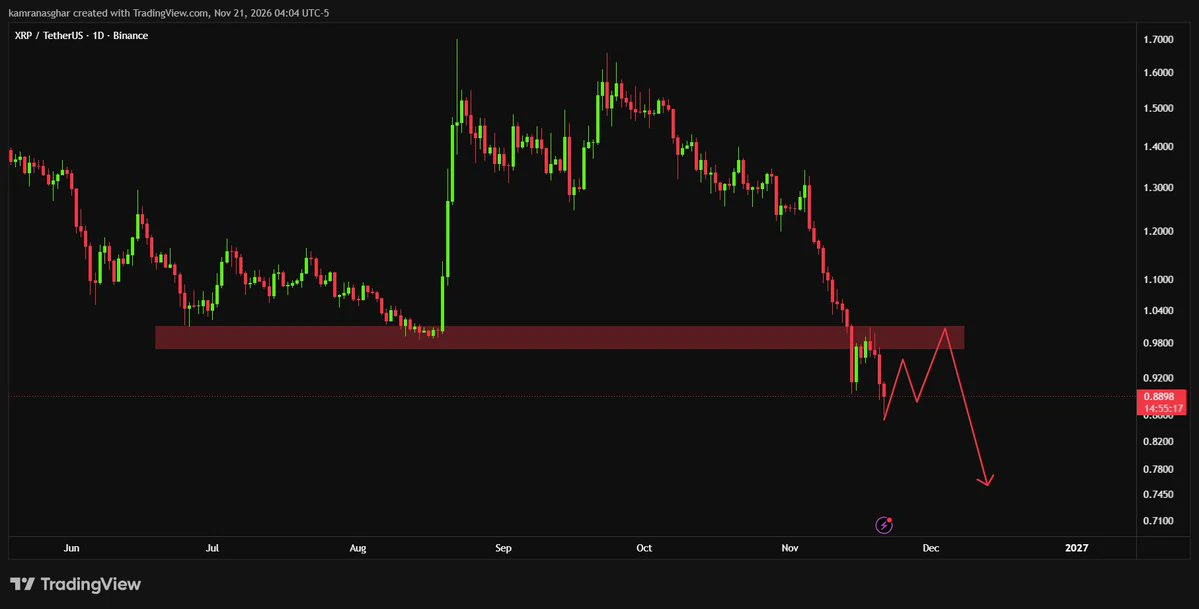
🔥 $XRP retesting broken $0.98–$1.04 supply as resistance; rejection points down toward $0.745.
post-image
XRP-1.15%
0.3458, $ICNT today's low hit this level. Down 20% in 24 hours, with trading volume still at $48 million. The drop isn't the problem; the problem is that volume hasn't contracted as it fell.
Think through the transmission path. On the macro side, the dollar has been relatively strong lately, and funds are moving to safe havens—that's the first layer. Second, in this environment, big players won't buy into highly volatile small- and mid-cap assets; they'll reduce exposure first. They don't care about the price when selling, so the decline can exceed what the structure would normally warrant. O
ICNT-10.32%
  • 1
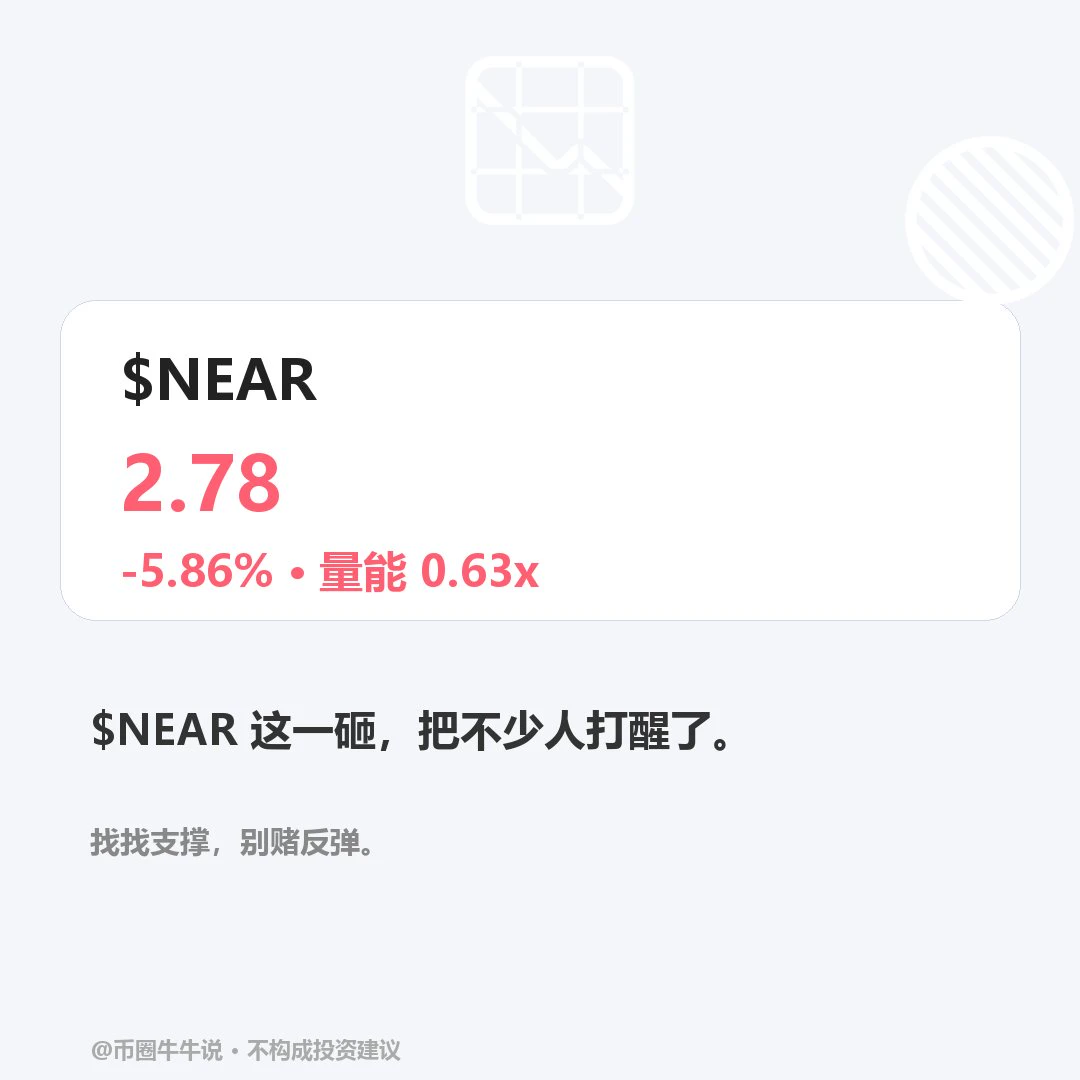
$NEAR 2.781, down 5.86% over 24H. It just bounced off a low at 2.55, but the 4h RSI at 16 is extremely oversold. The trend is weak, though, and volume is only 0.63x the average, making the rebound look limp. For now, keep an eye on 2.55, a confluence support level on the 1h/4h charts. If it breaks and price can’t recover on low volume, watch out for a second leg down. To turn things around, it first needs to reclaim 3.024, which still looks a long way off. Not investment advice.
#NEAR #NEAR
post-image
A bit absurd, but also kind of reasonable
post-image
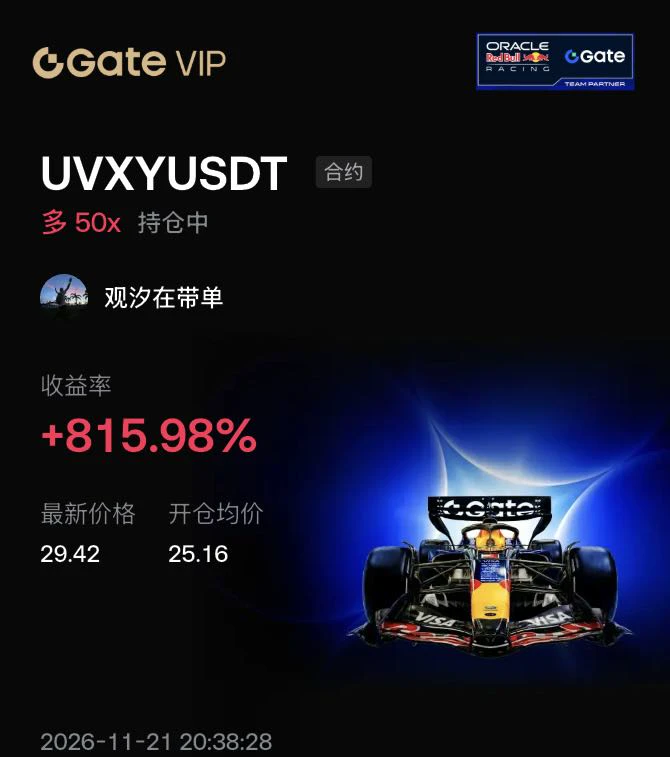
Tonight, this Red Bull race car has my heart racing

While watching the markets tonight, I had just put the kettle on when my phone pinged—a UVXYUSDT long position, entry average 25.16, current price already up to 29.42, return +815.98%, with 50x leverage still on. The kettle was making noise, I was watching the candlesticks, and it felt more thrilling than watching a Red Bull pit stop.
$BTC
UVXY is a product offering 1.5x long exposure to the VIX fear index; essentially, it's a bet on whether the market will panic. It doesn't depend on earnings reports; it depends on events like geopolitics,
post-image
BTC-0.65%
ETH-1.23%
SOL-0.74%
$BLESS The meme coin's run is over. It rebounded to a new high today, then plunged straight down. Short the bounce! ⬇️⬇️⬇️
post-image
BLESS-2.00%
#BTCBreaksBelow60K

BITCOIN HAS LOST $60,000: A BEGINNER’S GUIDE TO UNDERSTANDING WHAT HAPPENS NEXT

📉 THE BREAKDOWN: UNDERSTAND WHAT JUST HAPPENED

Bitcoin has fallen below $60,000 for the first time since July, turning an important market milestone into a serious test of investor confidence. The decline on November 20 was not an isolated crypto event. Technology stocks also faced heavy selling, while investors reduced exposure to assets considered risky.

For beginners, the important lesson is that Bitcoin does not move independently of the wider financial market. When investors become wor
post-image
Holy shit!!? It's actually real—this Gemini 4 Neon model really is AGI🤣 I can't handle this.
Load More

Join 40 M users in our growing community

⚡️ Join 40 M users in the crypto craze discussion

💬 Engage with your favorite top creators

👍 See what interests you

Trending Topics

BTCBreaksBelow60K

2.1M Views29.5K Discussing

BTC fell below $60,000 on November 20 for the first time since July, alongside a tech stock selloff and broader pressure on risk assets. Will $60K become resistance, or can BTC quickly reclaim it? What price or volume signals would convince you that selling pressure is easing?

GateDirectIPOPhase3ANTAllocates92100Shares

758.6K Views4.8K Discussing

NvidiaDropsNearly14Percent

318.4K Views7.5K Discussing

View More