Share your thoughts
placeholder
Article
$FIRE will flip $NEET
/FinancialIndependenceRetireEarly
post-image
FIRE0.00%
Everyone is sleeping on SYMBOL but the 4h setup just flipped

$HYPE /USDT - LONG

Trade Plan:
Entry: 81.107 – 81.577
SL: 79.086
TP1: 83.034
TP2: 84.162
TP3: 85.855

Why this setup?
Why now? The daily trend is bullish, the 1h price sits at 81.298, and the 15m RSI reading of 51.6 shows room to run without being overbought. The 1h ATR of 0.940106 means each candle is already moving nearly a full dollar, so a breakout from the entry zone around 81.342 can quickly push toward TP1 at 83.034 and then TP2 at 84.162. The invalidation level at 82.441 is the hard line that protects this long if the mo
HYPE+0.32%
Portraying Genesis as fine art: a pixel-born figure framed like an old master, because provenance changes but the urge to make symbols lasts. @RareFriendsNFT
post-image
ART-0.40%
PIXEL-1.49%
#BonkGuyBullishOnUSELESS
$USELESS
$USELESS is back around $0.24, and this is where the chart becomes more interesting than the headline. After a powerful Meme-driven move and fresh attention from Bonk Guy, the market is now testing whether buyers can convert that momentum into a sustainable technical trend. The latest intraday data shows a wide range, with price moving from roughly $0.205 to $0.253, highlighting just how aggressively traders are rotating in and out of the token.
At $0.24, USELESS is trading close to the upper portion of that intraday range, which is generally constructive
USELESS+2.72%
  • 1
  • 1
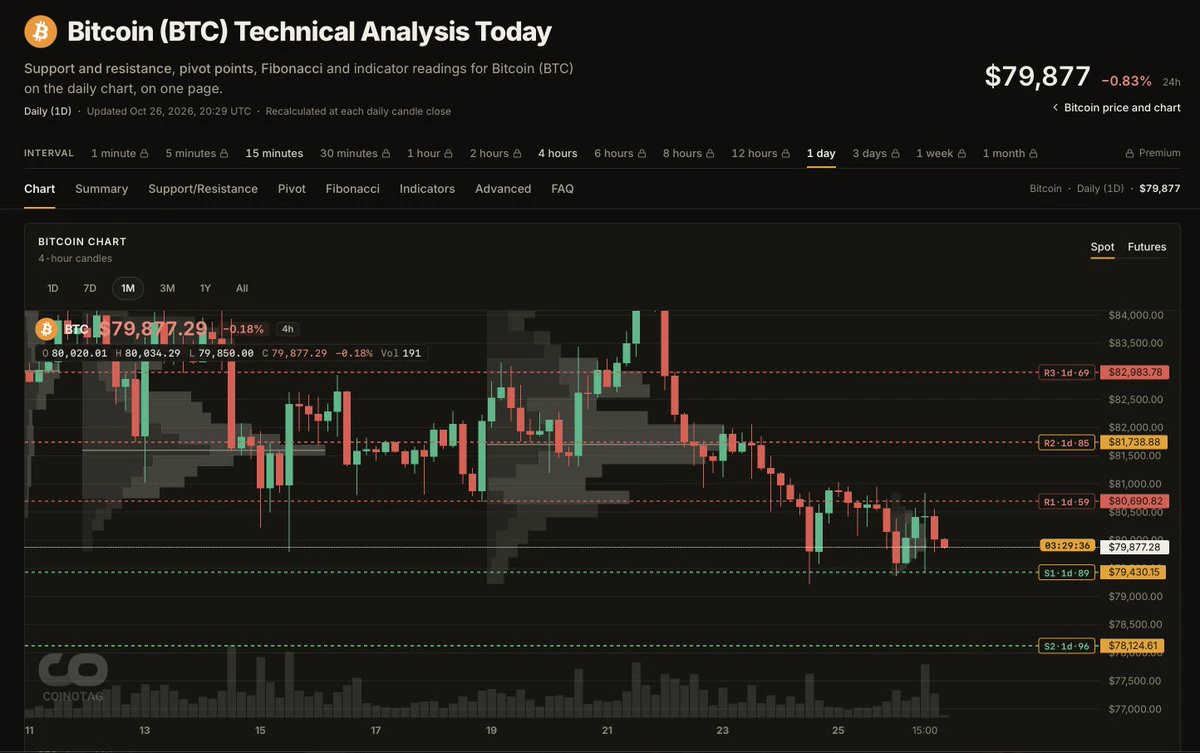
$BTC Signal】1H resistance + sell-side suppression, short from highs
$BTC Order book imbalance -43.33%, bid depth 0.40, sell pressure accumulating above the 77000 level. The 1H MACD red bars are contracting, while the 4H green bars remain. RSI: 1H 44.20, 4H 36.52. Price is repeatedly clinging to the 1H Bollinger midline at 77067, and the 1H EMA20 at 77192 has not been reclaimed. Funding rate 0.0036%, OI stable, shorts are not crowded. The risk/reward ratio is reasonable here, the stop-loss range is clear; exit if wrong without hesitation.
🎯Direction: Short
⚡Entry/Limit Orders: 76833.307 - 770
post-image
BTC+1.10%
#GateMeme 🔥 GATE MEME — THE CRYPTO MARKET NEVER SLEEPS!
Crypto trading is not just charts, candles, support and resistance — sometimes it is pure entertainment!
You open the chart thinking:
“Today I will trade with discipline.”
Five minutes later:
BTC suddenly moves 2% and every trader becomes a full-time market analyst. 😂
🚀 When BTC pumps:
“Bull market is back!”
“New ATH incoming!”
“Easy trade!”
📉 When BTC dumps:
“Healthy correction.”
“Liquidity grab.”
“Whales are accumulating.”
😂 And when a meme coin suddenly goes 100%:
“I was watching it yesterday!”
“I almost bought it!”
“I knew it wou
post-image
  • 2
A few days ago, my hand trembled slightly as I set the stop-loss; this morning, I realized that was unnecessary filial devotion.
The last thing I saw before bed, $LITE was moving sideways near the bottom around 881.54, forming a base without breaking support. Funds were quietly entering, and I saw that the buying support was solid, so I casually shared the long setup. While others were still watching from the sidelines, this kind of level tests your patience the most—you have to hold on for the story that comes next.
When I opened the chart in the morning, it had already reached 949.06, with
post-image
LITE-2.48%
ETH+4.09%
XRP+0.45%
BITCOIN IS PUMPING AFTER INFLATION NEWS 👀
BTC+1.09%
$ZEC USDT Long Setup
🔴 Entry: 1,120 - 1,150
🎯 TP1: 1,190
🎯 TP2: 1,230
🎯 TP3: 1,280
🟢 SL: 1,070
ZEC reversed sharply off the 1,053 low, breaking above MA(7) with a strong green candle on rising volume after a multi-day pullback from the 1,297 high. Price is snapping back after finding support near MA(99). As long as it holds above 1,100, momentum favors a push back toward the recent highs.
⚠️ This is not financial advice. Always do your own research (DYOR).
#LearnWithGM
post-image
ZEC-0.69%
I didn’t do anything—I just went to the bathroom, and when I came back, the candlestick chart had already done the work for me. While everyone else was running, I actually smiled as I watched the market: a low-volume sell-off, but increasingly clear buying support, with funds quietly entering. I know this rhythm all too well. $SKHYNIX pulled back to 1202.67, and I immediately said: Go long, don’t hesitate. Now it’s at 1386.04, +1085.15%. I nailed the rhythm so well that I almost want to applaud myself. Those already on board should have woken up smiling—it was worth staying up. Don’t let prof
post-image
SKHYNIX-0.15%
LAB+7.85%
SNDK-2.17%
Global $763 million OI, with Gate alone accounting for $378.8 million—what does a 49.6% market share mean?
Guys, there is another set of data in CoinMarketCap’s report that may be more noteworthy than trading volume. The total open interest (OI) of RWA perpetual contracts on global CEXs is approximately $763 million, while Gate alone accounts for $378.8 million, or 49.6%.
What does 49.6% mean? In any niche derivatives market worldwide, it is nearly impossible to find a single exchange holding almost half of the market share. One out of every two people trading RWA perpetual contracts is tradin
ORCL+1.73%
$哈基米
+23.98% is interesting. But the real question is whether the attention can hold.
$哈基米 is showing a strong move on the Gate screen, with price up 23.98% and around $1.03M in 24h volume against a visible $37.89M market cap.
My view: bullish, but watch mode.
The move has enough activity to deserve attention, but a Meme rally can cool quickly after the first wave of buyers arrives. I want to see whether volume remains strong while price holds above the recent range instead of immediately giving back the move.
If volume fades and price loses the breakout area, the thesis weakens.
I would not
post-image
哈基米+31.75%
  • 4
  • 2
The news flow remains quite supportive, guys. Gold dipped to support, stabilized, and rebounded, with our 4380 target reached directly, delivering nearly 100 points of upside. $XAUT
XAUT+0.57%
The hand that set the stop-loss a few days ago trembled slightly; this morning I realized that was unnecessary filial piety.

When I opened the chart this morning, $HEMI was still wavering repeatedly at high levels. Every push upward fell just short, and its weak rebound was written all over its face. With insufficient buying support and volume failing to keep up, this kind of bounce made me uneasy just looking at it.

I called the short around 0.015588, and some brothers said I was too impatient at the time. Those who followed the rhythm down should have seen what happened afterward.

The
post-image
HEMI-5.99%
SOL+2.20%
ETH+4.09%
XRP is range-bound all day but the 4h tells a different story.

$XRP /USDT - LONG

Trade Plan:
Entry: 1.3277 – 1.3333
SL: 1.2954
TP1: 1.3568
TP2: 1.3744
TP3: 1.4007

Why this setup?
Why now? The daily trend has been a flat range, yet the 4h bias points long with 77.4 confidence, and the 1h price just touched the entry reference of 1.3305. The 15m RSI sits at 33.68, signaling room to run before overbought territory, while the 1h ATR of 0.011247 confirms enough momentum to push the first target at 1.3568. The second target sits at 1.3744, but the invalidation level at 1.3766 acts as the hard
XRP+0.45%
  • 1
Strategy publicly released at 10:17. The stop-loss at 1.27 points wasn’t swept, and the target was hit precisely—that’s what skill looks like.
A 50-point drop—I fed the levels right to your mouth; you just had to swallow. $ETH #8月核心CPI超预期
ETH+4.04%
🎉 Up to 100 USDT in a single week! Gate Square’s “Weekly Showcase” is in full swing!
📌 How to participate
① Sign up for the event 👉 https://www.gate.com/campaigns/6244
② Post with the #每周来晒 and #8月CPI数据出炉 hashtags
③ Share your market outlook, earn points, climb the leaderboard, and win rewards!
💬 This week’s hot topic
U.S. CPI rose 0.4% month-on-month in August, the highest since June; the annual rate was 3.4%, unchanged from the previous reading. Both figures were in line with expectations. How will this affect expectations for Federal Reserve policy, and what market opportunities wi
post-image
GateSquare
🎉 Up to 100 USDT in a single week! Gate Square’s “Weekly Showcase” is in full swing!
📌 How to participate
① Sign up for the event 👉 https://www.gate.com/campaigns/6244
② Post with the #每周来晒 and #8月CPI数据出炉 hashtags
③ Share your market outlook, earn points, climb the leaderboard, and win rewards!
💬 This week’s hot topic
U.S. CPI rose 0.4% month-on-month in August, the highest since June; the annual rate was 3.4%, unchanged from the previous reading. Both figures were in line with expectations. How will this affect expectations for Federal Reserve policy, and what market opportunities will it bring?
💡 Discussion
1️⃣ Will the CPI data change market expectations for the Federal Reserve’s rate-cut path?
2️⃣ How will crypto/stock assets react in the short term?
3️⃣ Which trading opportunities are you most bullish on under current market conditions?
Share now: https://www.gate.com/post
Event details: https://www.gate.com/announcements/article/101691
repost-content-media
  • 1
Yooo I think I’ve found the most cracked dev from Africa wtf !! $Chale
post-image
$ETH is showing stronger relative strength than Bitcoin right now.
Yesterday’s dip into $2,400 was quickly absorbed, and buyers pushed price back up. That reaction keeps $2,400 as the key short-term line.
As long as ETH holds above it, buyers have the advantage. A clean break below $2,400 would weaken the setup and could open a deeper pullback.
For now, I’d rather buy confirmed strength than chase the middle of the range.
#ShareWeekly #Ethereum
post-image
ETH+4.04%
Load More

Join 40 M users in our growing community

⚡️ Join 40 M users in the crypto craze discussion

💬 Engage with your favorite top creators

👍 See what interests you

View More