Share your thoughts
placeholder
Article
🚨 The BSP just hit pause on new payment operator applications for an entire year! What does this mean for the crypto landscape in the Philippines? 🤔 $BTC #CryptoNews
post-image
BTC-0.49%
#AltcoinOISurpassesBitcoinforFirstTimeinOveraYear
ALTCOIN OI SURPASSES BITCOIN A MAJOR DERIVATIVES MARKET SHIFT
The crypto derivatives market has just delivered one of the strongest signals of changing trader positioning in more than a year: total altcoin perpetual-futures open interest has moved above Bitcoin’s for the first time since December 2024. The crossover is based on Coinalyze data and shows that a larger share of outstanding leveraged positions is now concentrated across altcoins rather than BTC.
WHY THIS UPDATE MATTERS
Open interest represents the total value of derivative contra
post-image
Jiaa_Insights
#AltcoinOISurpassesBitcoinforFirstTimeinOveraYear ALTCOIN OI SURPASSES BITCOIN A MAJOR DERIVATIVES MARKET SHIFT
The crypto derivatives market has just delivered one of the strongest signals of changing trader positioning in more than a year: total altcoin perpetual-futures open interest has moved above Bitcoin’s for the first time since December 2024. The crossover is based on Coinalyze data and shows that a larger share of outstanding leveraged positions is now concentrated across altcoins rather than BTC.
WHY THIS UPDATE MATTERS
Open interest represents the total value of derivative contracts that remain open and unsettled. When altcoin OI moves above Bitcoin OI, it does not automatically mean that every altcoin is bullish. Instead, it tells us that traders are becoming increasingly active and willing to deploy leverage outside Bitcoin.
This is a major change in market structure.
For months, Bitcoin remained the primary center of derivatives positioning. Now traders are rotating more aggressively toward the broader altcoin market, suggesting that risk appetite is expanding beyond BTC.
The timing is also important because the combined market capitalization of altcoins outside the top 10 has moved above $200 billion and has risen more than 10% since the beginning of September. That means this rotation is happening alongside an increase in spot-market capitalization rather than being purely a futures phenomenon.
ALTCOIN SEASON OR LEVERAGE TRAP?
This is where I would be careful.
The first interpretation is bullish: capital and trader attention are moving deeper into the altcoin market, creating the conditions for stronger relative performance across selected altcoins.
But the second interpretation is equally important: higher OI means higher leverage.
If too many traders become positioned in the same direction, even a relatively normal correction can trigger liquidations. Those liquidations can then force additional positions to close, creating a much larger move than the original price change.
So rising altcoin OI is both a bullish participation signal and a volatility warning.
BTC VS ALTCOINS
Bitcoin is still trading around the $80K region, but the derivatives structure is changing underneath the market.
This creates an interesting setup.
If BTC remains stable while altcoin OI continues expanding, traders may continue searching for higher-beta opportunities in Ethereum, Solana, Zcash, DeFi tokens and other large or mid-cap assets.
If BTC breaks higher at the same time, the combination could become even stronger because rising BTC liquidity can create a broader risk-on environment.
However, if BTC suddenly loses major support while altcoin leverage remains elevated, altcoins could experience significantly larger percentage declines than Bitcoin.
That is why the next BTC move is still extremely important for the entire altcoin market.
ZEC IS A PERFECT EXAMPLE
Zcash provides one of the clearest examples of what this rotation can look like.
ZEC open interest reached approximately $2.4 billion, while its price pushed through $1,000 and short liquidations reached roughly $34 million.
This shows both sides of the current market.
When momentum accelerates, high OI can fuel a powerful short squeeze.
But if sentiment suddenly reverses, that same leverage can become fuel for a long-liquidation cascade.
The lesson is simple: high OI can amplify both directions.
WHAT I AM WATCHING NEXT
The most important confirmation now is whether altcoin OI continues rising while spot market capitalization also expands.
If both increase together, the move would suggest genuine market participation rather than leverage alone.
If OI rises rapidly while spot prices and market capitalization stop advancing, the setup becomes much more dangerous because derivatives exposure would be growing faster than underlying demand.
I would therefore monitor three things closely:
1. Altcoin OI
Continued expansion would show that traders are maintaining strong interest in altcoin derivatives.
2. Altcoin spot market capitalization
Continued growth above the $200B area would provide stronger confirmation that the rotation is not purely leverage-driven.
3. BTC stability
Bitcoin holding the $80K region would give altcoins more room to continue outperforming. A sharp BTC breakdown could quickly change the entire risk environment.
BULLISH SCENARIO
If Bitcoin remains stable or moves higher while altcoin market capitalization continues expanding and OI grows in a controlled manner, the current rotation could develop into a much broader altcoin rally.
In that scenario, traders may continue moving down the risk curve:
BTC → ETH → large-cap altcoins → mid-cap altcoins
The strongest projects with improving liquidity, volume and momentum would likely attract the greatest attention.
A sustained decline in Bitcoin dominance would add another confirmation signal for this rotation.
BEARISH SCENARIO
The biggest risk is excessive leverage.
If altcoin OI continues increasing rapidly while prices become overextended, the market could become vulnerable to a sharp liquidation event.
The previous December 2024 episode is worth remembering: the last time altcoin OI exceeded Bitcoin's, several mid-cap altcoins later experienced significant corrections even while Bitcoin remained comparatively stable.
That does not mean the same pattern must repeat now, but it demonstrates why this indicator should not be interpreted as a guaranteed buy signal.
MY MARKET VIEW
For me, this update is bullish for altcoin participation but cautious for leverage risk.
The fact that altcoin OI has overtaken Bitcoin after more than a year is a major structural development. It suggests traders are becoming increasingly interested in opportunities beyond BTC.
The additional confirmation is that altcoin market capitalization outside the top 10 has already moved above $200 billion and gained more than 10% since the start of September.
That makes the current environment much more interesting than a simple derivatives-driven pump.
But I would not call it a guaranteed altseason yet.
For me, the confirmation will come when:
Altcoin OI ↑
Spot market cap ↑
Trading volume ↑
BTC remains stable or bullish
BTC dominance continues weakening
If those conditions remain aligned, the probability of sustained altcoin outperformance increases.
FINAL TAKE
The most important message from today's data is not simply that altcoins have more open interest than Bitcoin.
The bigger message is that risk appetite is moving deeper into the crypto market.
Traders are no longer concentrating their derivatives exposure primarily around Bitcoin. They are increasingly willing to take leveraged positions across altcoins.
That can become the foundation for a powerful altcoin expansion.
But it can also create a much more fragile market.
More OI = more opportunity.
More OI = more leverage.
More leverage = bigger moves in both directions.
So my strategy would be to watch OI + volume + spot market capitalization + BTC structure together, rather than treating the OI crossover alone as a buy signal.
The next few sessions could reveal whether this is the beginning of a sustained altcoin rotation or simply a leverage-driven expansion that eventually produces a sharp correction.
ALTCOIN OI > BITCOIN OI
ALTCOIN MARKET CAP: ABOVE $200B
SEPTEMBER ALTCOIN MARKET CAP GROWTH: 10%+
KEY SIGNAL: CAPITAL AND LEVERAGE ARE ROTATING TOWARD ALTCOINS
KEY RISK: LIQUIDATION CASCADES
The market is clearly changing. Now the question is whether altcoins can turn this derivatives dominance into sustained spot-market strength.
BTC-0.51%
ETH0.00%
SOL-1.41%
ZEC+2.48%
  • 2
$ZEC With the price having pumped to this ridiculous level, everyone knows it now! This is a great opportunity to short, but very few people actually dare to take action! Because everyone feels fear—it’s only human nature! Truly, it’s lonely at the top… ‌
post-image
ZEC+2.41%
No patience, couldn’t hold—this round’s profits were paper-thin, but I loved every second of it.

I had just finished writing the analysis $TAO resistance overhead was obvious and it was rising without volume, but I didn’t expect it to fake a drop and then take off. While everyone else was exiting, I picked up a little at 225.0. The market hadn’t fully started moving yet, and it felt like grabbing a bargain.

I was genuinely nervous during the repeated intraday swings, but when it reached 265, it felt amazing. The +856.76% return isn’t much, but it’s safe and locked in.

Take profits first
post-image
TAO+9.17%
ADA+1.36%
LAB-3.17%
$HYPE is trading around $88.32, with bullish momentum still intact after recently setting a fresh high near $89.56.
The key support zone is $84–$85, while stronger support sits around $79–$80. On the upside, $90 is the immediate resistance. A clean break above it could open the door toward $95–$100.
For now, $HYPE remains bullish above $84. A rejection near $90 could trigger a pullback before another breakout attempt.
post-image
HYPE-1.16%
I originally wanted to sell at a loss to appease the heavens, but the heavens weren’t appeased—the meat cooked itself. 🔥 When everyone else was running, I didn’t. It wasn’t stubbornness; I saw clear resistance overhead and insufficient support, so this rebound simply couldn’t go far. 👀 The short opened at 4510.00 is now at 4392.31, with +242.57% in hand—this profit feels great, and everyone still in the trade should have laughed themselves awake. 🥩 Take 80% off the table first, and move the stop-loss on the remaining 20% to the entry price. Let it shake things out however it wants. Being fl
post-image
BTC-0.51%
ZEC+2.48%
Is the BNB short setup about to pay off after a range-bound day?

$BNB /USDT - SHORT

Trade Plan:
Entry: 746 – 748
SL: 756
TP1: 740
TP2: 735
TP3: 728

Why this setup?


Debate:
Are we hitting TP2 or getting trapped?

⚠️ Personal market analysis only. NFA — manage risk and DYOR.
Educational content, not investment advice or a recommendation to buy, sell, deposit, or withdraw any asset. No paid promotion or referral/affiliate links.
BNB-1.26%
The winning streak continues! Another day of complete victory!
Precisely captured 2,000 points in the BTC rebound swing🔥
Steadily secured 89 points of profit from the ETH-linked move🔥
Calmly capitalized on an 81-point move in the XAU uptrend🔥

Trading has never been about luck, but about clear direction and a mature operating strategy. Anticipate support and resistance in advance, lock in entry levels and take-profit targets, and act decisively when the market arrives. Do not stubbornly fight against the trend, strictly observe stop-losses, and follow the trend. Only by patiently waiting f
BTC-0.49%
ETH-0.01%
XAU-0.79%
#Bots I'm trading ZECUSDT with the Futures Grid bot on Gate. Join me!#GateLaunchesTrenchesWith0GasFee
post-image
  • 3
Bought more frong:native here, bes r/r you can get currently
Next leg up should send us into new highs
Prepare
post-image
#GateTops7DayNetInflowsGlobally
Weekly Net Inflow Crown Goes To Top Trading Venue
A fresh weekly read on capital flow shows a clear leader at the top. One major trading venue has posted the largest net inflow across the global market for the past weekly window, pulling ahead of all rivals. The data points to strong user trust and a wave of fresh deposits aimed at spot and derivatives books. In a time when traders move funds with care, this kind of lead is seen as a strong vote of confidence.
① Why Net Inflow Matters For Market Health
Net inflow tracks the gap between funds added and funds tak
MU+5.89%
NVDA+0.87%
SNDK+11.88%
TSLA-5.96%
AAPL-2.51%
  • 2
The outcome for the same 1,000 U can be worlds apart: those who chased APR last night are now down 22%, while those sitting on the sidelines are already celebrating. APR is currently at 0.1938, with a steep 24-hour drop of 21.89%. From a high of 0.2494 to a low of 0.1901, it plunged 11% in one sharp move. The 12.6M in trading volume may look lively, but it is all blood from panic sellers scrambling to escape.
Let’s start with the comparison data: APR’s 24-hour high is 1.29 times its current price. In other words, if you bought 1,000 U at the top, your account would now have only 775 U left. Th
APR-21.28%
The hand that set the stop-loss a few days ago trembled slightly; this morning, I realized that was an unnecessary act of filial piety. During the repeated intraday swings, while others were panic-selling, I saw $ETH hold firmly at 2473.40. The pullback never broke the level, and funds were quietly moving in, so I said at the time that this level was worth trying. As a result, it surged straight to 2498.57 today, with +177.04% secured—what a rush, this run was worth the wait. I’ve taken 80% in profits first, putting the meat in the bowl; I’ll move the stop-loss on the remaining 20% closer to
post-image
ETH0.00%
LAB-3.17%
ADA+1.36%
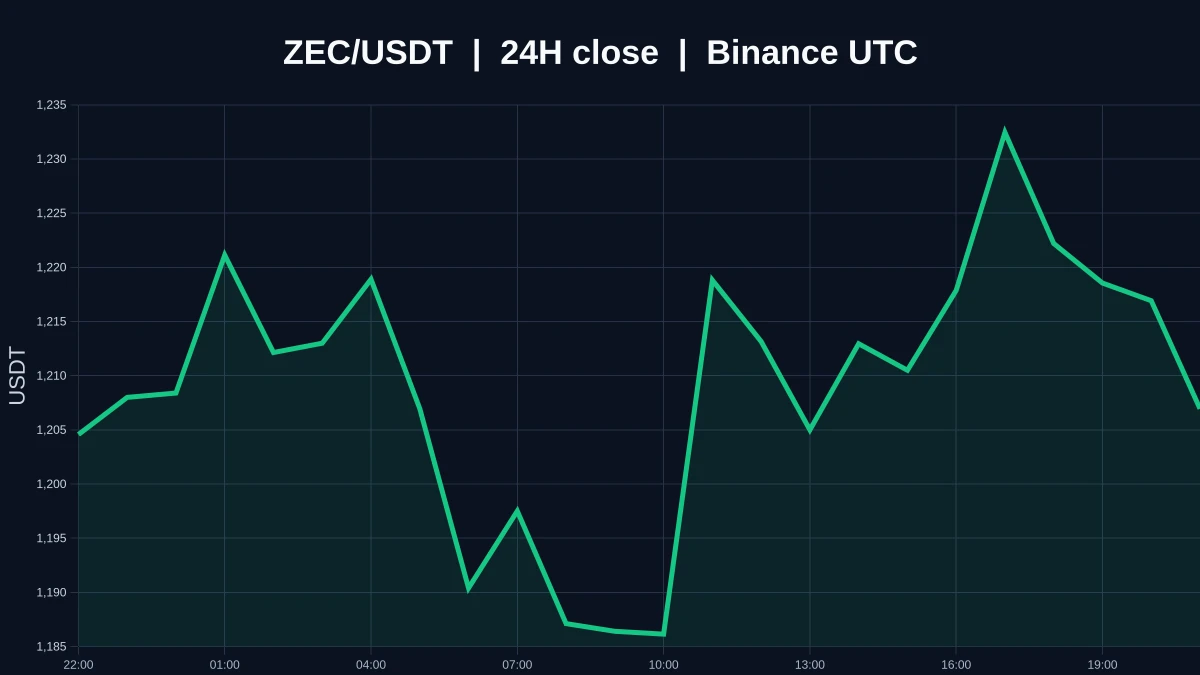
Insiders are quietly loading ZEC while the crowd still fears the daily chart.

$ZEC /USDT - LONG

Trade Plan:
Entry: 1189.7 – 1203.1
SL: 1131.8
TP1: 1244.8
TP2: 1277.1
TP3: 1325.6

Why this setup?
Why now? The daily trend is firmly bullish and the 4h structure confirms the momentum, so the setup favors continuation rather than reversal. The 1h ATR of 26.91 tells us volatility is expanding, which means a decisive break from the entry zone around 1196.4 is likely to carry price rapidly toward the first target at 1244.8. The 15m RSI sitting at 52.52 shows room to run before overbought exhausti
ZEC+2.48%
$SPCX
SPCX is currently trading around the $0.00205 area, making this a very interesting but highly speculative market structure. With such a small market valuation and limited trading activity, SPCX can experience sharp percentage moves even from relatively small changes in buying or selling pressure. This is exactly why I am focusing on confirmation from momentum, volume, and trend indicators rather than looking at price movement alone.
Current Market Structure
The current price is approximately $0.00205. The most important level for the immediate structure is the $0.00200 psychological s
post-image
SPCX-1.19%
It looks like CXMT is still short on LPDDR6 supply. According to sources in China, Xiaomi’s new foldable will use LPDDR6 from both CXMT and SK hynix.
post-image
SK Hynix+8.25%
SKHY+8.12%
SKHYV-0.98%
#ZECBreaks1200HitsNewAllTimeHigh
ZEC BREAKS 1200 AND ENTERS PRICE DISCOVERY
ZEC has made another major move, breaking above the 1200 level and reaching a new all time high. A move into new price territory always gets attention because there is no established historical resistance above the previous high.
The 1200 level is therefore more than just a round number. It represents an important psychological milestone and a clear test of whether buyers can maintain control after a powerful rally.
WHY THIS MOVE MATTERS
When an asset reaches a new all time high, market psychology can change quickly.
post-image
ZEC+2.41%
BTC-0.49%
BTC, Gold, and Crude Oil Analysis
live-cover
LIVE2,443
Load More

Join 40 M users in our growing community

⚡️ Join 40 M users in the crypto craze discussion

💬 Engage with your favorite top creators

👍 See what interests you

View More