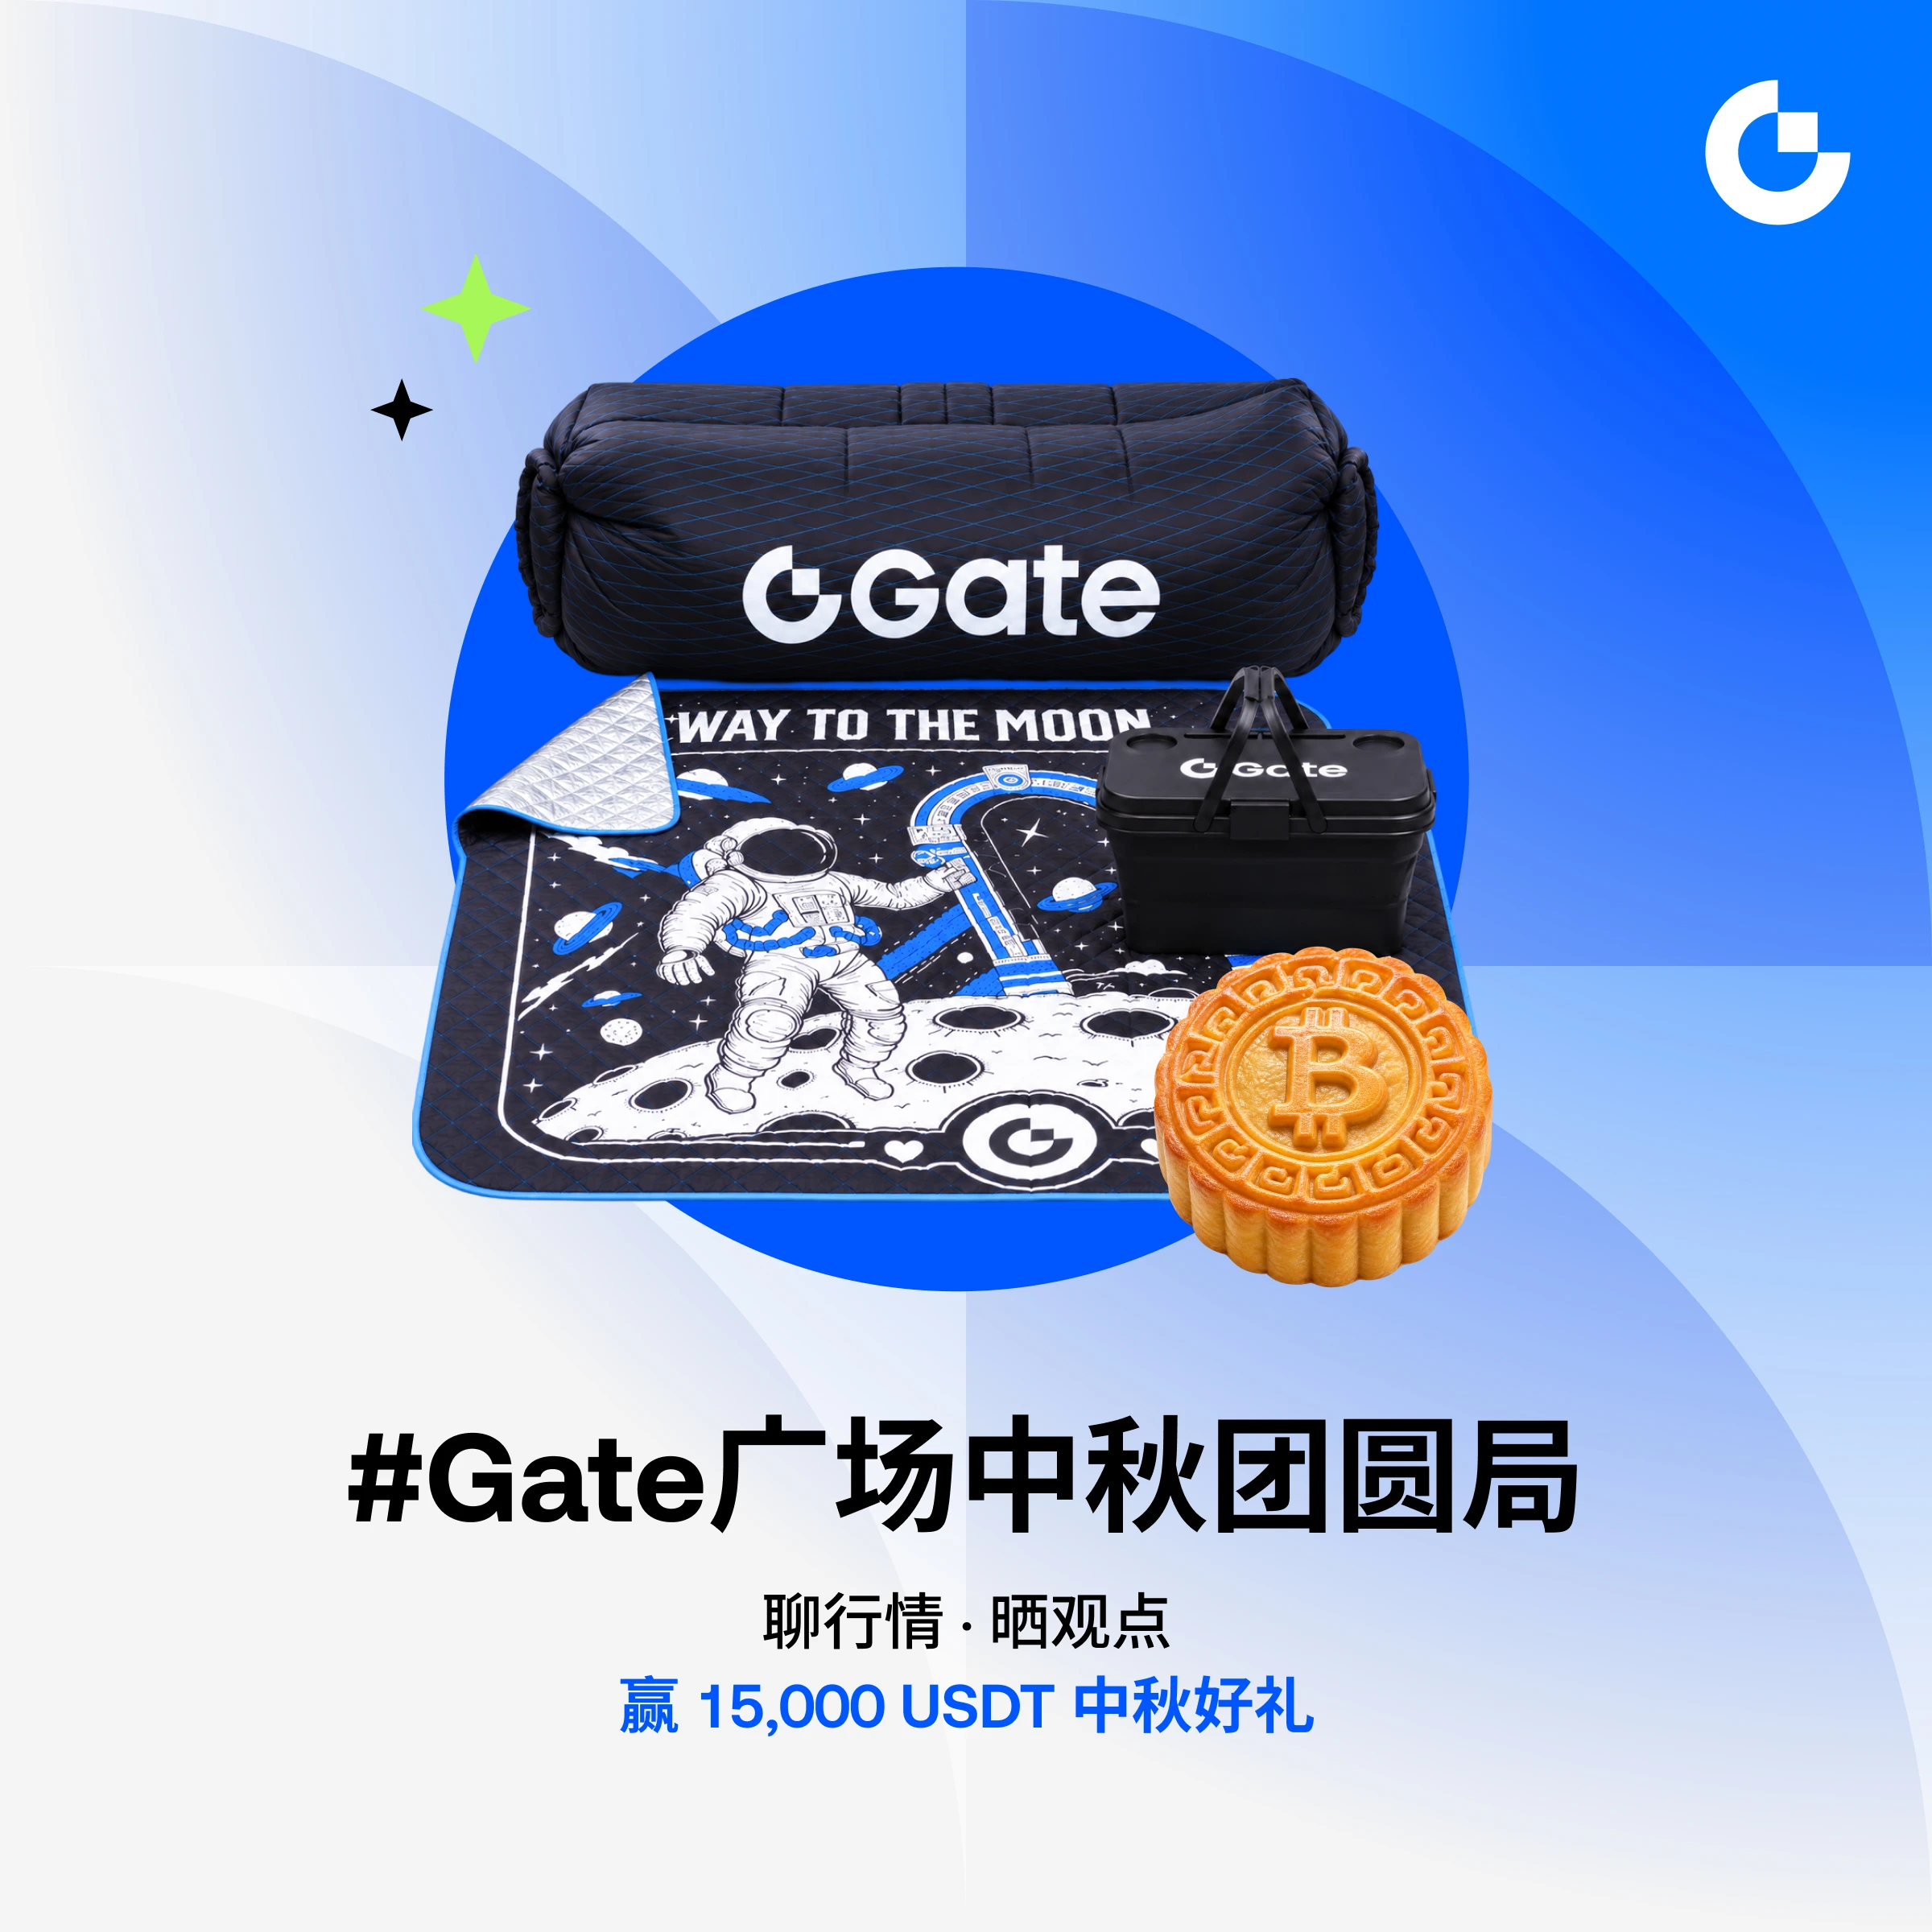




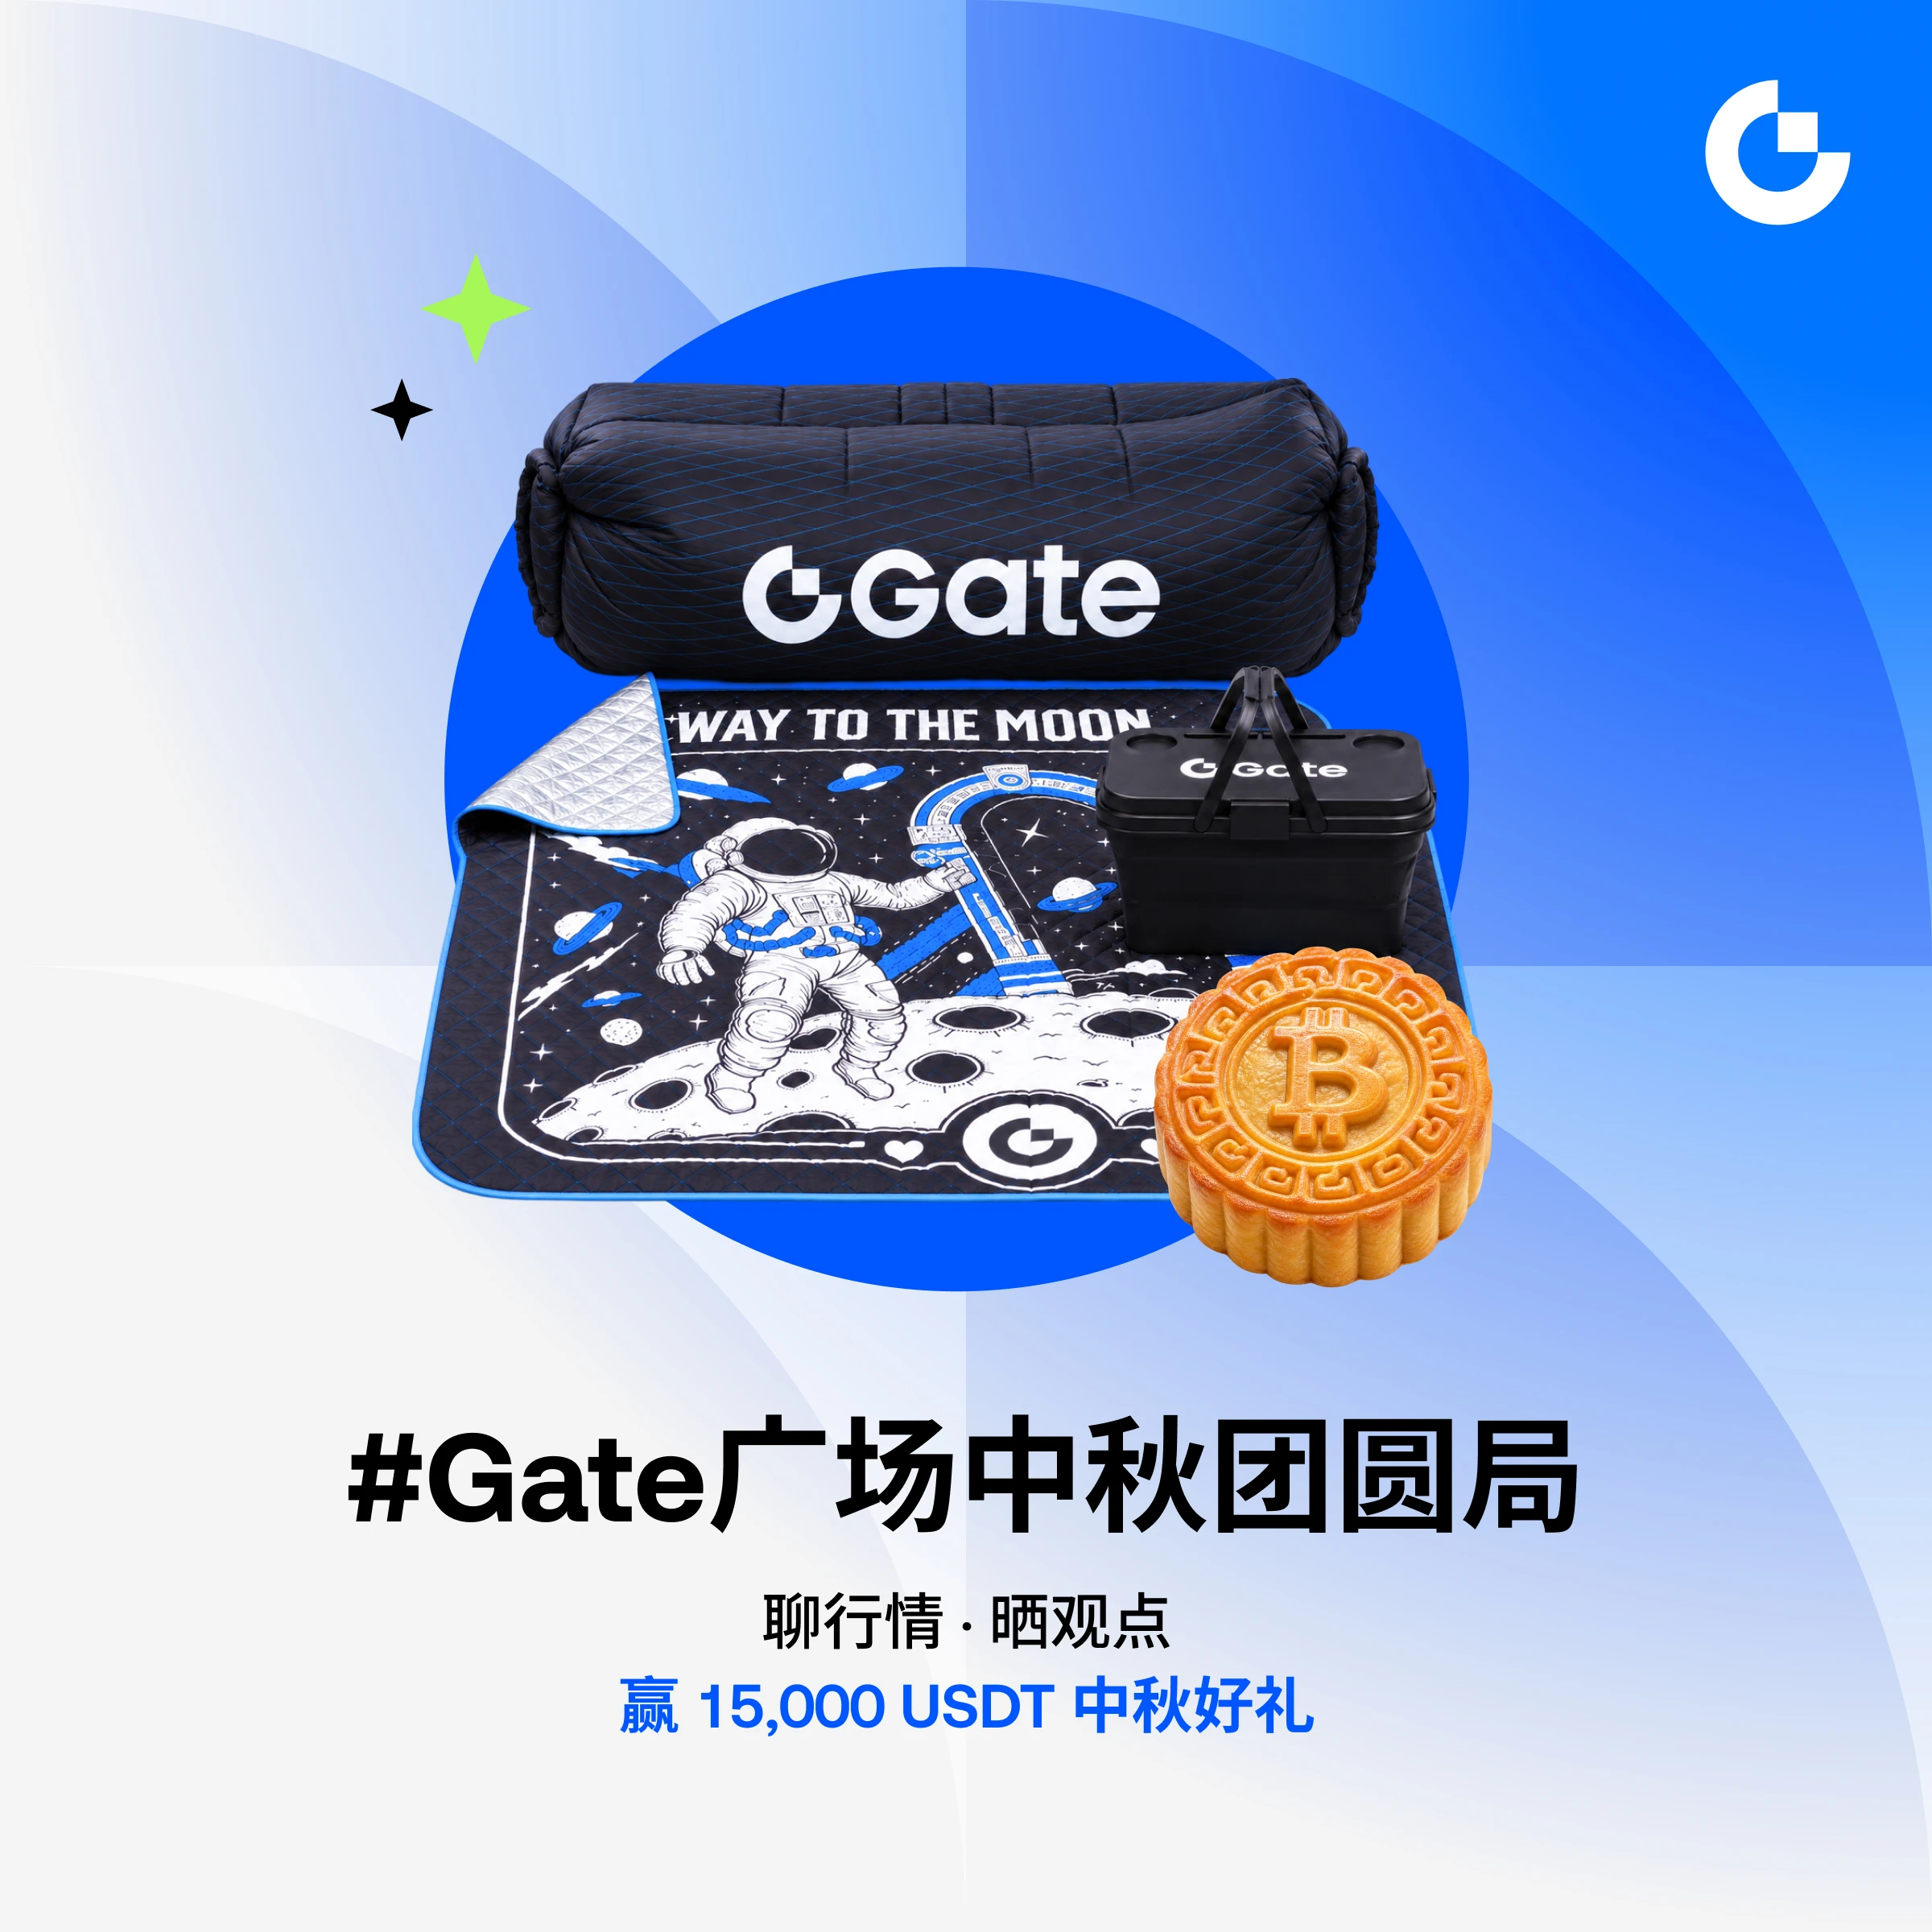
🌕 Grab your share of 15,000+ USDT in prizes—the Gate Plaza “Mid-Autumn Creation Season” is officially live!
Discuss market trends, showcase your trades, and share investment insights—create and win Mid-Autumn prizes!
Participate now 👉️ https://www.gate.com/campaigns/6260
🎁 Mid-Autumn Benefits
1️⃣ Post to enter the red packet draw: up to 5 USDT per draw
2️⃣ Creator leaderboard: Win a Gate Mid-Autumn limited-edition gift box + up to 1,000 USDT
3️⃣ Bonus rewards for quality content: Verified creator badge + content selection + exclusive traffic support
4️⃣ Newcomer first-post gift: 50 lucky users share a 1,000 USDT prize pool
📌 Participation is easy:
① Sign up and include #Gate广场中秋团圆局 + to publish original content on daily trending topics
③ Discuss market trends, share insights, and climb the leaderboard to unlock generous Mid-Autumn benefits!
👉 Post now: https://www.gate.com/post
👉 Event details: https://www.gate.com/announcements/article/101723
Discuss market trends, showcase your trades, and share investment insights—create and win Mid-Autumn prizes!
Participate now 👉️ https://www.gate.com/campaigns/6260
🎁 Mid-Autumn Benefits
1️⃣ Post to enter the red packet draw: up to 5 USDT per draw
2️⃣ Creator leaderboard: Win a Gate Mid-Autumn limited-edition gift box + up to 1,000 USDT
3️⃣ Bonus rewards for quality content: Verified creator badge + content selection + exclusive traffic support
4️⃣ Newcomer first-post gift: 50 lucky users share a 1,000 USDT prize pool
📌 Participation is easy:
① Sign up and include #Gate广场中秋团圆局 + to publish original content on daily trending topics
③ Discuss market trends, share insights, and climb the leaderboard to unlock generous Mid-Autumn benefits!
👉 Post now: https://www.gate.com/post
👉 Event details: https://www.gate.com/announcements/article/101723